TeeBI

Data-mining and Visualization components for RAD Studio
- Active
- Package
- Delphi
- GitHub
- ★ 152
- MIT


30,057 projects in the catalog.
Free Pascal, Lazarus and Delphi components, libraries and programs from GitHub, SourceForge, Codeberg, GitLab and more. Rate them, mark what looks interesting, and talk about them on their benches.
Data-mining and Visualization components for RAD Studio
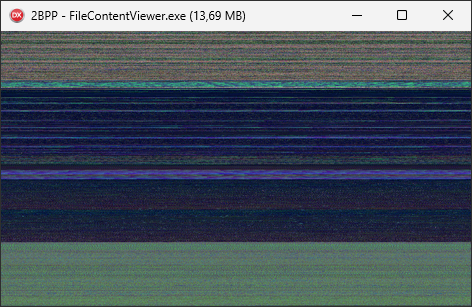
A lightweight, high-performance tool that visually renders the raw binary content of any file as an image. This unique visualization method helps developers, security researchers, and data analysts quickly identify data patterns, compression artifacts, and embedded file formats just by looking at the image.
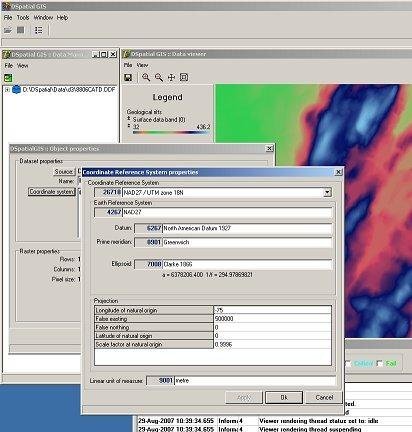
Geospatial analysis and visualization environment for Delphi.
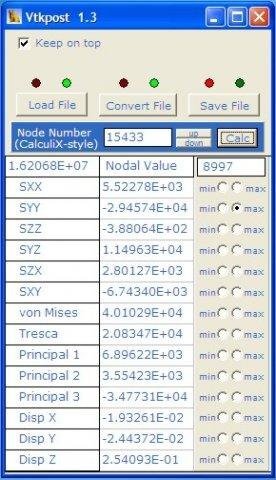
Vtkpost is a conversion program, for Windows, which converts solution files of the freely available finite element solver CalculiX CCX into vtk version 2.0 format for viewing in the scientific visualization environment ParaView.
BlackartBox 3D monitor for RoboCup simulation visualization.
SImg is astronomical image processing software for Linux. Some of the features are deconvolution (various algorithms), removing interferences, automatic shifting of images, computation of PSF and and a visualization tool.
FreePascal code to display data lists in TListView / TTreeView / TComboBox(Ex) with a single assignment.
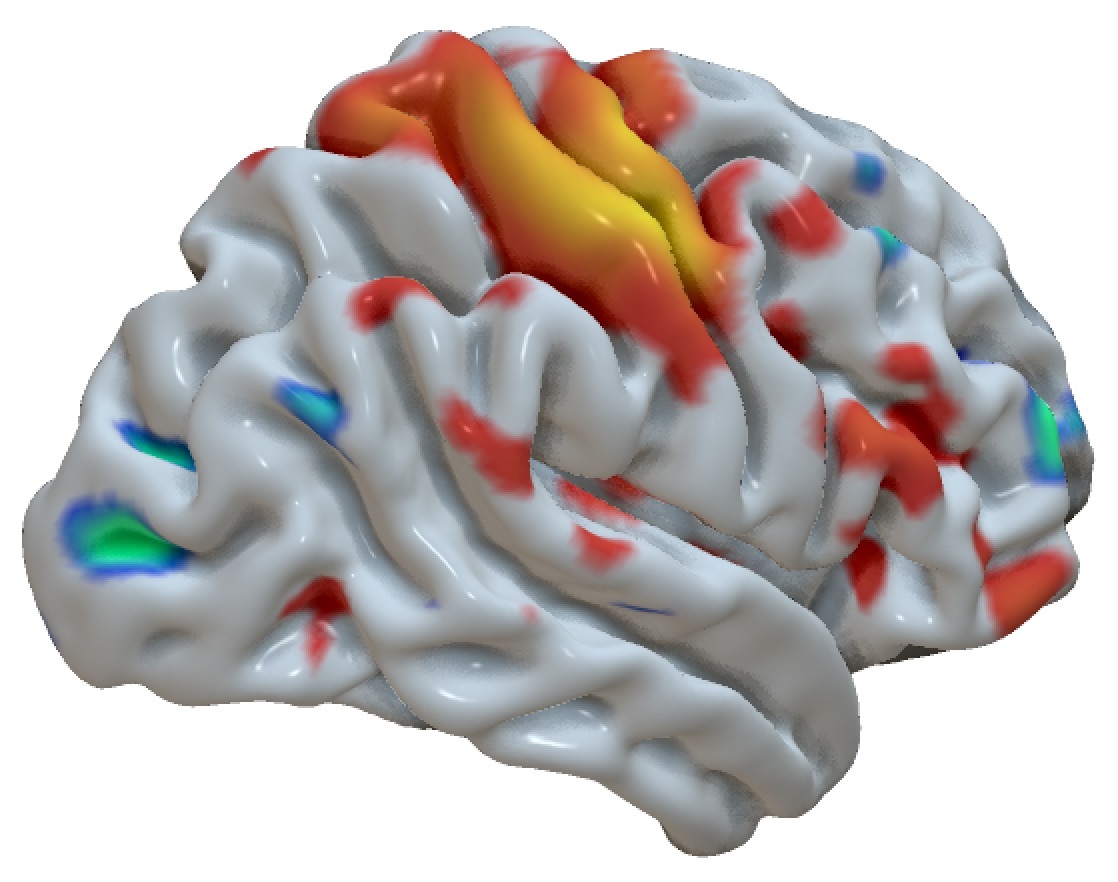
GLSL surface rendering source code. Compiled versions available from NITRC. Loads 3DS, CTM, DXF, FreeSurfer, GII (GIfTI), GTS, LWO2, MS3D, MZ3, NV (BrainNetViewer), OBJ, OFF, PLY, STL, VTK. Tractography formats include BFloat, PDB, TCK, TRK, and VTK. Also NIfTI format voxelwise images.
Cross-platform media player built with Lazarus/Free Pascal and libmpv. Features playlist management, internet radio, equalizer, visualizations, stream recording, and 100 language translations.
Visualization of measuring data
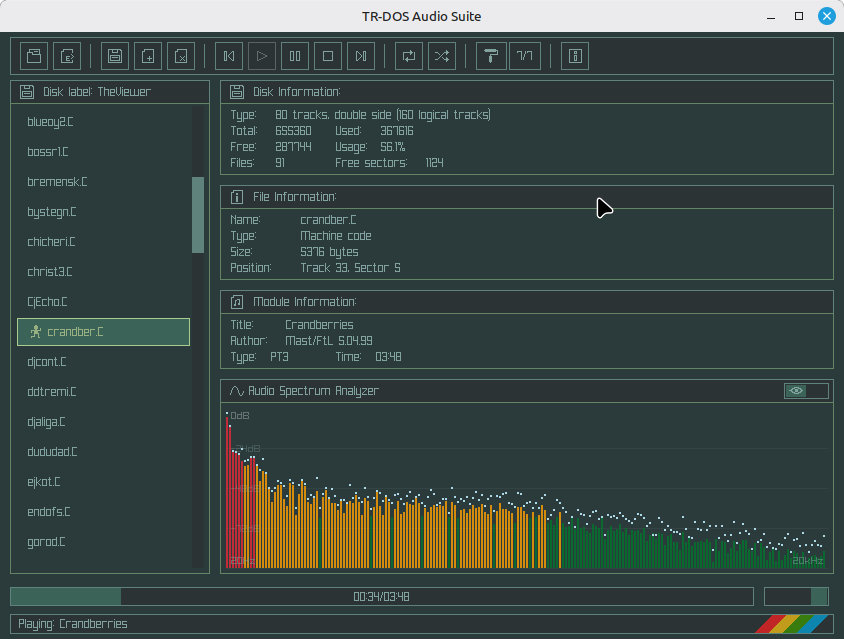
TRD Audio Suite is a music player for tracker formats inside ZX Spectrum .trd disk images. Extract and play modules, real-time spectrum visualization, file export. Drag & drop support, create and edit disk images. Compatible with AY/YM, PT3, ASC, STC, TXT and more.
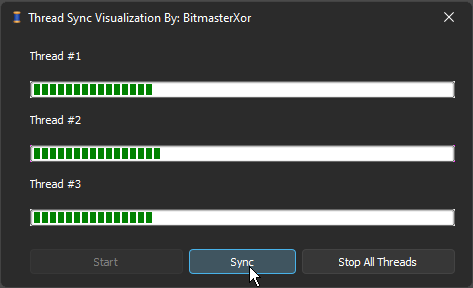
A visual demonstration of thread synchronization in Delphi, featuring real-time progress tracking and color-coded state visualization. Perfect for learning concurrent programming concepts and thread coordination patterns.
Visualizations in Delphi
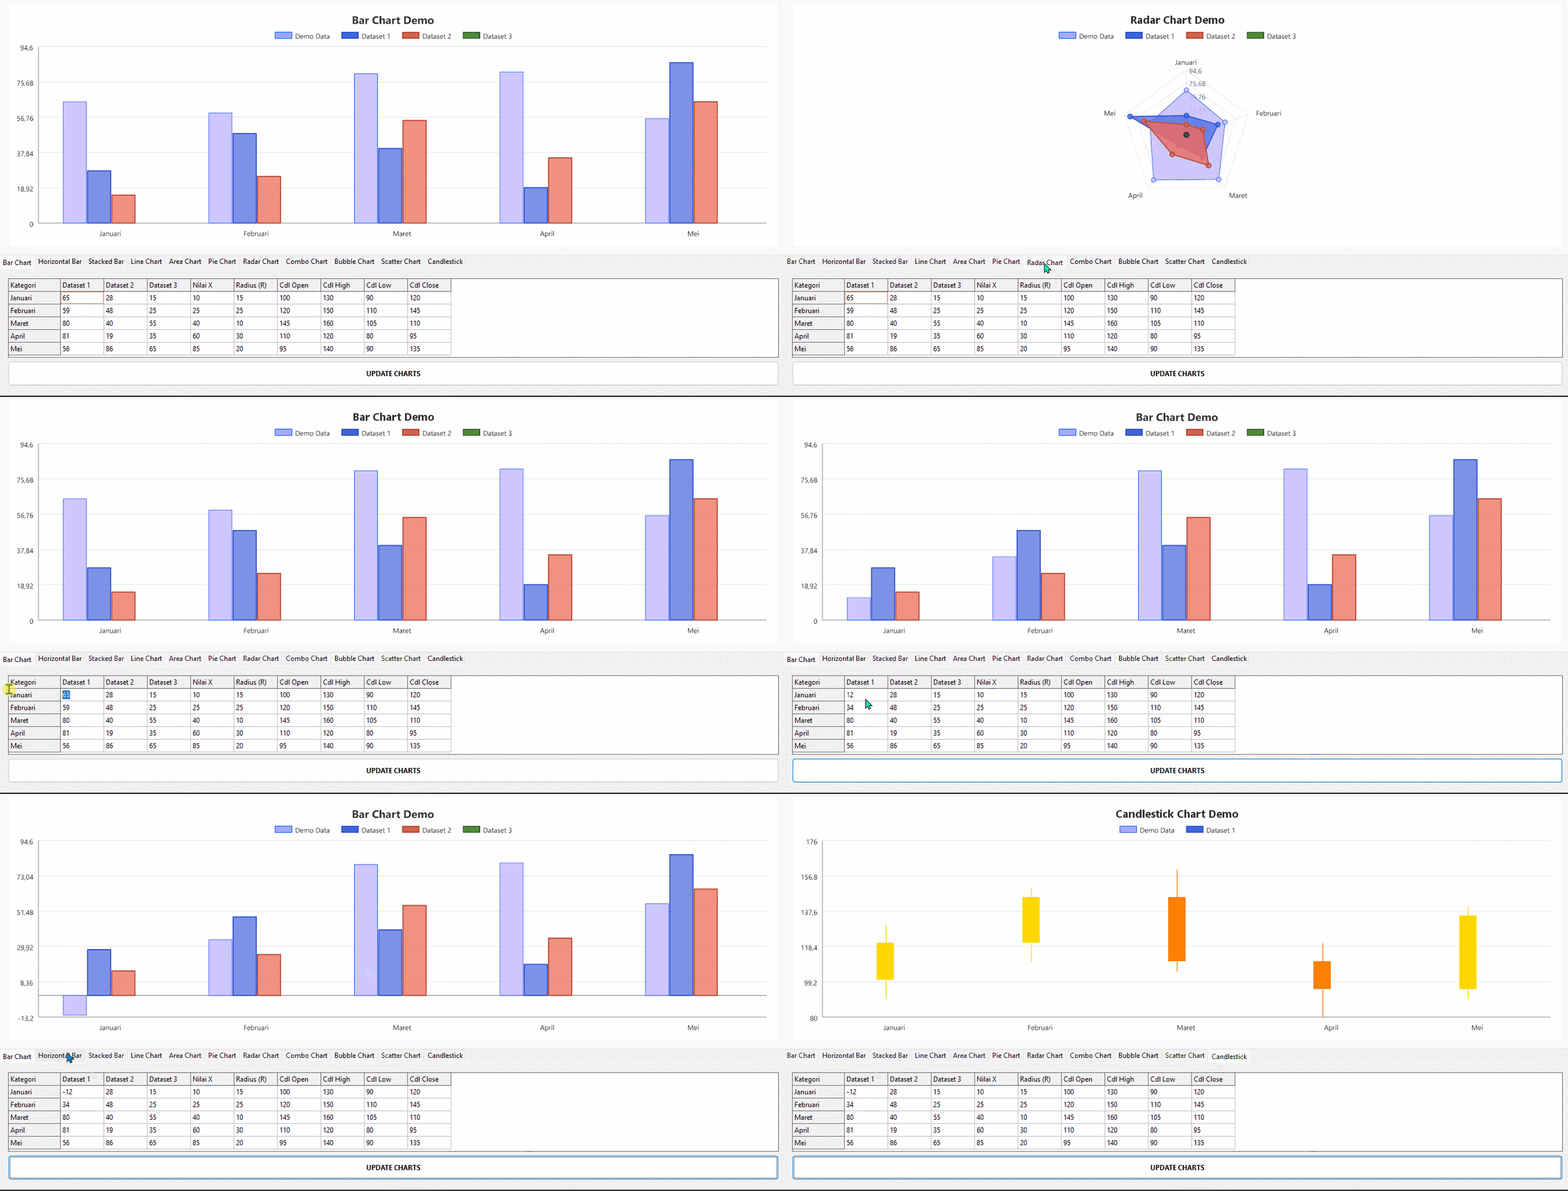
An interactive, high-quality (Enterprise-Grade) data visualization component library for Lazarus/Free Pascal, powered by smooth anti-aliased rendering from BGRABitmap. Comes with 11 ready-to-use modern chart types.
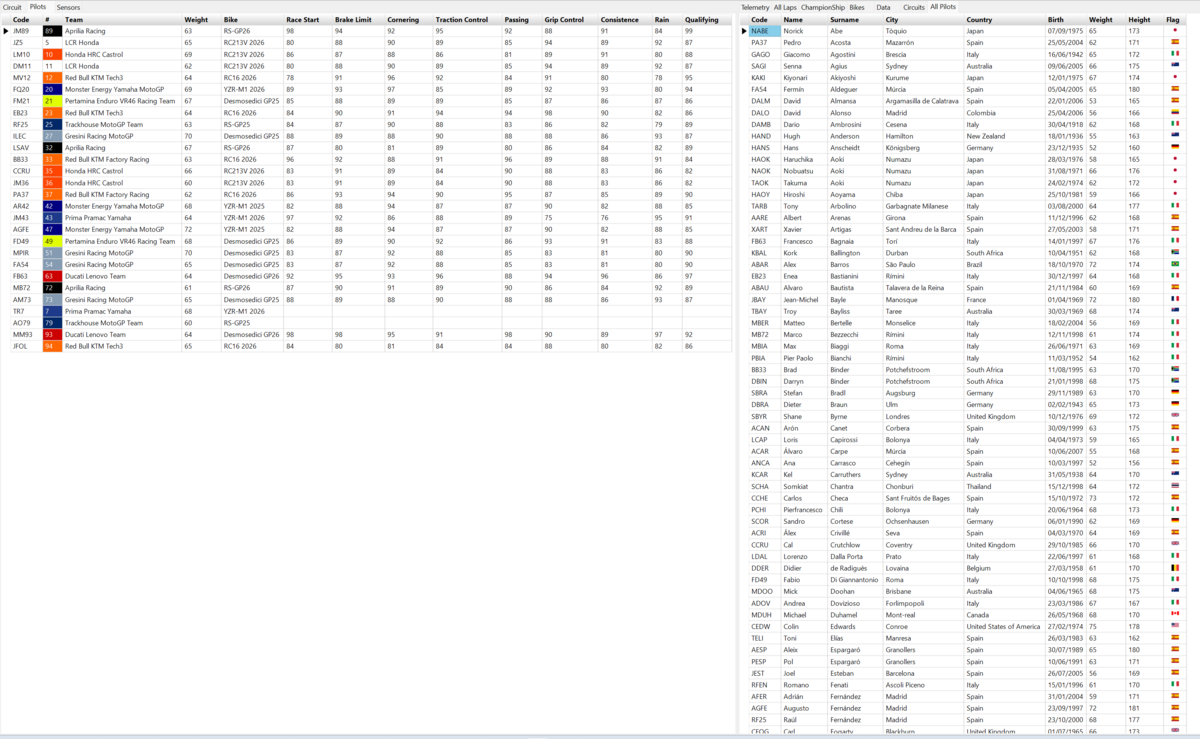
MotoGP simulator with TeeCharts, Circuits, and Telemetry visualization
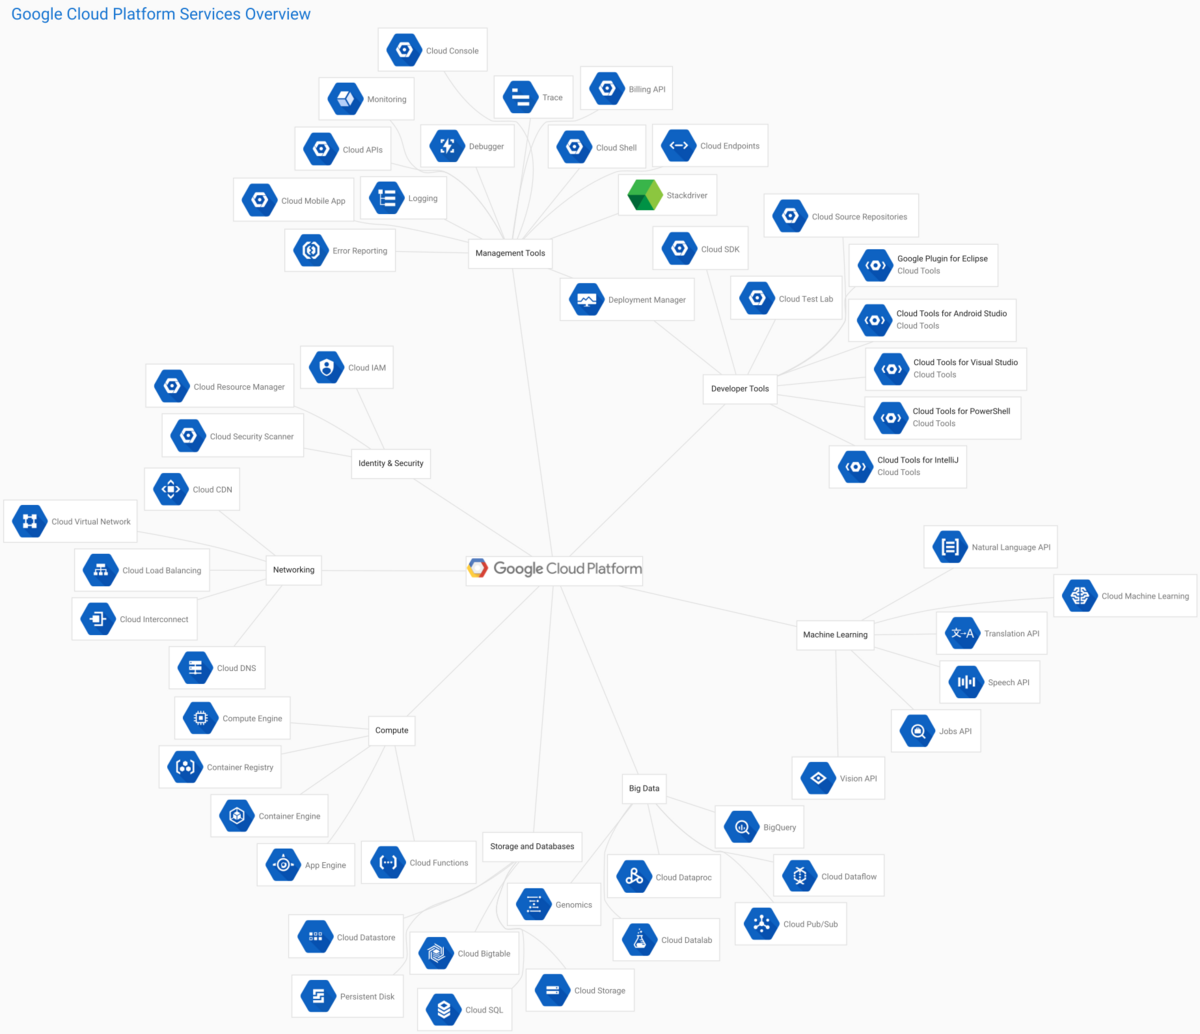
Google Cloud Platform services architecture visualization with Graphviz
World of Tanks's eXtended Visualization Mod one click installer/updater
A comprehensive toolkit designed for the generation, analysis, and visualization of Generative Topographic Maps (GTM).
Real-time voice changing demo in Delphi for .NET. Captures audio from the microphone, processes it with FFT-based windowed spectral transformations, and plays back the modified voice with basic waveform visualization. No formal license—free to use and modify.
Events timing visualization tool for LTE, etc.
Winamp visualization plugin.
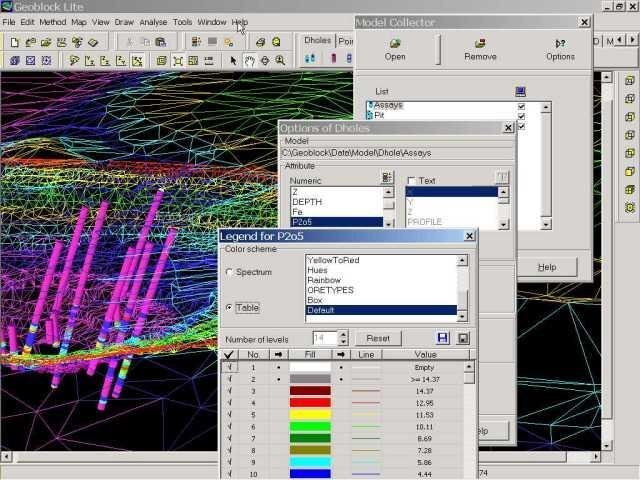
Geoblock is a program for 3D modeling, database management and visualization of geoscience datasets. It is developed for mineral deposit exploration, ore reserve estimation, mine planning and simulating geotechnical processes in mine sites.
Simple medical imaging visualization tool designed for NIfTI images. Includes dcm2nii for conversion of DICOM, Philips, and other proprietary formats.
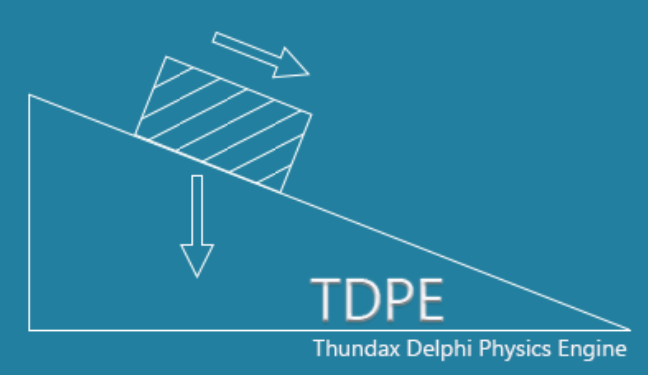
🛴 "Thundax Delphi Physics Engine" is a Delphi-based 2D physics engine for simulations and visualizations. It employs Pascal and is ideal for learning and experimenting with 2D physics concepts.
Native Delphi charting library for VCL and FMX: clean newspaper-style defaults, PNG export, zero dependencies
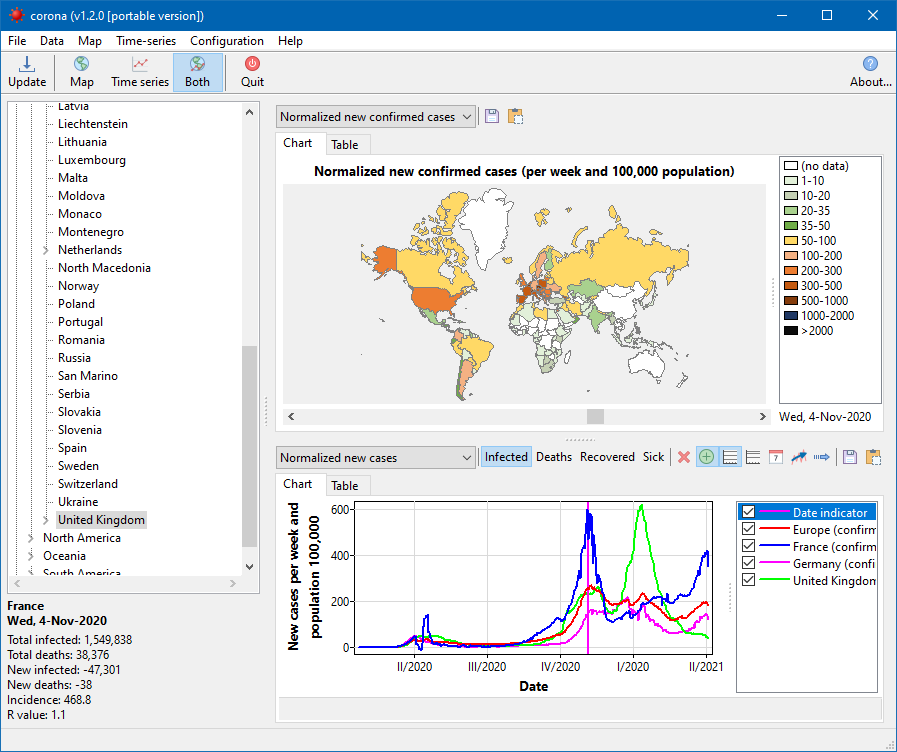
Plots and analyzes daily data of the Covid-19 pandemic
Pascal Dependency Visualization Tool
Lazarus application project with a TChart component and a plugged in TChartToolset component and configured tools to visualize and explore blood data in a chart
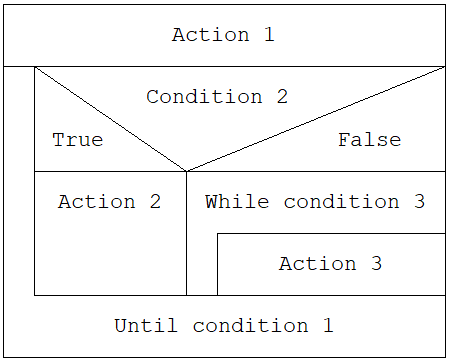
Nassi-Shneiderman Editor: Intuitive graphical tool for creating and editing Nassi-Shneiderman diagrams, enhancing algorithm visualization and software development
Computer-Assisted Qualitative Data Analysis Software (CAQDAS) for coding textual data, retrieving coded segments, and analysing patterns
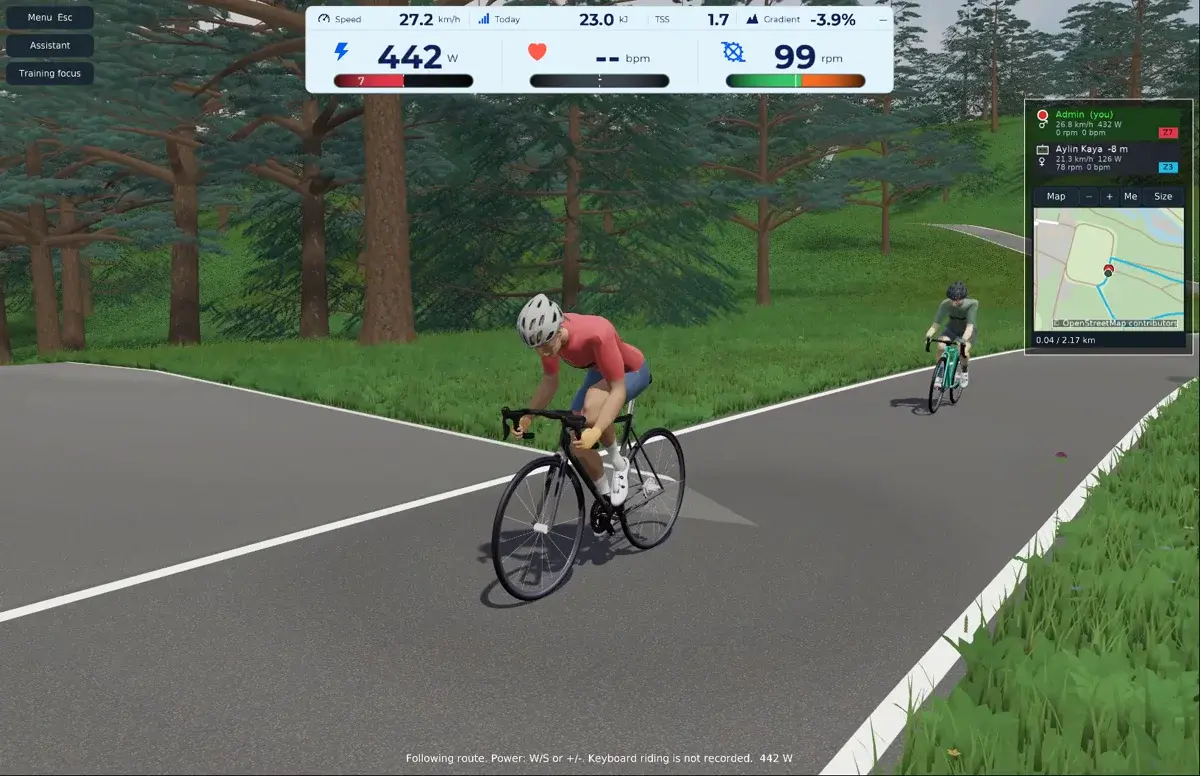
Open-source Zwift alternative in alpha: train on a smart trainer or freely explore OpenStreetMap in 3D. Indoor cycling, interval workouts, walking, free flight and Dream Worlds.
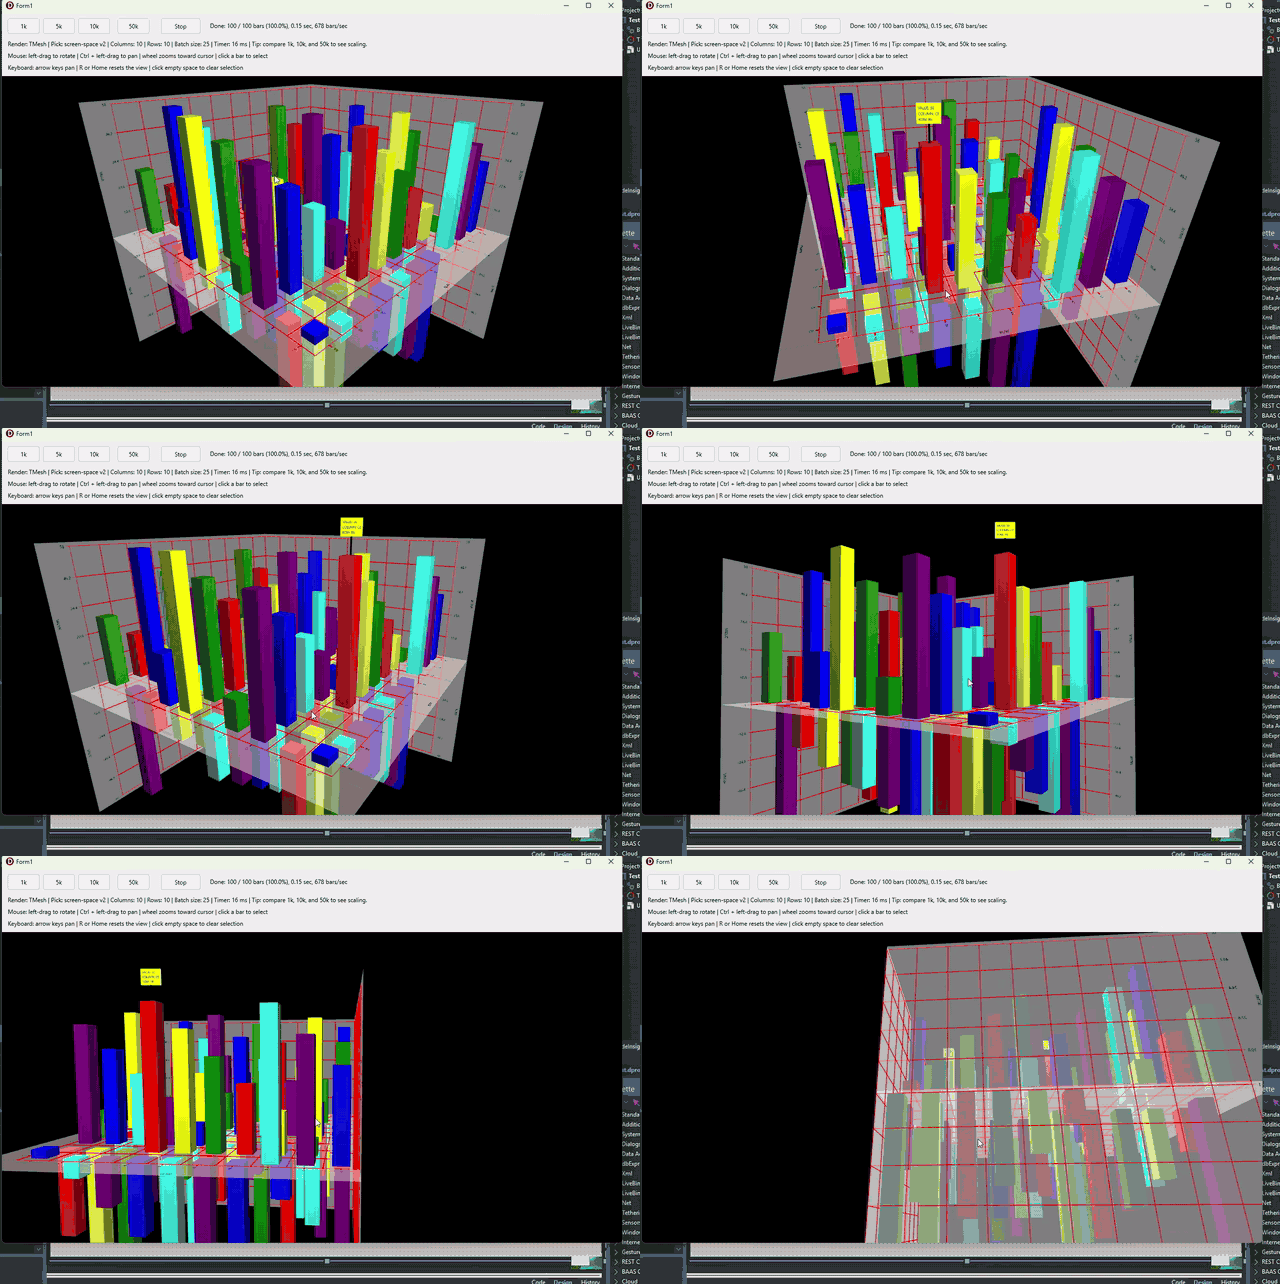
Delphi FireMonkey 3D bar chart component for dynamic and large datasets.
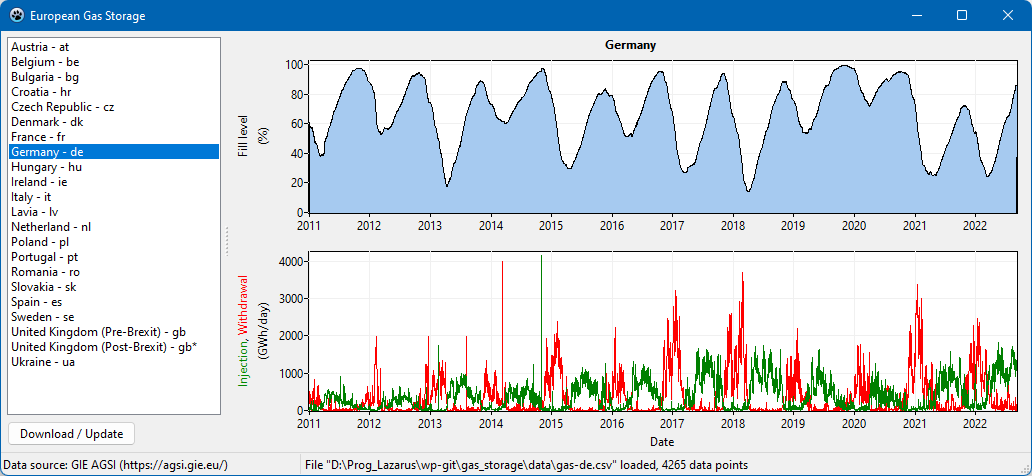
Plots a time-series of the gas storage levels in European countries
Diplom in Physik, Univ. of Bonn, Institute of Applied Physics
visualization algorithm for crowdflow's firefly movies
Spektrum Telemetry Log File Viewer
HELL STORM — Open-source analysis tool for studying competitive game mechanics in isolated test environments. Provides real-time memory reading, advanced data visualization, and interactive simulation to understand system responses. Designed for researchers and developers exploring security boundaries and improving defensive mechanisms.
Games and Game Engines Science
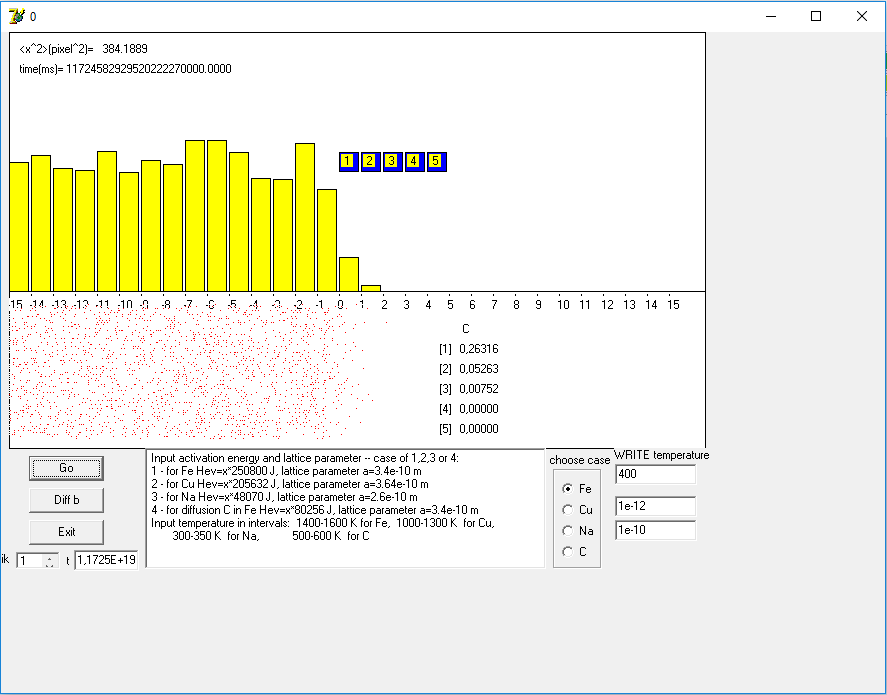
Computational Experiments in Materials Science. Diffusion in Solids
A music visualizer written in obj fpc Free Pascal
A lightweight, Weka-inspired tool built in Pascal. It allows users to apply statistical methods, execute data mining algorithms, and generate plots for data summarization and visualization.
A CLI application to display contents of the data files
Oscillograph - Visualization for AIMP
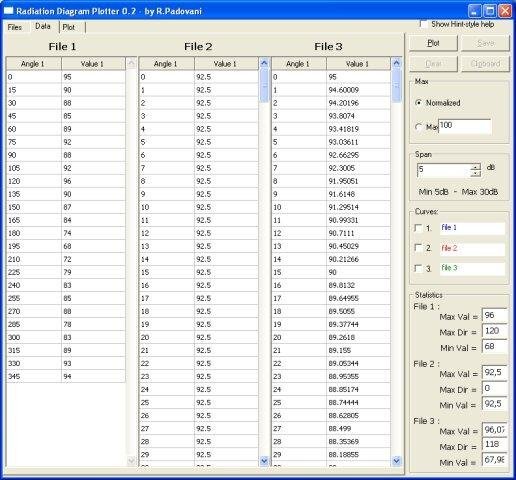
Antenna Radiation Diagram Plotter - Polar plots of measured EM emission, with a proper radial axis scaling and span. Three source files (plain text) can be loaded and plotted at the same time. Export to file or clipboard.
This software uses data gathered from published biodiversity inventories, together with physical and vegetational maps, to build a biodiversity map (darkening geographical landscape according with the richness/diversity of species).
BotanicalVis is a tool to visualize huge hierarchies in 3D-space. It reads file data and shows the hierarchical structure of used disk space in a botanical tree. Therefore the user should be able to imagine where the biggest files live.
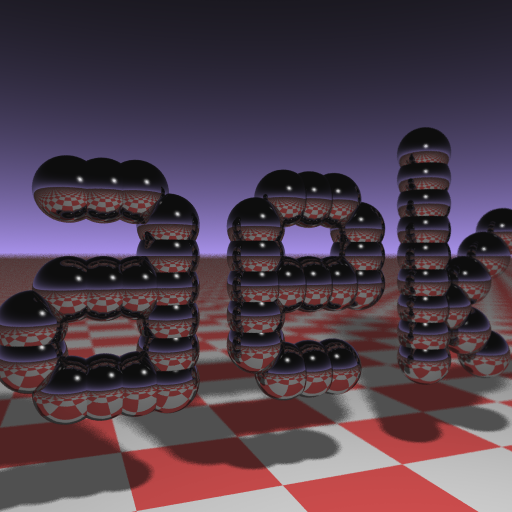
This is a short C++/Java/C#/Python benchmark. Based on Paul Heckbert's sources. Thank you Paul!
Census, formerly NONMEMory, is a project manager for population pharmacokinetic and pharmacodynamic analysis using the nonlinear mixed-effect modelling application NONMEM.
This programm draws charts and diagramms out of many different also usertyped terms.
Clad organizes a tree of biological species, allowing the user to add scientific and popular names, origin, distribution, apomorphies and other information such as pictures or if the clade is extinct. Browsing through the trees is easy and educative.
Software for the Conrad/Voltcraft Charge Manager 2010 battery charger. PROJECT MOVED.
Delphi & Kylix Components project - Components & Classes for graphic representation of objects (for Visio-Like software). The purpose is to build easy-access librairies for building IDEF,OMT,UML,E/R,Graphcet,Organigram applications.
Creative Side is a group of projects designed to unleash creativity through multimedia: graphics and video. Creative Side helps you unleash digital content and share it with friends.
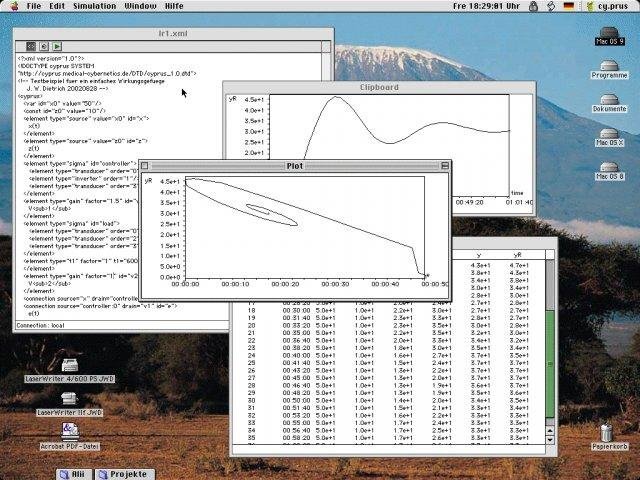
cy.prus is a cross platform simulation environment for medical cybernetics and systems biology. Its purpose is to provide both a facility for simulating life and a GUI for easily constructing biological information processing structures based on XML.
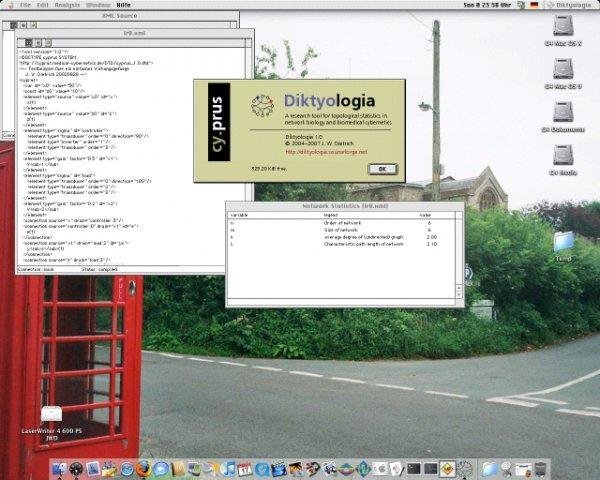
Diktyologia is software for investigating complex systems with advanced methods of network theory. The package allows for analysing statistical properties of directed intercausal networks that are represented in form of cy.prus XML files.
Domotix is a home automation software developped in Delphi for the central system, in Php for the actions scripts, and where datas are centralized in a MySQL database.
"DSO" is a Digital Signal Oscilloscope. My DSO will be connected via the USB to the PC. All software to operate the DSO is developed within this project.
Shader Assembly Compiler (SHARK) is a tool to perform automatic conversion from DirectX 9 pixel shader assembly language into a C++ code that performs corresponding OpenGL states setup via IHVs propietary- or ARB-extensions.
FastGEO is a computational geometry library written in the object pascal language.
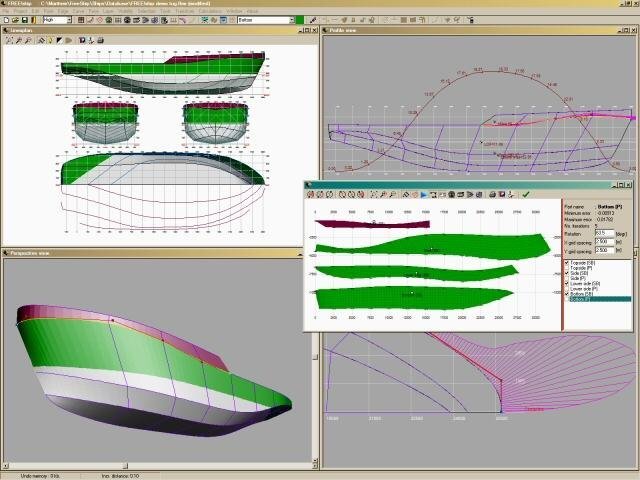
FREE!ship is a surface modeling program for designing ships yachts and boats. Subdivision surfaces are used rather than NURBS to give the designer the freedom to design ANY desired hullshape. Unfold surfaces, panel based hydrostatics, various exp formats