Live chat for Free Pascal, Lazarus, Delphi and every Pascal programmer.
Catalog
30,061 projects in the catalog.
Free Pascal, Lazarus and Delphi components, libraries and programs from GitHub, SourceForge, Codeberg, GitLab and more. Rate them, mark what looks interesting, and talk about them on their benches.
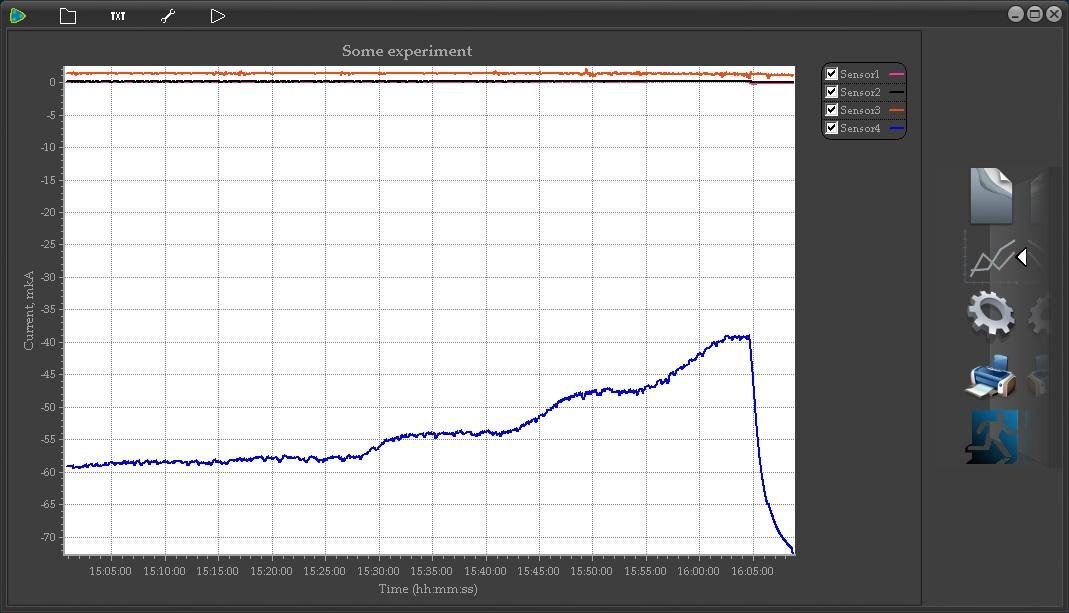
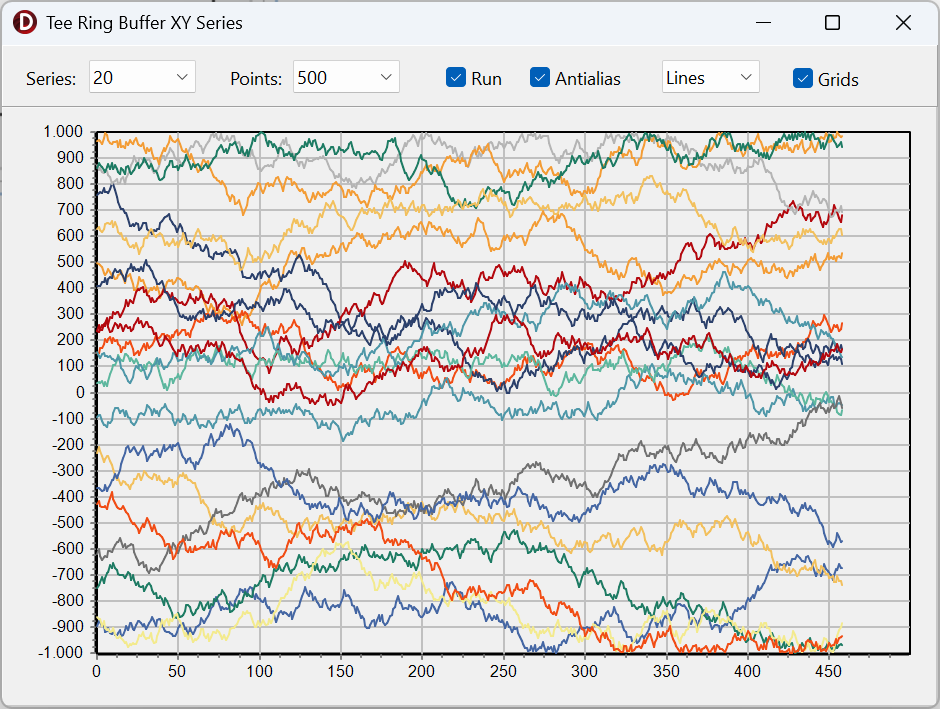
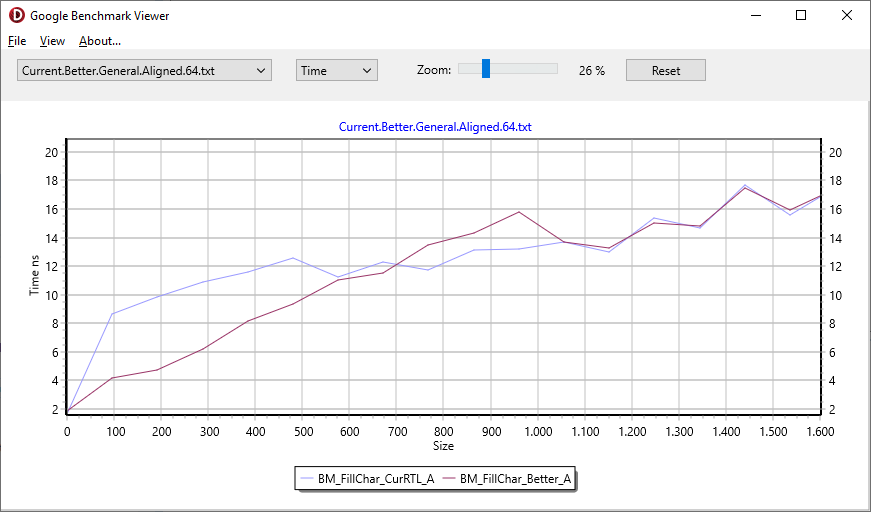
The software was designed for suitable chart creation. From text files or programs, that haven't visual charts themselves, data is passed to "Graph Capture" and plotted there. But you have to write Perl RegEx expressions to extract X and Y-values from raw data. Otherwise, you can request suitable filter templates here https://www.facebook.com/vlad.dubov.77. For making RegEx expressions short docs are also included in the program. You can find "Help: regular expressions in Perl" in the installation folder or in the program's top bar. The program can plot charts from a static file ( just drag and drop the file) or from a dynamically written file - by using a plugin that "connects" to the source. Win 32/64 7/8/10/11 and probably XP ;)
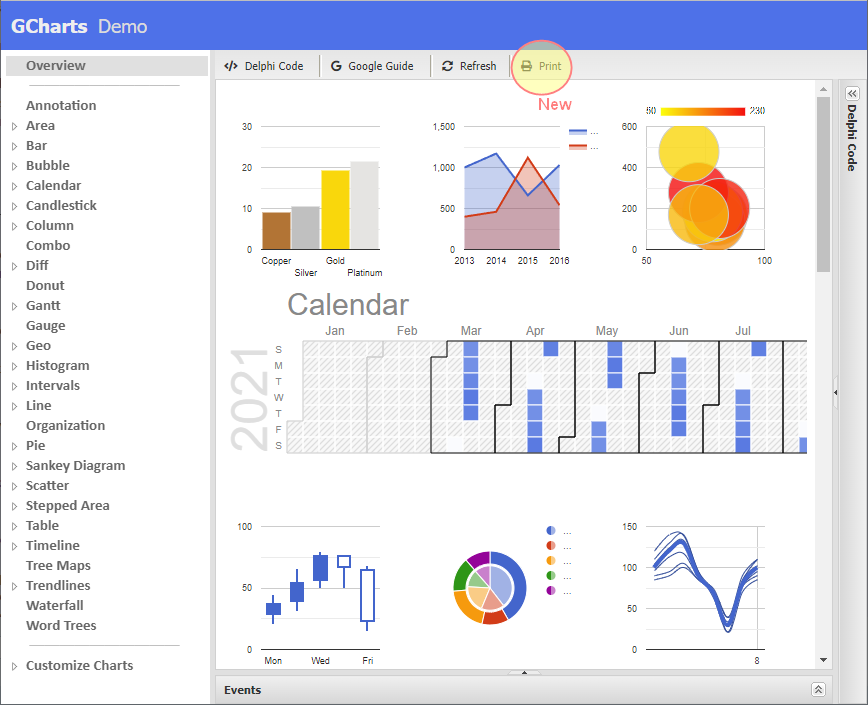
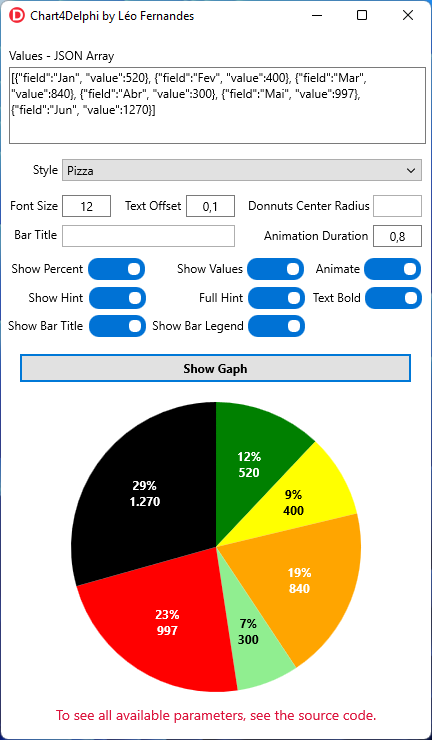
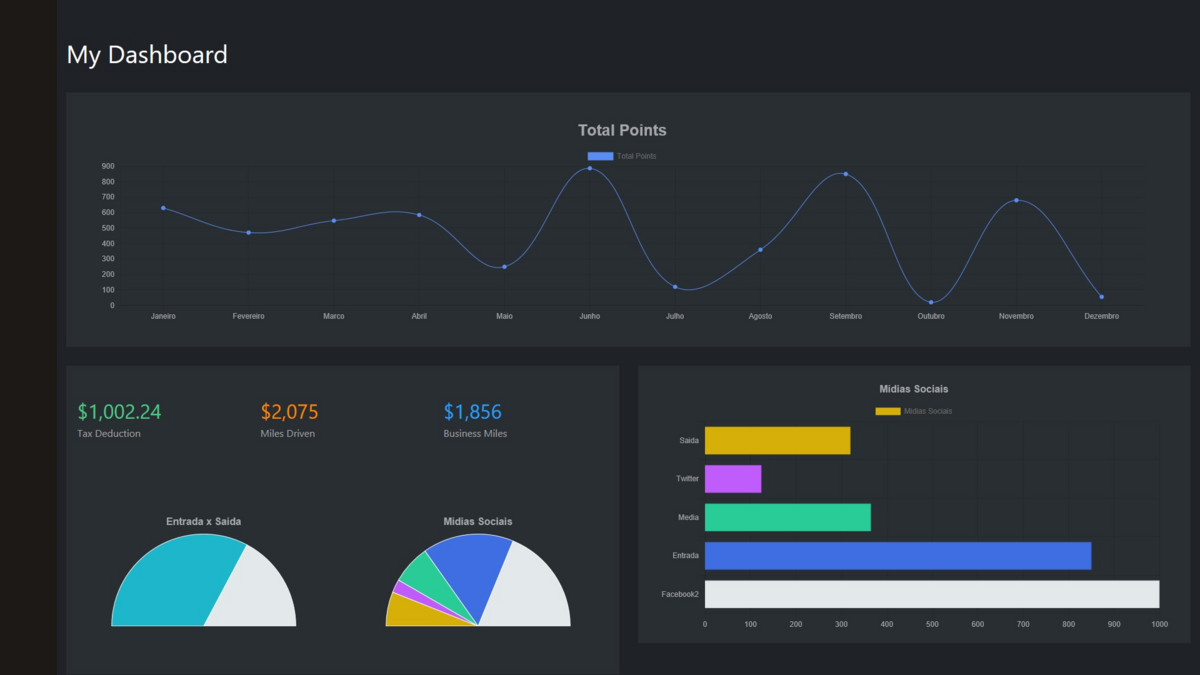
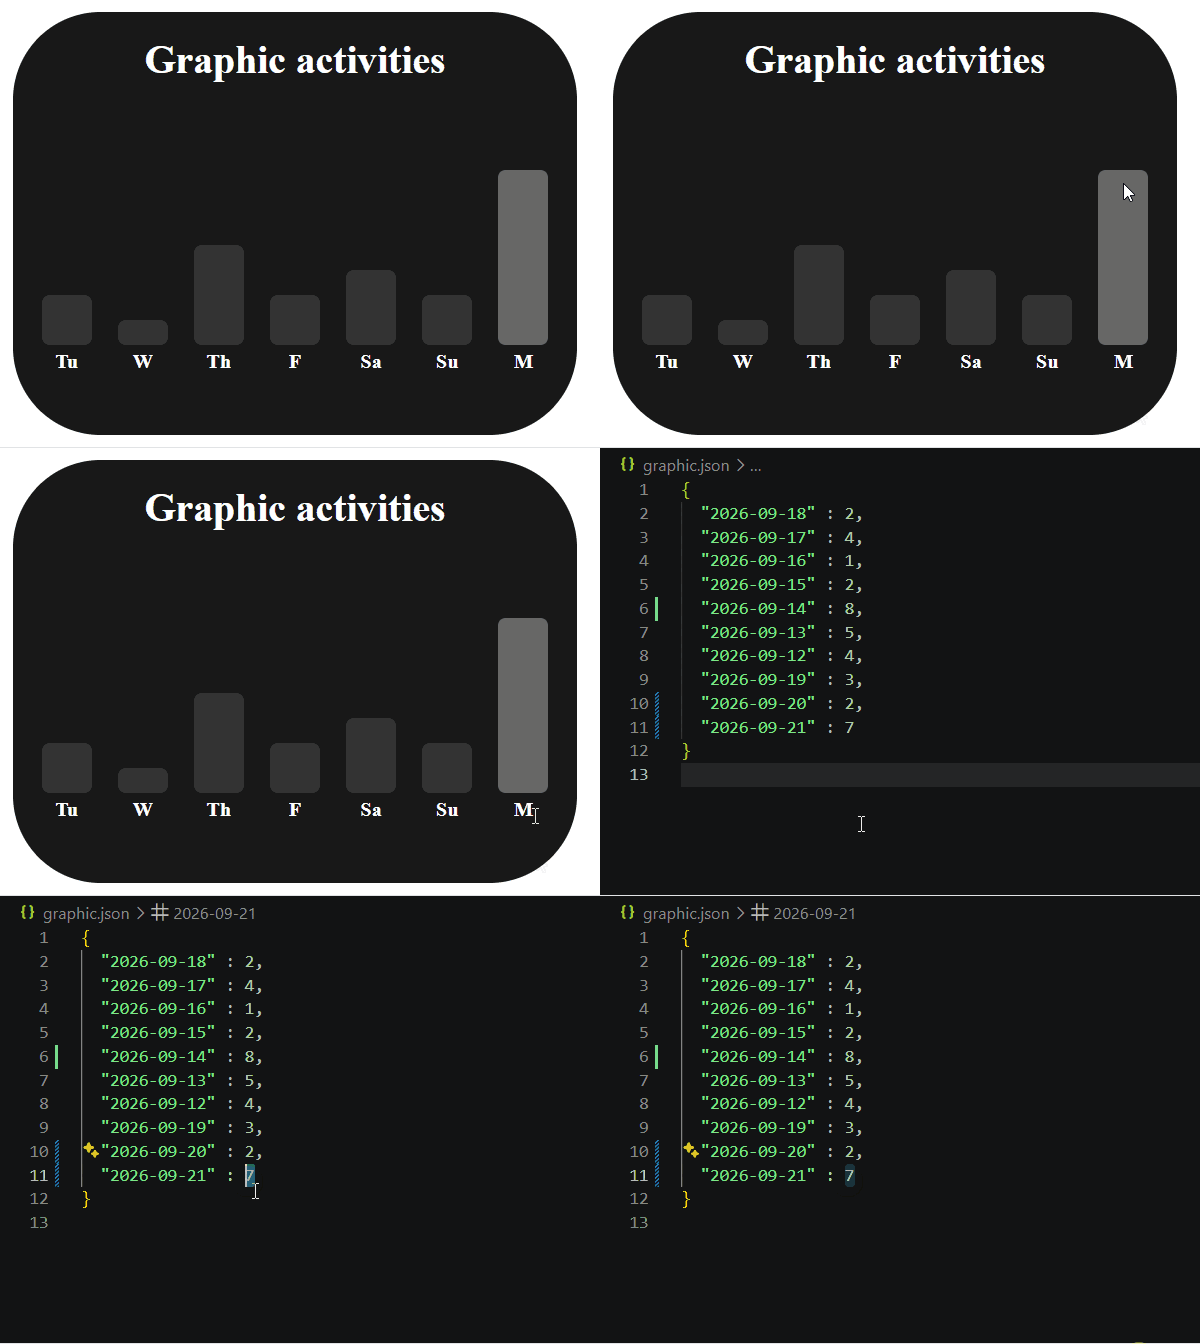
Este repositório contém um conjunto de classes Delphi desenvolvido para gerar gráficos no formato HTML. Inicialmente criado para um projeto em D2Bridge, um framework que permite compilar projetos VCL ou FireMonkey para a Web com o mesmo código.
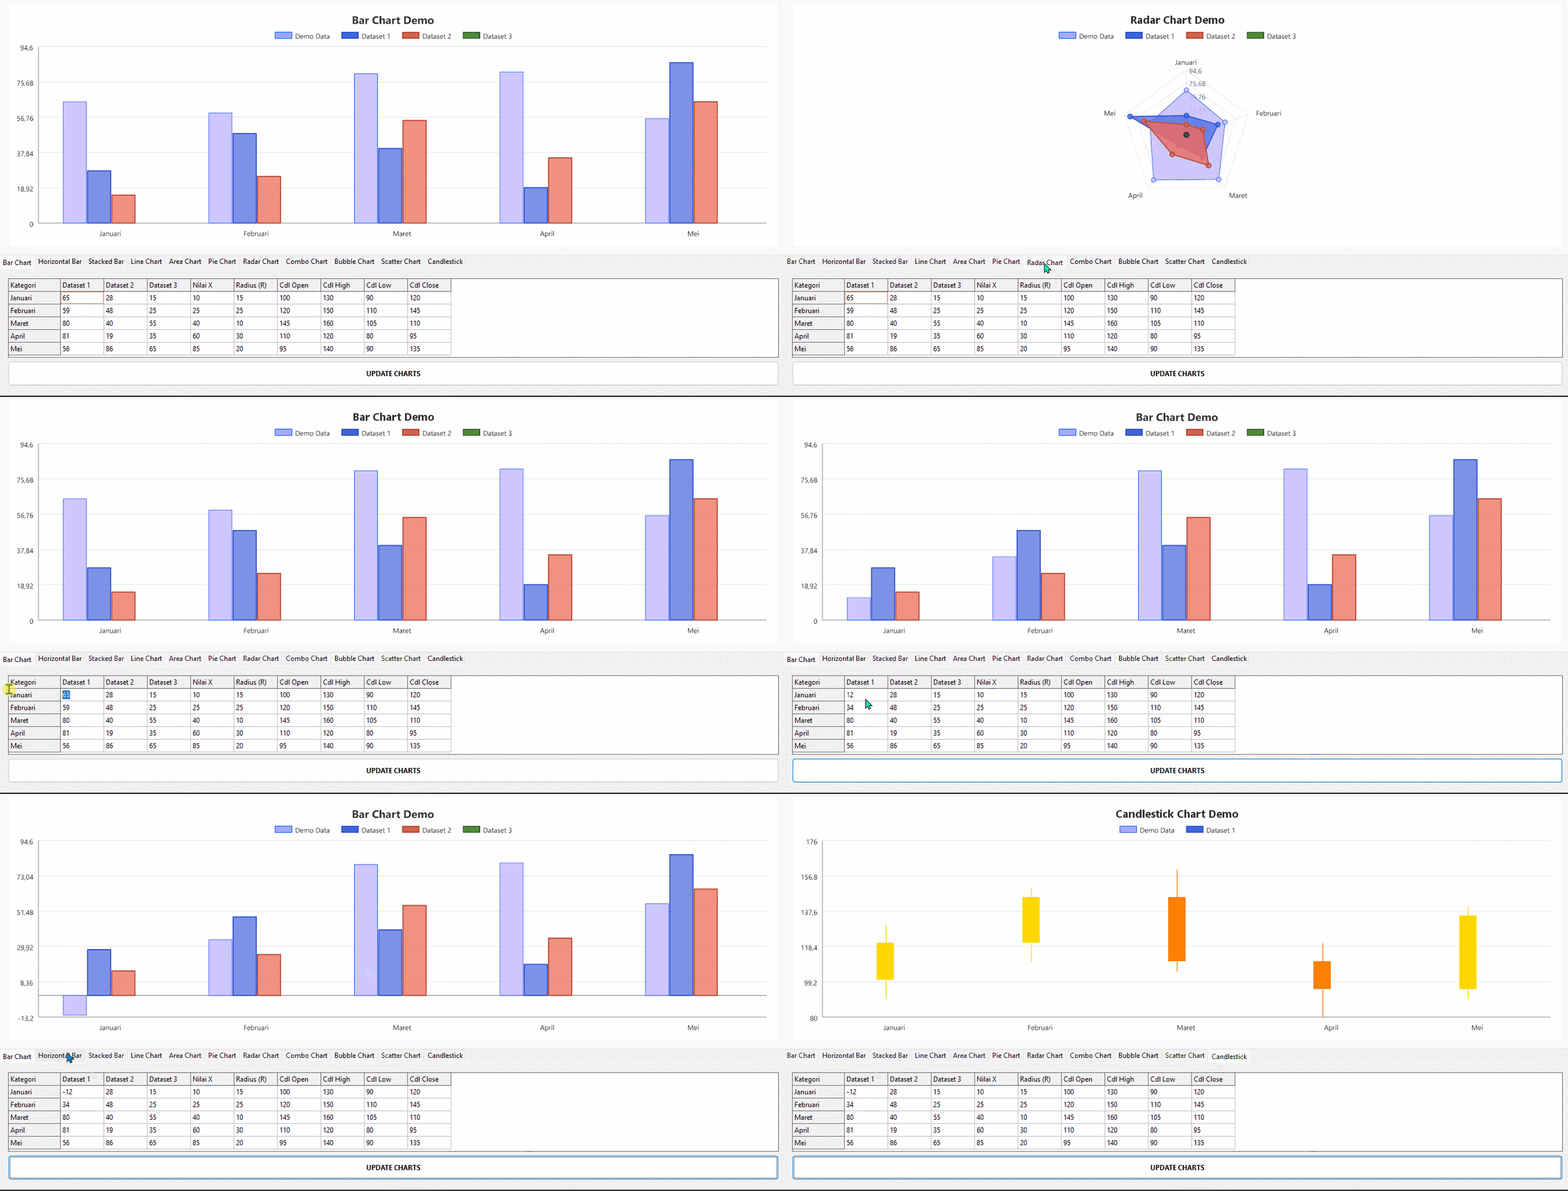
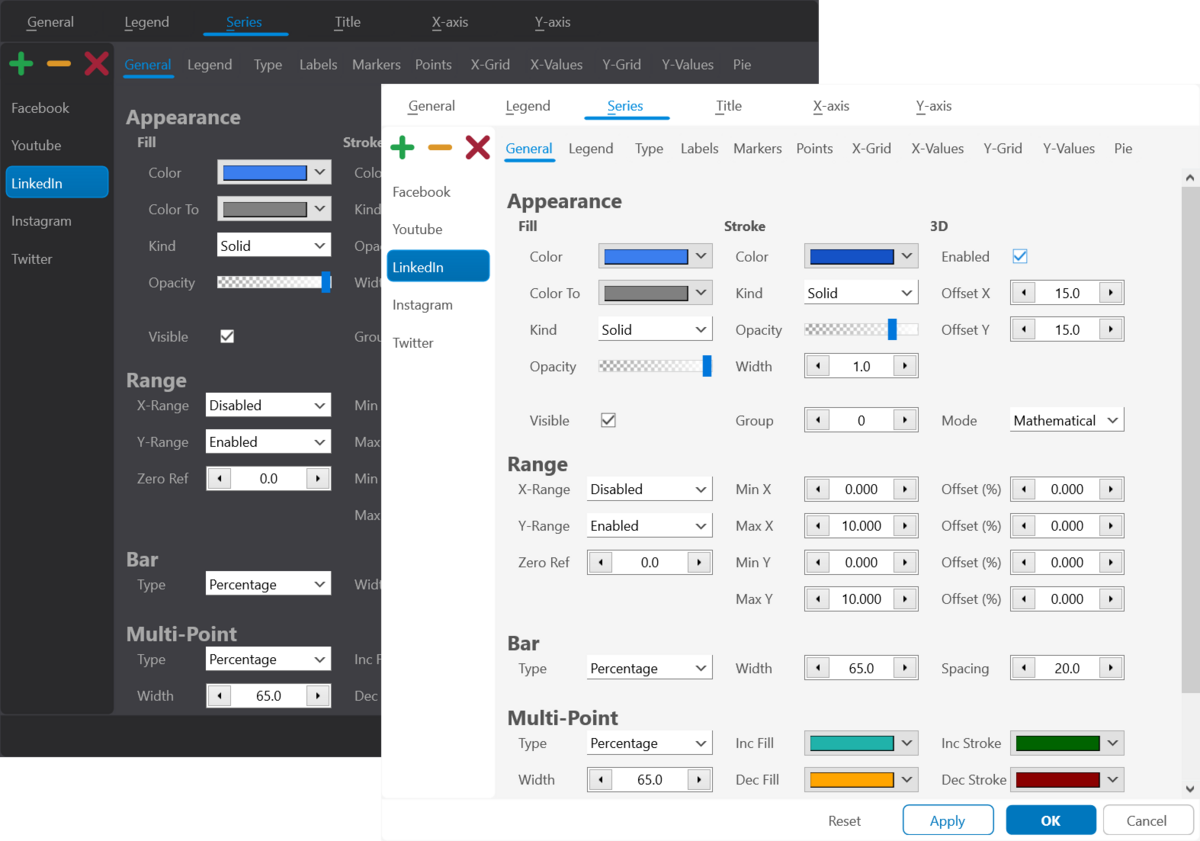
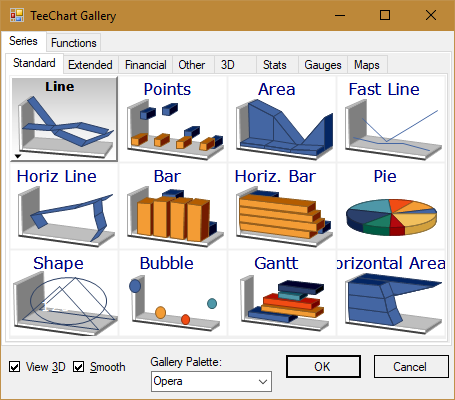
An interactive, high-quality (Enterprise-Grade) data visualization component library for Lazarus/Free Pascal, powered by smooth anti-aliased rendering from BGRABitmap. Comes with 11 ready-to-use modern chart types.
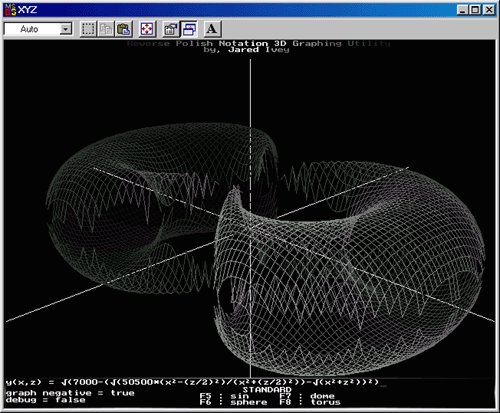
A plotting engine and a visual component that draw what MathParser computes: curves with their discontinuities, intersections and extrema, cartesian and polar systems, and surfaces z = f(x, y) with contour lines. The engine samples on worker threads, knows nothing about a canvas and builds headless; the component is a thin layer over it. Free Pascal 3.2.2 and newer builds it: the sort in CrossVision.Geometry that once needed function references is written out in the same unit. Delphi 10.2 Tokyo and newer builds it as well.
Indicador de momentum de dupla validação para ProfitChart. Utiliza um sistema de RSI duplo (rápido + lento) em confluência com ADX e DI System para filtrar sinais falsos e confirmar a força e a direção do movimento com maior precisão
The Periodic Table is a chart that organizes all known Chemical Elements by increasing Atomic Number (number of protons), with Elements arranged in rows (periods) and columns (groups) that reveal trends in their Chemical and Physical Properties.
A graphical IDE for Gnuplot on Linux, featuring syntax highlighting, static and interactive plot previews, and external plotting with Gnuplot's Qt terminal.
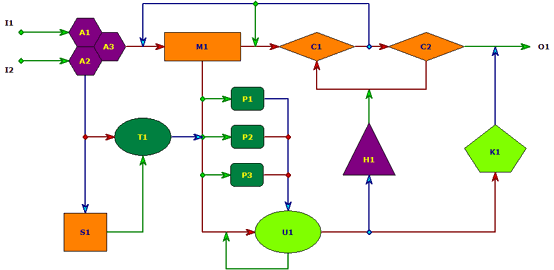
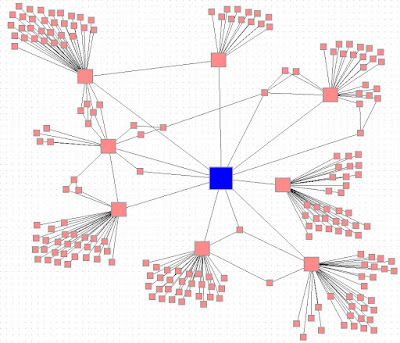
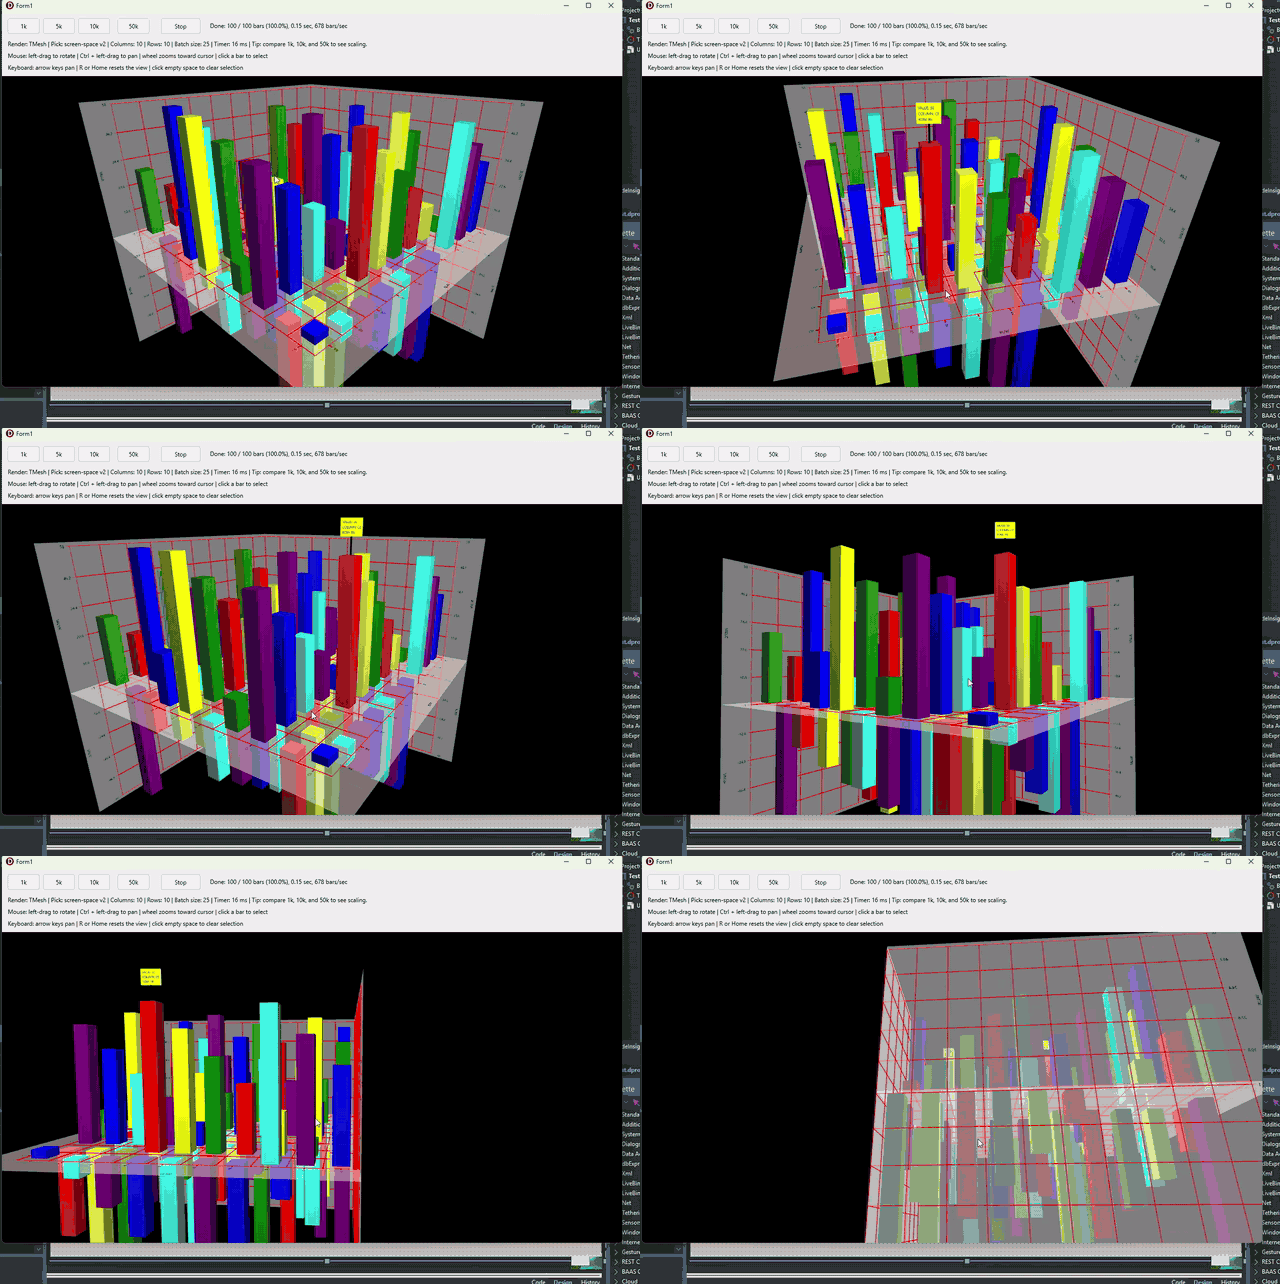
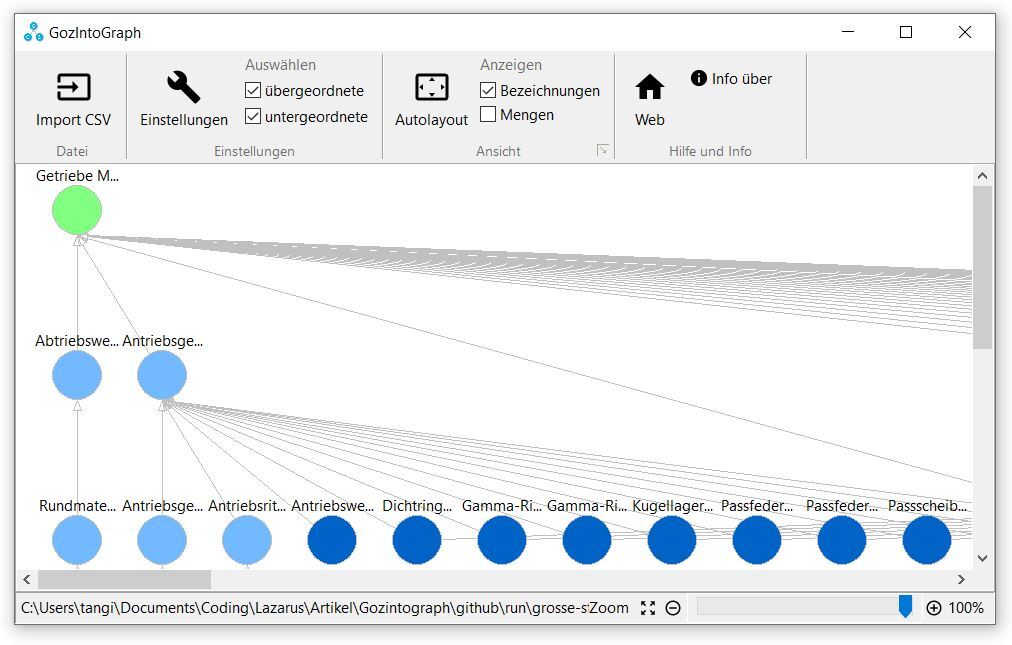
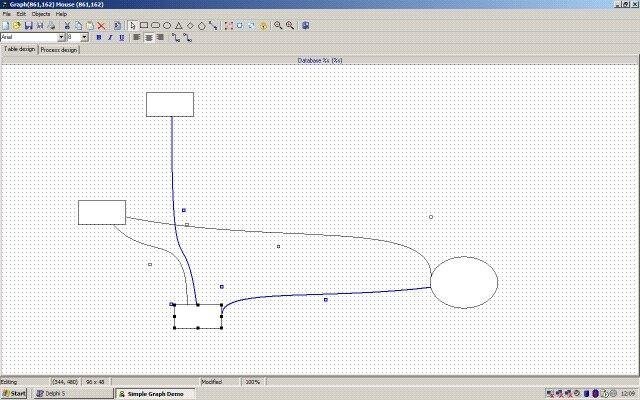
Delphi project extending TSimpleGraph (www.delphiarea.com) functionality. It creates a framework for data vizualization applications like industrial monitoring systems, workflow designer, just to name a few.