InteractiveLineChart

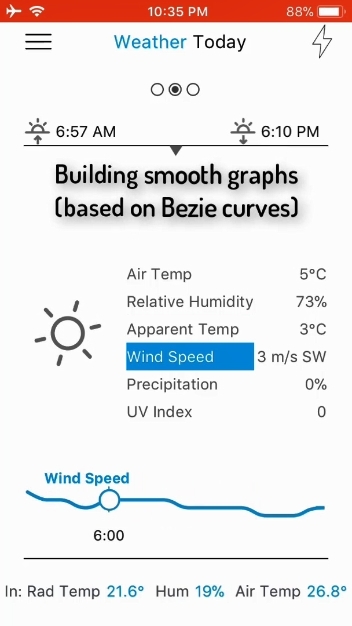
An interactive graph slider featuring a draggable point on a smooth Bezier curve, for adjusting values like temperature or tracking data
- Active · last change 11-24-2024
- ★ 1 on GitHub
README
InteractiveLineChart (2018)
An simple interactive graph slider featuring a draggable point on a smooth Bezier curve, for adjusting values like temperature or tracking data. Windows, Android, iOS, MacOS.
Please see how it works in this video from my Upwork portfolio, Senses Thermostat (from time 1:04) https://drive.google.com/file/d/1i3u-PailmFGQgPEA8OdCDcRIEDNbN5Xp/view?usp=drive_link