Catalog · How the catalog works
TeeChart-for-R

TeeChart charting graphing plotting library for the R Language
- ★ 3 on GitHub
Anyone may press Interesting, signed in or not. It helps others find this project.
README
TeeChart-for-R
Add Charts and Plots to your R projects
TeeChart for R is a free package that uses the TeeChart library.
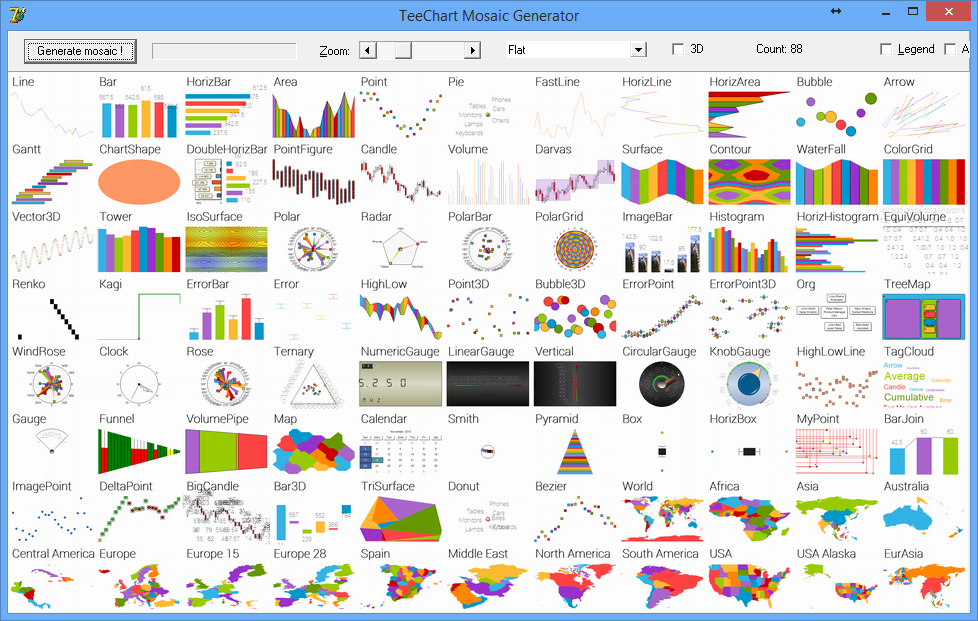
The standard version includes most common chart styles, in 2D or 3D:
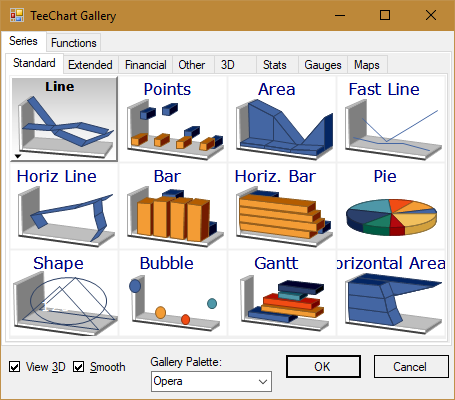
Tested with R 4.6.1 and RStudio in Windows and Ubuntu Linux.
Use R console, RGui or RStudio ide, set your default workspace or folder to this repository on your local machine, and run R:
> library("teechart")

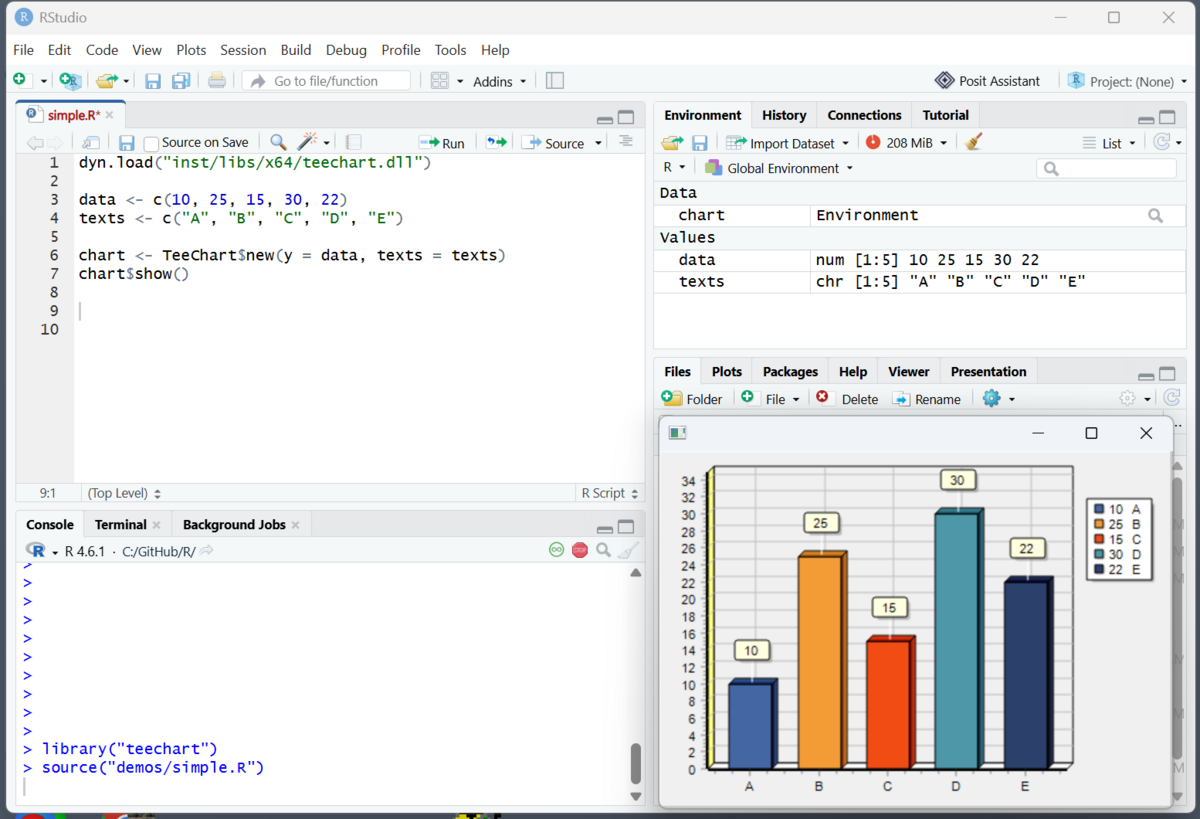
Run a simple example to show a chart:

> source("demos/simple.R")

data <- c(10, 25, 15, 30, 22)
texts <- c("A", "B", "C", "D", "E")

chart <- TeeChart$new(y = data, texts = texts)
chart$show()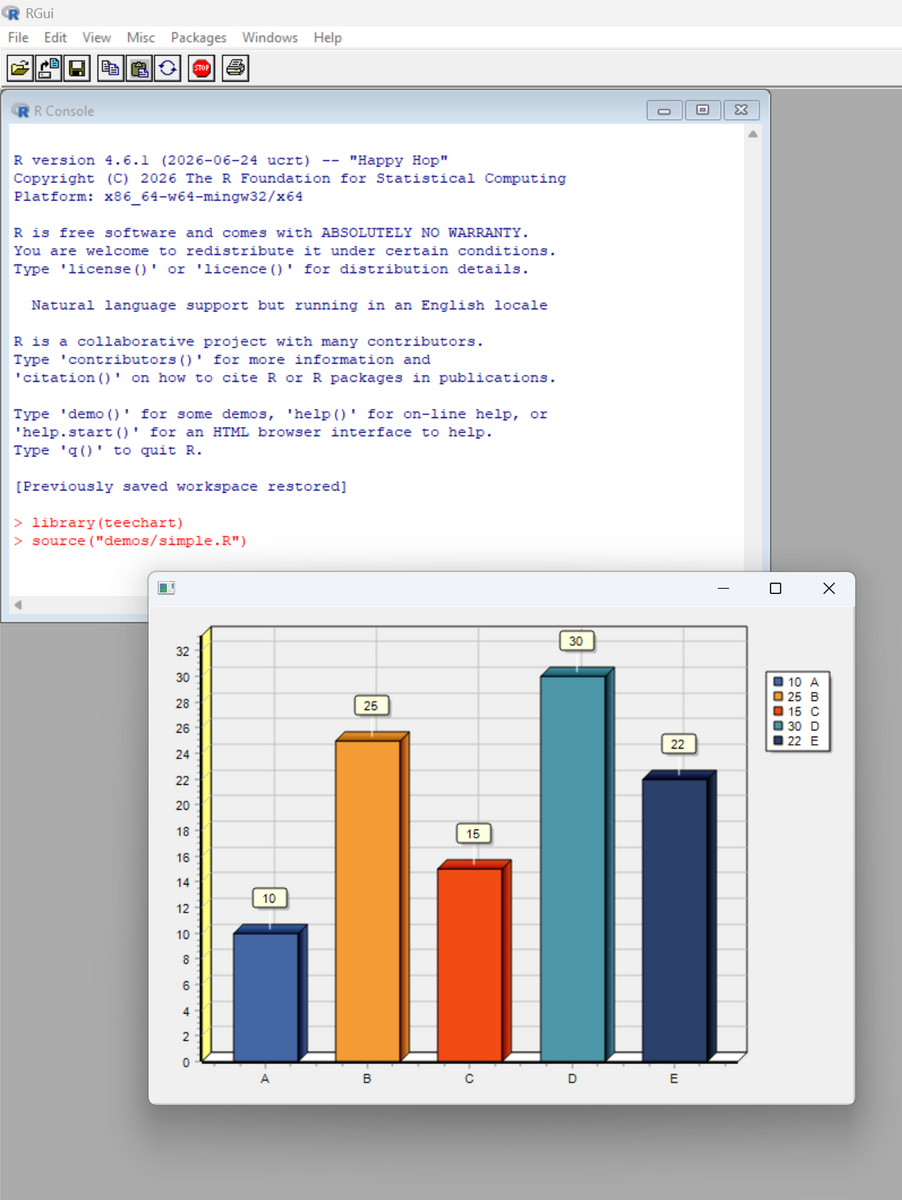
Infinite cosmetic configuration (fonts, colors, 2D or 3D etc)
data <- mtcars
data$names <- rownames(data)

chart <- TeeChart$new(data = data, x = data$hp, y = data$qsec, texts = data$names)
chart$set_title("Engine Performance")$show()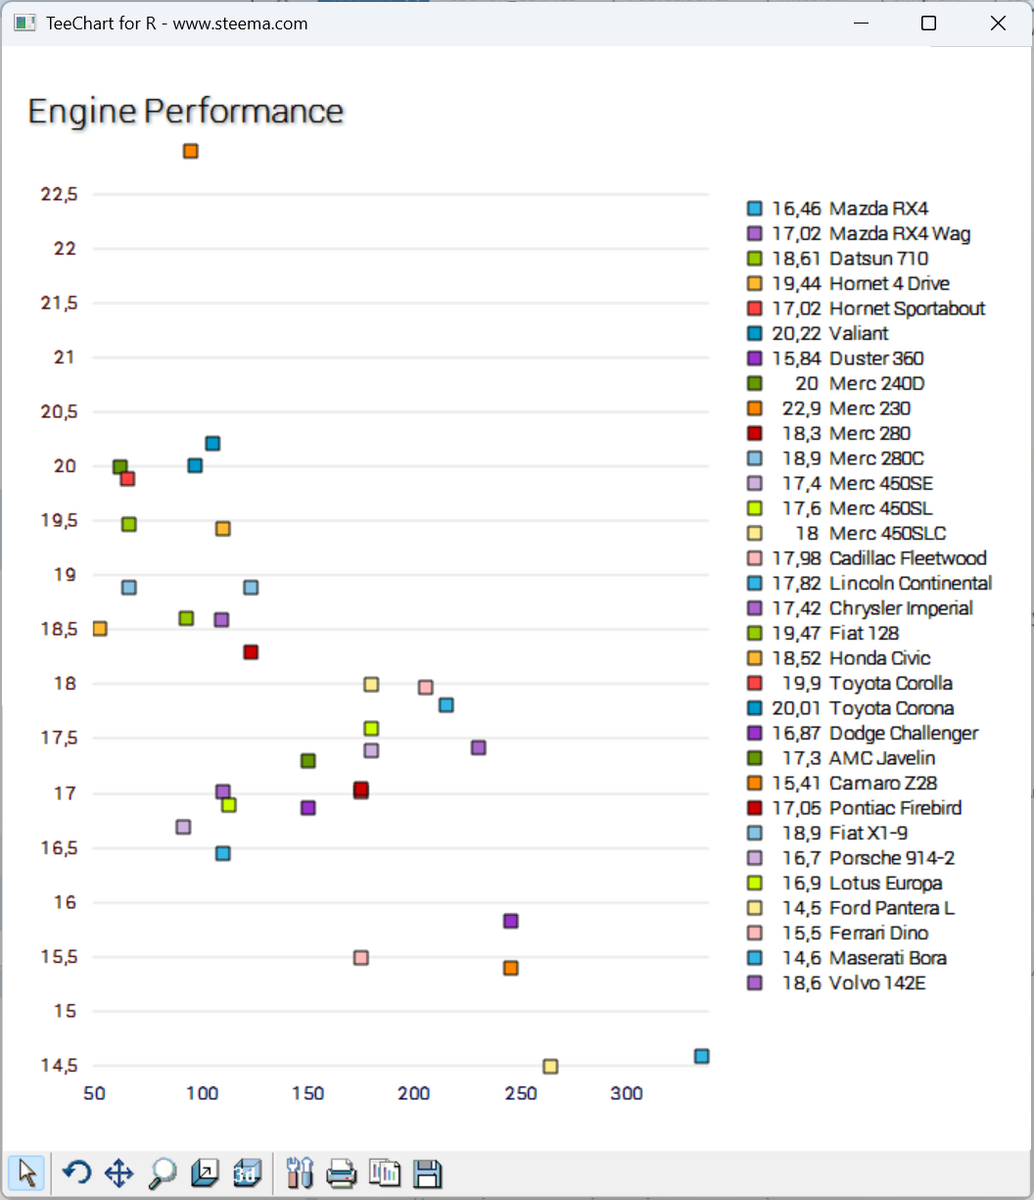
XYZ 3D with optional OpenGL GPU live charts
x <- seq(-3, 3, length.out = 30)
y <- seq(-3, 3, length.out = 30)

xyz <- expand.grid(x = x, y = y)
xyz$z <- sin(sqrt(xyz$x^2 + xyz$y^2))

chart <- TeeChart$new(x = x, y = y, z = xyz$z, commander = TRUE)
chart$set_title("XYZ 3D Surface")$show()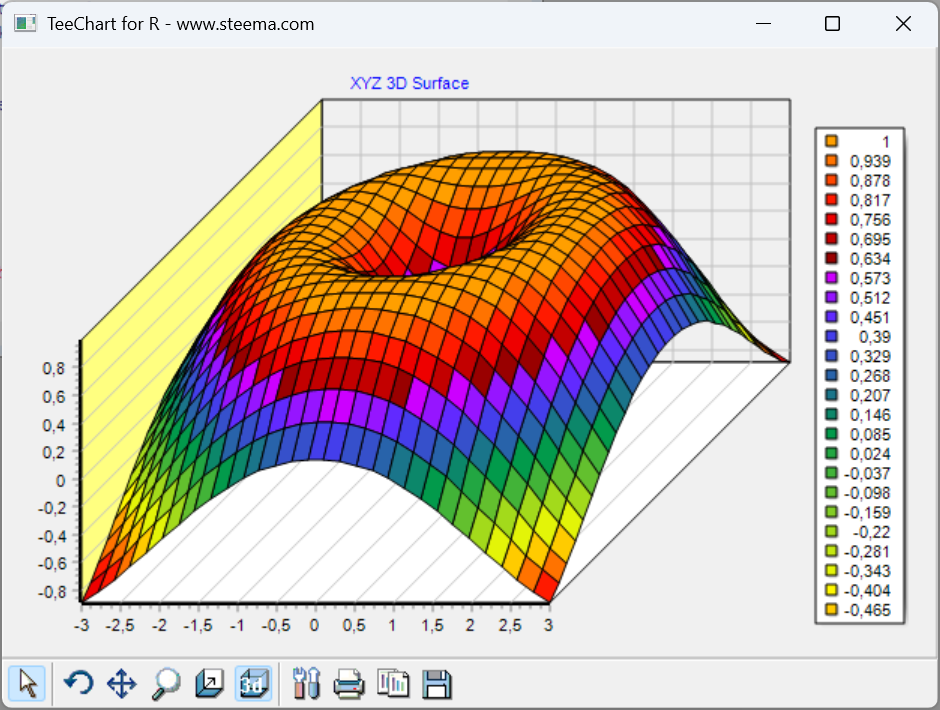
Fast OpenGL 3D rotation, zoom
https://github.com/user-attachments/assets/f14a2b28-9186-4447-91dc-730b351a0418
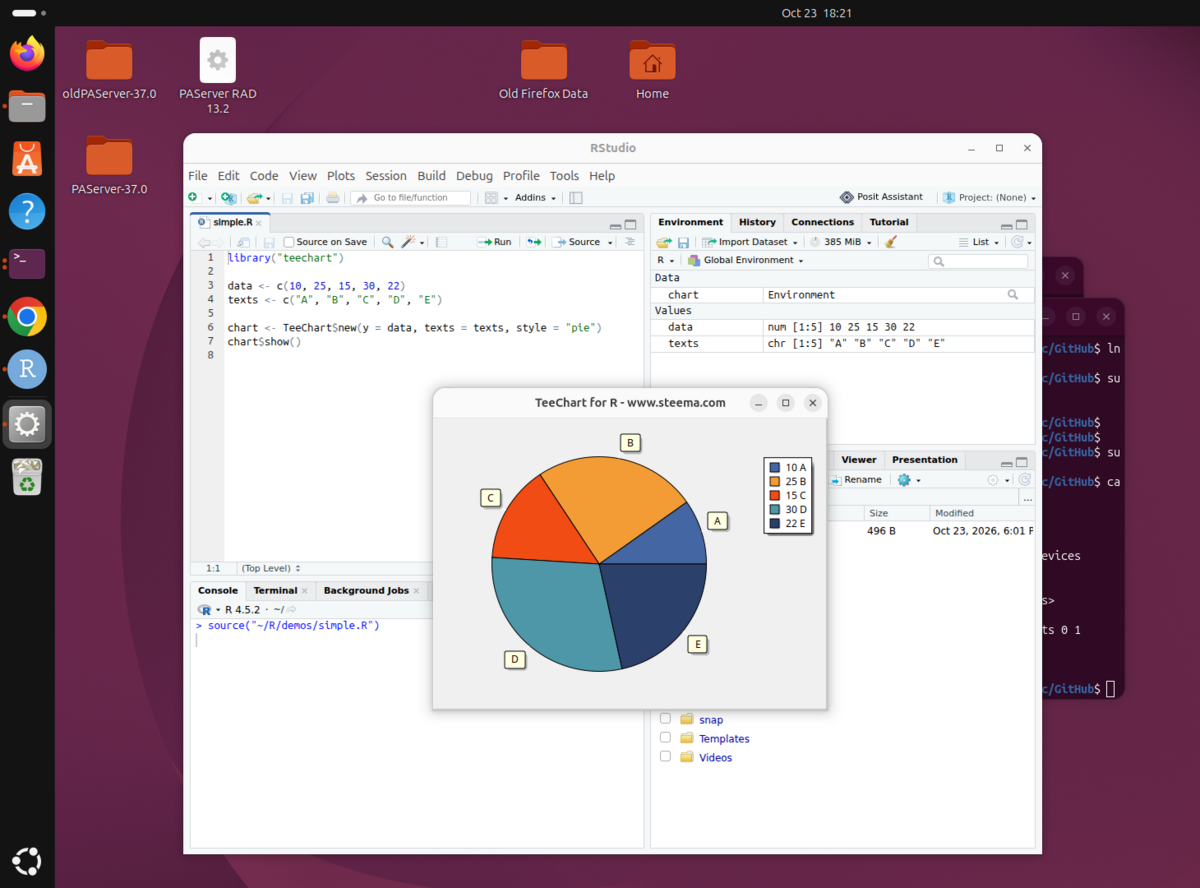
Same demos in R Studio ide:
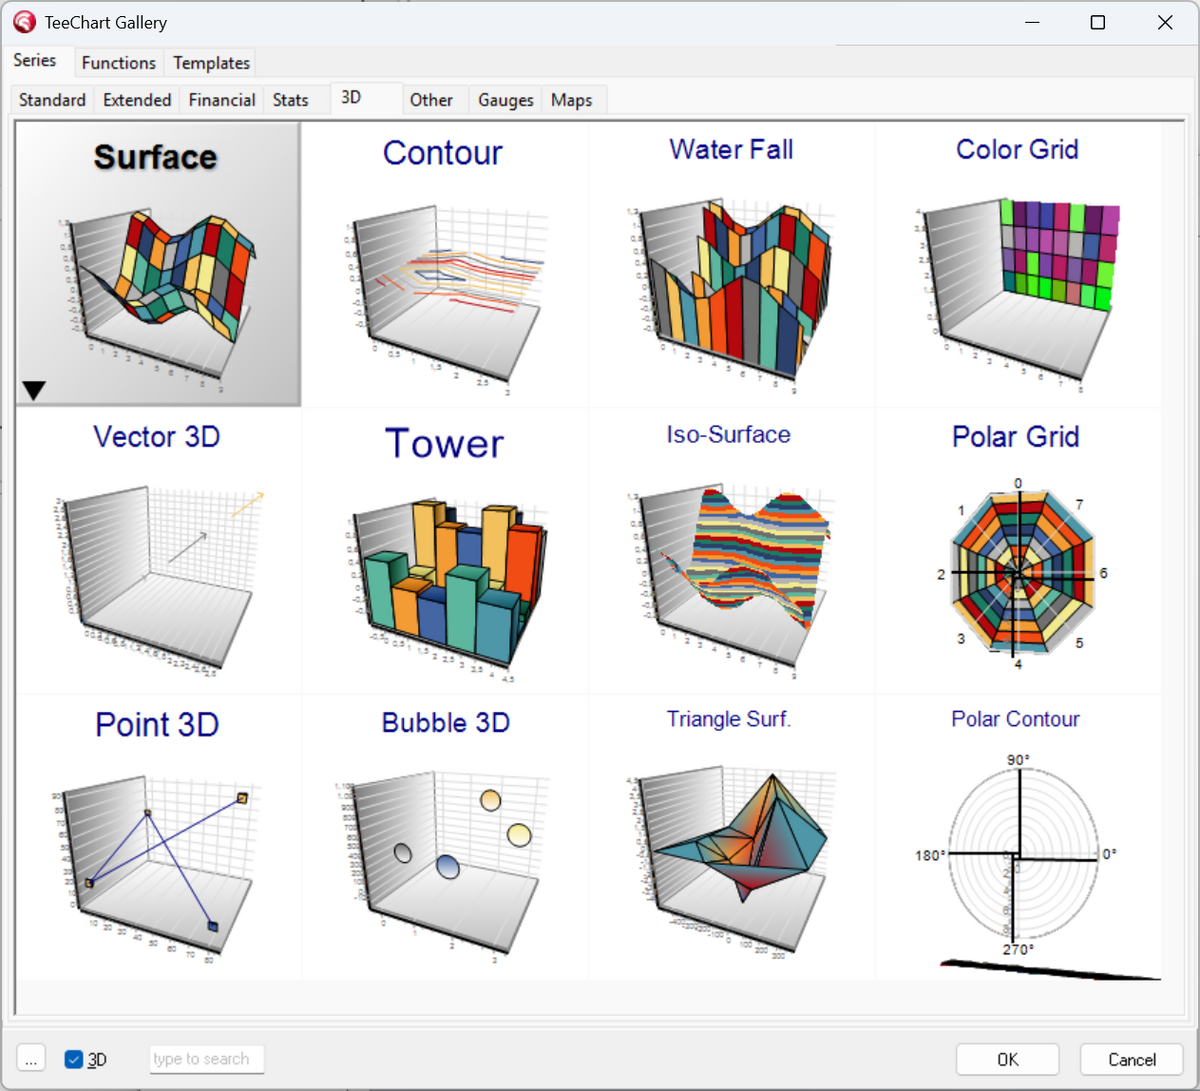
A pro version (not yet available) provides extended support with many more styles and functionality like 3D charts:
Same TeeChart for R package running in RStudio Ubuntu Linux: