

TeeChart-VCL-GitHub-Contributions

Demo of a GitHub Contributions Chart using TeeChart VCL
- Active · last change 6-27-2025
- ★ 9 on GitHub
README
GitHub Contributions Chart with TeeChart VCL
This project visualizes a GitHub user's contributions chart using TeeChart VCL. It retrieves contribution data via the public API provided by the sallar/github-contributions-chart project and renders it in a rich, interactive chart.
Features
- Fetches GitHub contributions data for any user
- Visualizes yearly contributions using TeeChart VCL
Screenshots
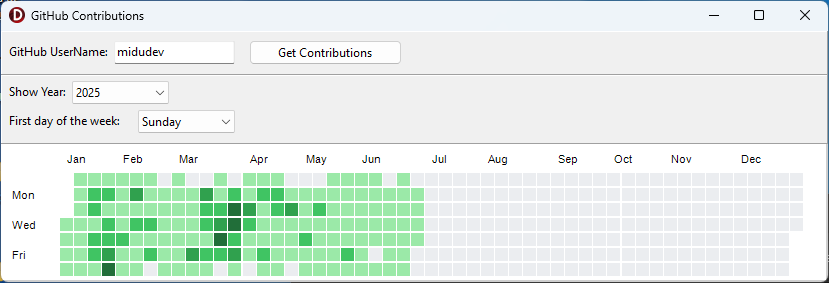
- Enter a GitHub username in the application.
- The app calls the API endpoint:
https://github-contributions.vercel.app/api/v1/{username} - The returned data is parsed and displayed as a contributions chart using TeeChart VCL.
Getting Started
- Clone this repository.
- Open the project in your preferred Delphi/C++Builder IDE.
- Make sure TeeChart VCL is installed.
- Build and run the application.
Credits
- Contributions data is provided by the sallar/github-contributions-chart project.
- API endpoint used:
https://github-contributions.vercel.app/api/v1/{username}
This project is not affiliated with or endorsed by GitHub or the sallar/github-contributions-chart project.