PieChart

TPieChart
- Active
- Library
- Delphi
- GitHub
- ★ 2


30,081 projects in the catalog.
Free Pascal, Lazarus and Delphi components, libraries and programs from GitHub, SourceForge, Codeberg, GitLab and more. Rate them, mark what looks interesting, and talk about them on their benches.
TPieChart
A Serial Plotter developed in Lazarus
Evaluate algebraic expression (can define variables x, y and z) and plot functions, parametric and polar equations. Written in Turbo Delphi, based on TExpressionParser.
Indicador de momentum de dupla validação para ProfitChart. Utiliza um sistema de RSI duplo (rápido + lento) em confluência com ADX e DI System para filtrar sinais falsos e confirmar a força e a direção do movimento com maior precisão
Spektrum Telemetry Log File Viewer
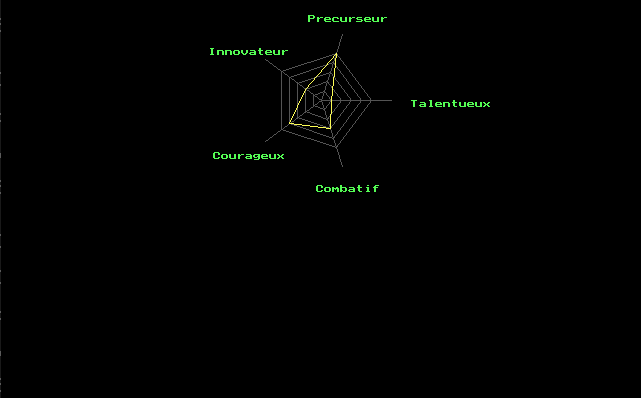
Cette commande, écrit en Pascal (Turbo Pascal ou Free Pascal), permet d'afficher un graphique en toile d'araignée à partir de données.
Delphi FMX desktop dashboard for Google Analytics 4 website analytics
每两分钟为间隔,通过串口轮流抄收传感器数据,并按照每个传感器形成时间轴和数字的坐标。显示时间轴最大7天 串口波特率:9600,N,8,1 串口返回超时时间2秒
many grahp with many propertu
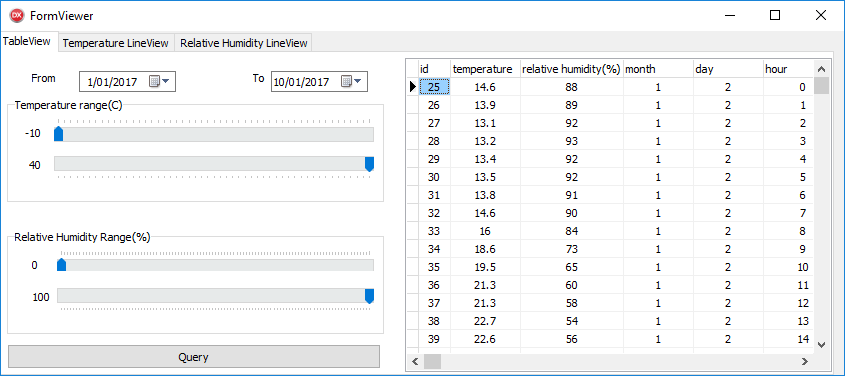
Using Line Chart Display Temperature and Humidity Data
A digitizer software
Turbo Pascal program used to plot functions
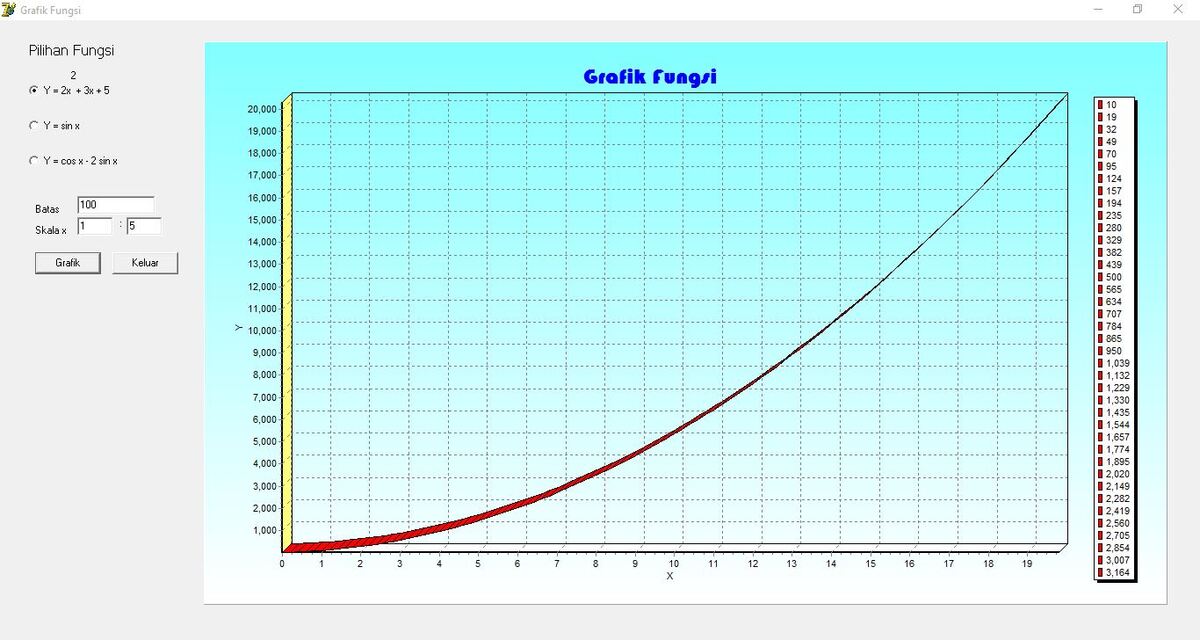
Grafik fungsi dengan delphi
Chart utility based on Delphi TeeChart
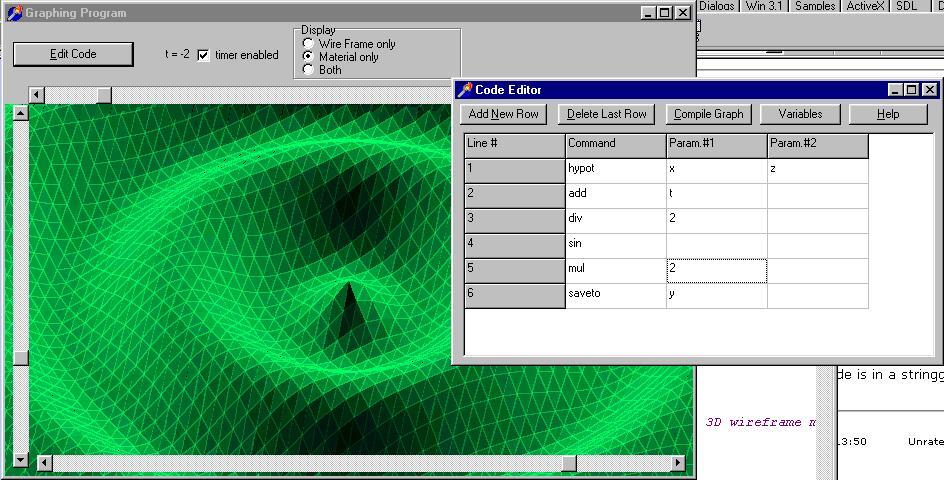
An open source math function graphing program that visualizes with animated 3D graphs where time represents one of the dimensions of the graphed data
(Delphi forms)
source code for GWChart
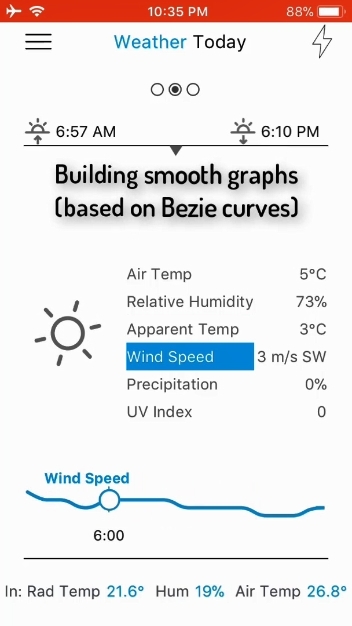
An interactive graph slider featuring a draggable point on a smooth Bezier curve, for adjusting values like temperature or tracking data
The program build a graphic for the number entered by user
This graph builder draws a graph base on incidence matrix
Delphi Process Simulator — a small Delphi VCL application that simulates a two‑tank process with temperature, pressure, level, motor control, alarms, and basic statistics. The project includes a main form with a process view and trend chart, alarm management, setpoint control, maintenance data, and a statistics manager to collect runtime metrics.
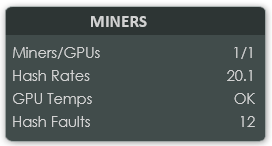
Mining Visualizer
The Periodic Table is a chart that organizes all known Chemical Elements by increasing Atomic Number (number of protons), with Elements arranged in rows (periods) and columns (groups) that reveal trends in their Chemical and Physical Properties.
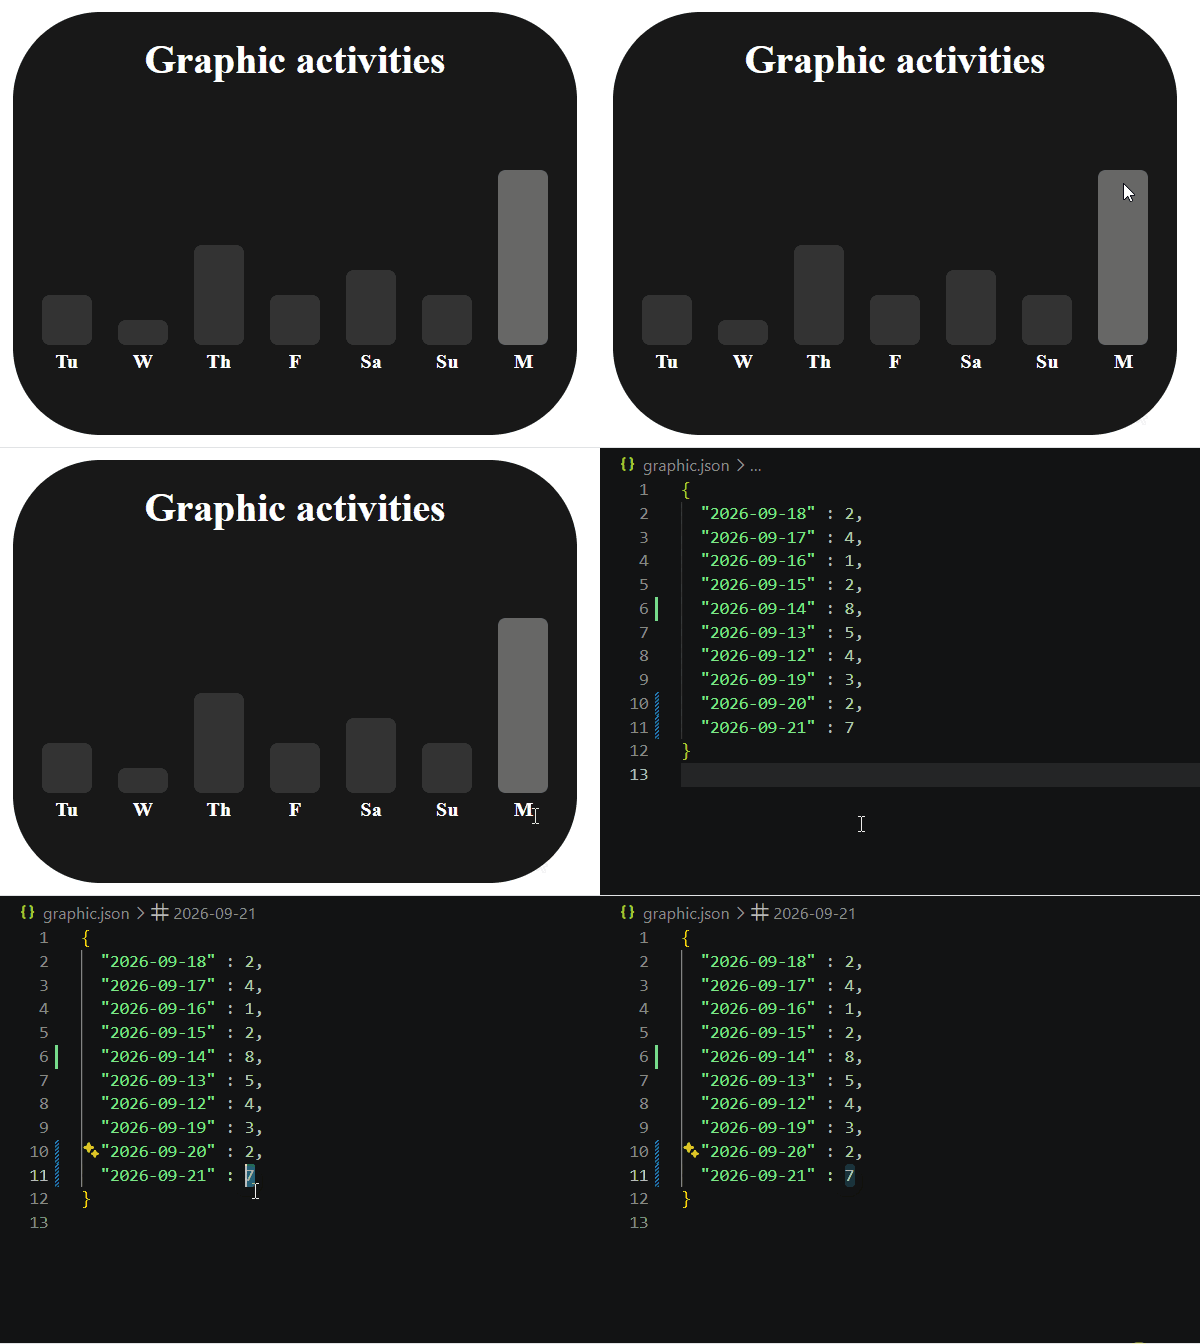
Focus Tracker with Pomodoro Timer, To Do list and tracking activities on a chart
Multilayer Pascal library (2001 year)
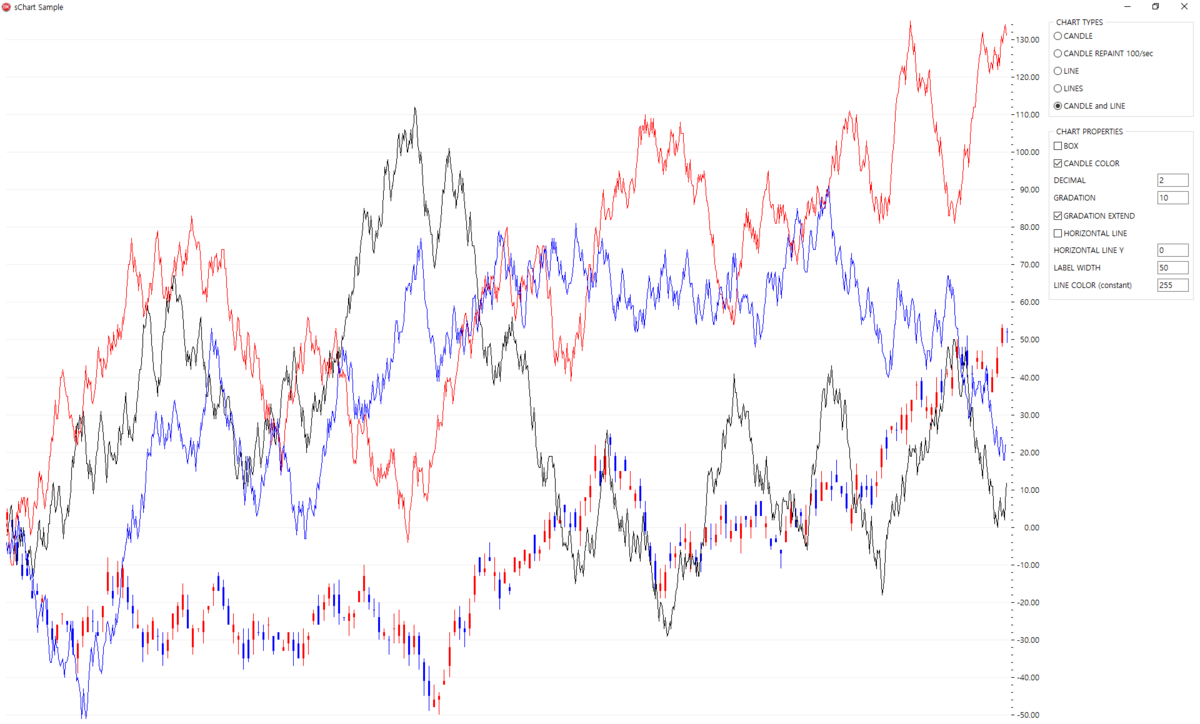
a chart unit and a sample for delphi
A graphical IDE for Gnuplot on Linux, featuring syntax highlighting, static and interactive plot previews, and external plotting with Gnuplot's Qt terminal.
Charts and Graphs Edit and Memos
This code is write by C++ language and use Borland C++ Builder too present Sin and Cos
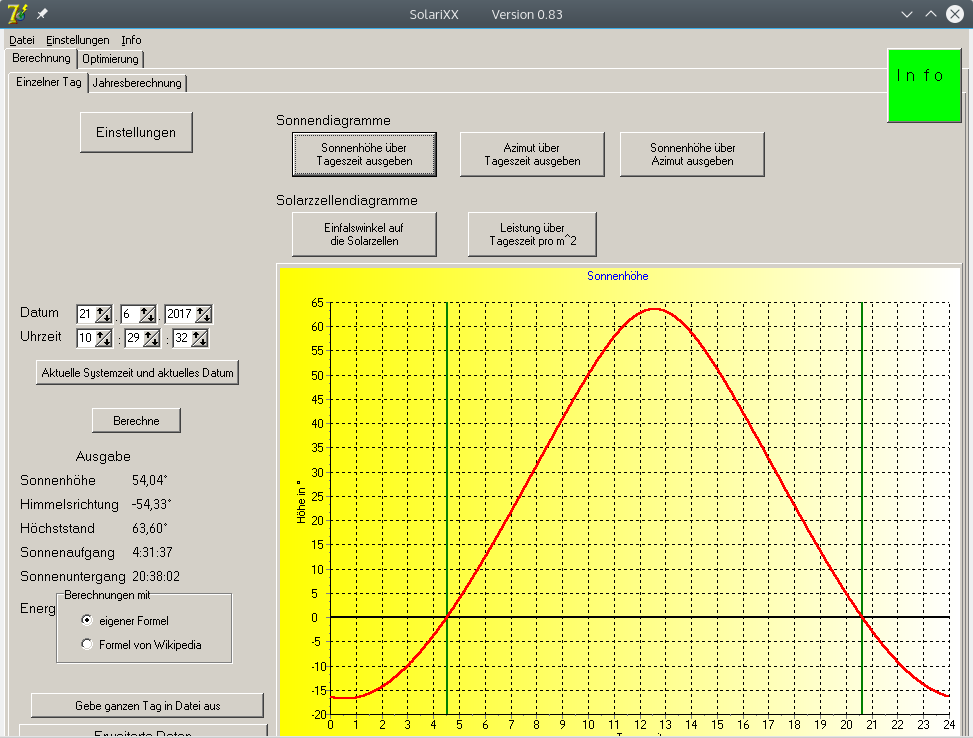
It shows the light intensity you can expect from a solar collector with any angle.
SOLVER toolset (W.S.C. Gurney) ported to Free Pascal - ODE/DDE solver with CSV/TSV export and plotting
ФИТР, БНТУ, ТОЭ Программа построения графиков основного колебания, одной гармоники, а так же результирующего колебания. Программа использовалась для выполнения практической работы по дисциплине "Теоретические основы электротехники."
A library used to calculate the sky distribution from integral solar radiation values
Events timing visualization tool for LTE, etc.
Delphi Example Using TMS FNC Dashboard Components to accompany blog post
Delphi US Chart Map Sample
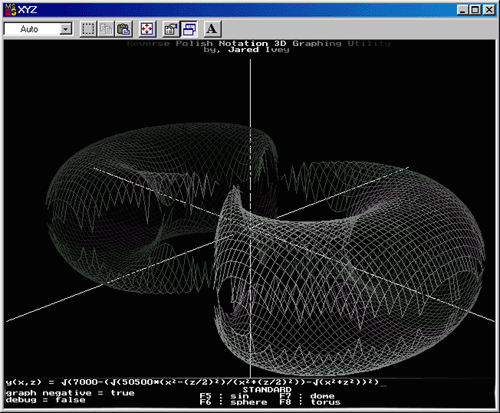
Archived legacy 3D graphing utility, originally written in 1998 using Turbo Pascal.