

IDE Window: Call Stack
Deutsch · English · Français · Русский
Navigation
Main Menu > View > Debug Windows > Call Stack
Important
You must setup the debugger and start the project to debug it. Only then this window will be useful.
The output shown on this page is based on the GNU debugger (GDB) which is currently the only debugger Lazarus supports. Its output looks at times like C, not Pascal. Other debuggers may show a more Pascal-like style.
Dialog
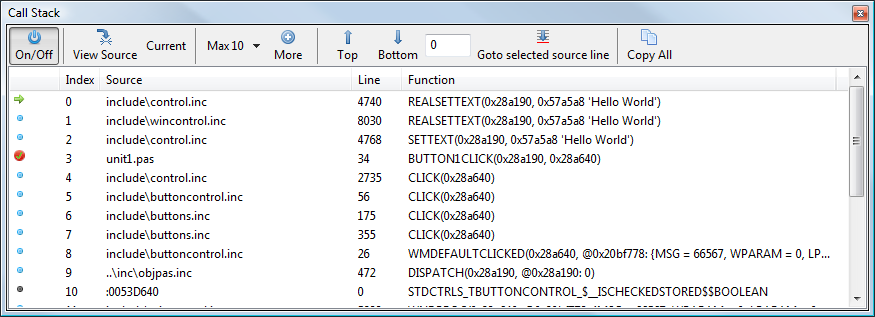
What is the call stack?
The call stack is the stack of function calls. The top line is the current function, the lowest line is the main program.
Source column
This column lists the filename of the source file. This information is retrieved from the debug information contained in the executable (or from an external GDB symbol file if you have selected that option). Only those parts of the program explicitly compiled with debug information contain this information.
Line column
If the position contains debug information, the source line number will be shown, otherwise only the address pointer in the executable is shown. This line is where the next function was called.
Note: The line numbering is the numbering at the time the project was last compiled with debug information. If you have subsequently inserted or deleted lines, the numbering will appear to be incorrect.
Function column
The mangled name of the procedure or function. The compiler converts Pascal identifiers into names which the gnu tools (designed for C code) can use. For example:
TAPPLICATION__CREATEFORM(0x81fb738, void, (^TAPPLICATION) 0xb7cd0014)This means:
- The mangled function name is TAPPLICATION__CREATEFORM, which is the TApplication.CreateForm procedure of the LCL unit forms.pp. Because Pascal is case insensitive and the gnu tools are case sensitive, FPC converts the name to uppercase. Because the gnu tools don't know about classes and objects, the class.method is converted to a global function name.
- The parameter list depends on the platform and the calling convention. That means the parameter list may be reversed, starting with the rightmost parameter. This is the case in the above example.
- The 'Self' parameter is implicit, meaning that you don't write it in the Pascal source, because FPC creates it automatically. This is always the first parameter emitted by the compiler (though invisible in the Pascal source code). Because of the reversed parameter order, Self is shown here as the last parameter. It is of type ^TAPPLICATION and its hexadecimal value is 0xb7cd0014.
- The next parameter in Pascal is 'var Reference', which has no type. Therefore it is 'void'.
- The last parameter in Pascal is 'InstanceClass: TComponentClass'. Gnu sees this parameter simply as a pointer with the hexadecimal value 0x81fb738.
Tricks
Double click on an item to jump to the source.
Toolbar
On/Off
Enable/Disable updates. Freezes the current content.
View Source
Jump to selected location in source editor.
Current
Set the selected frame as source for locals, watches, ...
Max ##
Set the amount of frames shown in the list
More
Increases the amount of frames shown in the list
Top
Set the first shown index to 0
Bottom
Set the first shown index, so that the bottom of the stack is visible.
E.g. if you show "Max 10" lines, and your app has 55 frames (from the main entry point to the current location), then the window will show frames from index 45 to 54 (54 is the 55th frame - zero based)
Edit & Goto selected source line
Show the entered index as first frame in the list.
(source line => index)
Copy all
copy to clipboard
Popup menu

Show
Jump to the current item's source code position.
Set as current
Set the selected entry as the current stack frame. Local variables only exist within their own local stack frame. By setting the current frame, you can watch the values of variables in the (local) context of the procedure you have selected.
Copy all
Copy the call stack to the clipboard.
From the Free Pascal wiki, page "IDE Window: Call Stack", as it stood on 2022-09-10 after a change by Martin, out of the wiki's dump of 2024-05-26. Copyright stays with the author who wrote it, according to the old wiki's Licensing page. If you have concerns about this material, message the admin.
Talk about this page
Nobody has opened a bench for this page yet. Sign in to open one.