Mathe LATTE
Extensible very easy to use 2D/3D function plotter for KDE 3.2 with plugin support.
- Application
- SourceForge
- GNU General Public License version 2.0 (GPLv2)


30,084 projects in the catalog.
Free Pascal, Lazarus and Delphi components, libraries and programs from GitHub, SourceForge, Codeberg, GitLab and more. Rate them, mark what looks interesting, and talk about them on their benches.
Extensible very easy to use 2D/3D function plotter for KDE 3.2 with plugin support.
Light-weight chart component with basic functionality (bar series, line series, smooth spline series)
Charts and Graphs In the Online Package Manager
PlotPanel is a component for Lazarus to replace (more or less) the TChart component. With some modification it can also be used with Kylix, Delphi 5, 6 or 7.
Component to paint function y=f(x) plots.
Charts and Graphs In the Online Package Manager
TRingChart component is an elliptic Sectors Chart that we can consider a twin of the LCL TChart Component in the sense that has the same structure, particularly for the data input structure, but the rest is original.
Components RingChart, AnalogWatch. RingChart is elliptic Sectors Chart, which data struct is like TChart, but the rest is original.
Charts and Graphs In the Online Package Manager Orphaned in the Online Package Manager
. Delphi Free for non-commercial use with source charting Suite for adding charts and graphs to your programs. For Delphi 2010-Tokyo Win32/Win64/macOS/iOS/Android and Appmethod Object Pascal.
Проект визуализации технических параметров
An efficient 2D Simple Graphing program for windows, perfect for plotting collected data incorporating features of cricket graph which allow you to apply a function to all your data. Regression Lines for data.
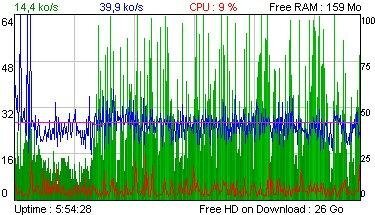
An easy way to monitor a SNMP device or the local computer, withtout the need of installing any 3rd party package. Fully customizable, you can choose what and how it is displayed. Perfect for download or upload monitoring.
TAChart is the principal component of a TeeChart-like charting framework for Lazarus offered under an LGPL licence. TeeChart is the charting component installed with recent Delphi versions.
TAChart is Lazarus' powerful charting library. It consists of numerous classes and declarations distributed over some 50 units. New users may be overwhelmed by the complexity of usage, and even experienced charters still find gems from time to time.
The work with the Reference Guide has just started and not yet useful.
This article answers frequently asked questions related to usage of TAChart at runtime.
This tutorial shows how to create a chart with multiple series in their own panes and with their own left axes and one common bottom axis. It was created while checking out the nice "Panes demo" which you can find in the folder components/tachart/demo/panes of your Lazarus installation. Since a second topic is included in this sample project it may be a bit difficult to catch the basic idea. So here we explain how you can do this from scratch.
TCustomPlot is a custom plotting component. It allows you to plot a series of points connected with line.
TFunctionPlot is a special function plotting control based on TCustomPlot.
TSurfacePlot3D is a 3D plotting control like 2D-plotting TFunctionPlot