

Plot2DComponent

- Active · last change 10-5-2026
- ★ 1 on GitHub
README
TSkPlotPaintBox — a Skia-backed 2D plotting component for Delphi FireMonkey
A 2D charting control for RAD Studio FireMonkey (FMX), rendered with the
Skia backend. TSkPlotPaintBox is a TSkPaintBox descendant that draws
line/marker charts with full styling, a draggable legend, log axes, data-anchored
annotations, interactive zoom/pan, point picking, JSON persistence and
PNG/PDF/CSV export.
It ships as a run-time package, a design-time package (component palette registration) and a demo application.
This code was developed using a combination of Human effort and AI assistance.
Contents
- Installing
- Building
- Quick start
- Units
- Interaction: zoom, pan and picking
- Annotations (labelling individual points)
- Series
- Styling
- Persistence and the settings store
- Import / export
- Precision notes
Screenshots
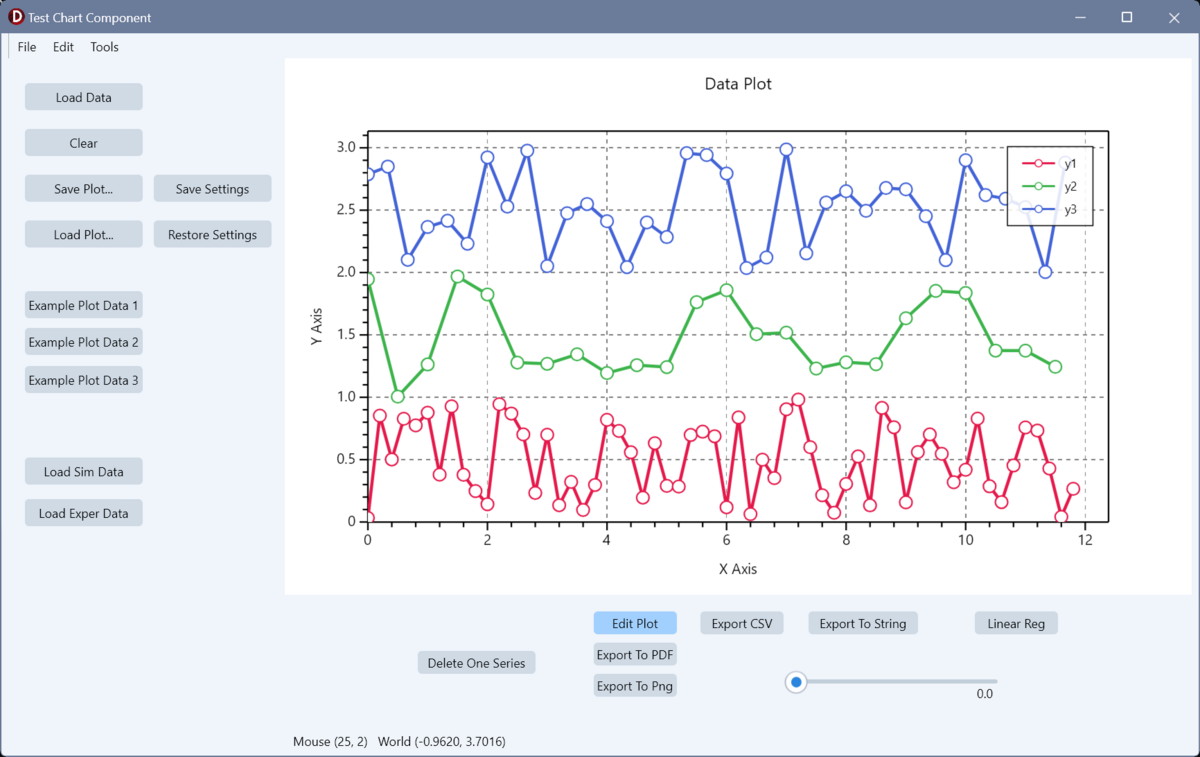
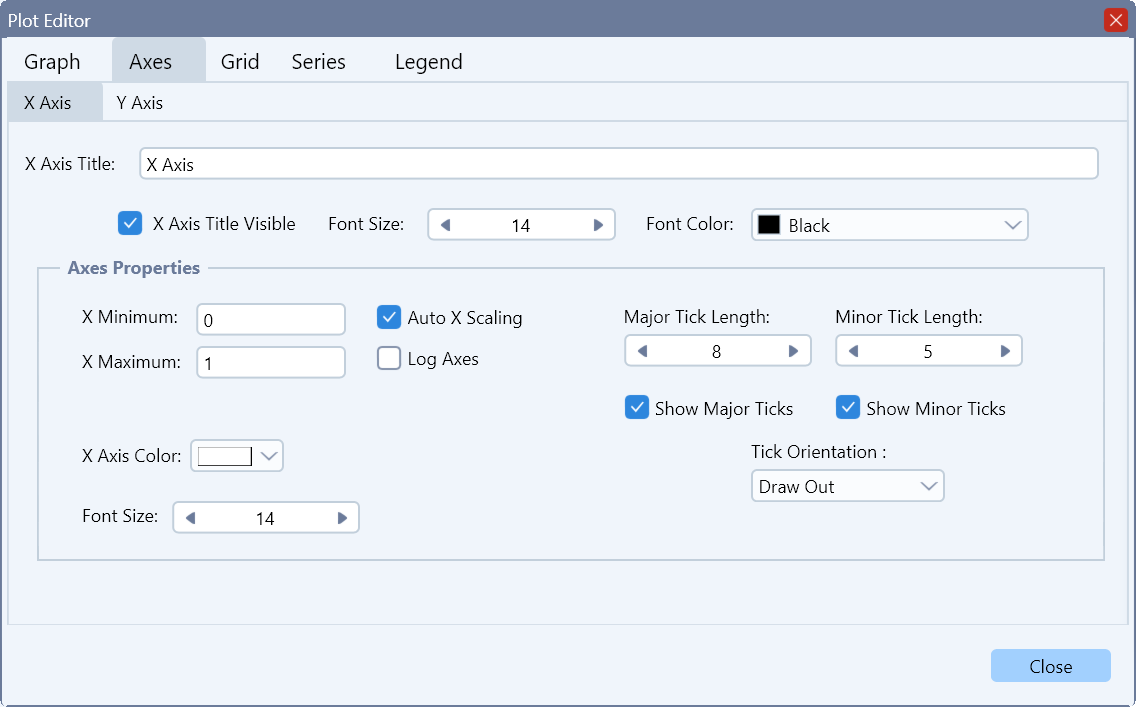
Installing
- Install the Skia4Delphi packages (
Skia.Package.RTL,Skia.Package.FMX) and enable Skia in your project. - Build and install
Package/PlotDesignTimePackage.dprojin the IDE — it registersTSkPlotPaintBoxon theComponentLibrarypalette page. The run-time package must be built first (the group project encodes that order). - The run-time property editor form (
ufPlotEditor) additionally requires the externalLabelTrackBarRuntimepackage, which suppliesTLabelledTrackBar. (Source/uLabelledTrackBar.pasis that control's source, kept in-tree for reference.)
Any host application must set GlobalUseSkia := True before
Application.Initialize — see Demo/TestPlotProject.dpr.
Building
Projects:
| Project | Purpose |
|---|---|
Package/PlotProjectGroup.groupproj |
Everything, in dependency order |
Package/PlotRuntimePackage.dproj |
{$RUNONLY} — all the code |
Package/PlotDesignTimePackage.dproj |
{$DESIGNONLY} — palette registration |
Demo/TestPlotProject.dproj |
Demo app (Win64) |
Command line (RAD Studio 13 / BDS 37.0):
call "C:\Program Files (x86)\Embarcadero\Studio\37.0\bin\rsvars.bat"
msbuild Package\PlotProjectGroup.groupproj /t:Build /p:Config=Debug /p:Platform=Win64
Adding a new source unit requires two edits: list it in
Package/PlotRuntimePackage.dpk(contains) and inPlotRuntimePackage.dproj(<DCCReference>). msbuild reads the.dproj, the IDE reads the.dpk.
Quick start
uses SkPlotPaintBox, uPlotSeries;

// From a CSV file — one series per column after the first (X) column.
Plot.LoadData('linear.csv', True, True, False, False).Free;

// Built by hand.
var ps := TPlotSeries.Create('Fitted', claBlue, False);   // False = no markers
ps.AddXY(x1, y1);
ps.AddXY(x2, y2);
Plot.AddSeries(ps);
Plot.Redraw;
LoadData(FileName, LineVisible, MarkerVisible, ClearSeries, ClearDataKinds)
returns a TStringList whose objects are the created series (free the list, not
the objects). ClearDataKinds removes existing skData series first, so
reloading measured data doesn't disturb simulation curves.
Units
| Unit | Contents |
|---|---|
SkPlotPaintBox.pas |
TSkPlotPaintBox and its styling sub-objects (TAxisLimits, TAxisStyle, TGridStyle, TLegendStyle, TTextProperty), rendering, interaction, export |
uPlotSeries.pas |
TPlotSeries / TPlotSeriesList — one X/Y curve, its styling, and how it draws itself |
uPlotAnnotation.pas |
TPlotAnnotation / TPlotAnnotationList — data-anchored, pixel-offset text labels |
uPlotMapper.pas |
TPlotMapper — the data↔pixel transform, plus TPointD / TRectD |
uPlotDefaults.pas |
Global PlotDefaults record + JSON loader for default series styling |
uColorManager.pas |
TColorManager.NextColor — cycles a fixed palette |
uCSVReaderForPlotter.pas |
CSV parser used by LoadData (error bars, NA markers) |
uPlotJsonUtils.pas |
Small JSON get/put helpers shared by all persistence code |
uMathParser.pas |
Expression parser for function-defined series |
ufPlotEditor.pas/.fmx |
TFrmPlotEditor — run-time tabbed property editor |
Interaction: zoom, pan and picking
These were added for use as a bifurcation-diagram viewer, where you need to scroll into a fold and read off exact parameter values. They are off by default so ordinary plots behave as before.
ZoomPanEnabled (default False)
Set it to True to activate:
| Gesture | Effect |
|---|---|
| Mouse wheel | Zoom in/out about the cursor (factor 1.2 per notch) |
| Left-drag | Pan — the data grabbed at press stays under the cursor |
| Shift + left-drag | Rubber-band box zoom (trackpad friendly); a box under 5 px is ignored |
| Ctrl + double-click | ResetZoom — back to autoscale |
A plain double-click opens the run-time property editor instead, and does so
whether or not ZoomPanEnabled is set — see below.
ResetZoom can also be called directly, and is safe when no zoom is active.
Setting ZoomPanEnabled := False also clears any active view window.
How it works. Zoom and pan write an explicit view window (in data
coordinates) that RenderChart uses verbatim — bypassing autoscale, manual
AxisLimits and the usual 5 % padding, so deep zoom keeps its precision. All
the math is done in pixel space and unmapped through the mapper, which means
log axes come out right for free. Pan and box zoom each snapshot the mapper at
press time, so a drag is exact and drift-free.
Double-click: the run-time property editor
A plain (unmodified) double-click on the chart opens TFrmPlotEditor
(ufPlotEditor), the tabbed dialog for editing chart, axis, series and legend
properties while the app is running. The form is created on first use and shown
non-modally, then the chart is redrawn.
This is independent of ZoomPanEnabled — it works on any plot. Hold Ctrl
while double-clicking to reset the zoom instead (that half does require
ZoomPanEnabled).
Behaviour change. A plain double-click used to call
ResetZoom. That has moved to Ctrl+double-click, freeing the unmodified double-click for the property editor. Code callingResetZoomdirectly is unaffected; only the gesture changed.
OnPointPicked and PickTolerance
property OnPointPicked: TOnPointPicked;   // (Sender; Series; Index; DataX, DataY: Double)
property PickTolerance: Single;           // pixel radius, default 8
Fires on a left-click that lands within PickTolerance pixels of a stored
data point, and hands back that point's exact double value — e.g. a fold's
B = 24.384900179508524 — rather than the cursor's world position, which is
what the older OnReportCoordinates reports. FindNearestPoint does the search
in pixel space over visible series and skips NaN pen-lift separators.
Picking and panning coexist: with ZoomPanEnabled on, a left press is only a
pan candidate until it moves more than 3 px. A press that stays under that
threshold is treated as a click and fires OnPointPicked on mouse-up.
OnReportCoordinates
Still available: fires on mouse move with the cursor position in both screen and world coordinates. Suppressed while panning or dragging the legend.
Clicking the legend to show/hide a series
With LegendStyle.ClickToToggle (default True), clicking a legend entry flips
that series' Visible flag — the standard way to declutter a busy chart.
For this to work in both directions, a hidden series keeps its legend row
rather than disappearing from the box; the row is drawn at
LegendStyle.DimmedOpacity (default 0.35) so it reads as "off" while staying
clickable.
ShowInLegend vs Visible
ShowInLegend := False still removes a series from the legend outright — no
row, no dimmed placeholder, nothing to click. It is the outer test, so it wins
regardless of Visible or ClickToToggle:
ShowInLegend |
Visible |
Result |
|---|---|---|
True |
True |
Listed normally, drawn on the chart |
True |
False |
Listed dimmed — clickable to switch back on — not drawn |
False |
True |
Not listed at all, drawn on the chart |
False |
False |
Not listed at all, not drawn |
Behaviour change. Before click-to-toggle,
Visible := Falseon its own also dropped the series from the legend. That is now row 2 — the dimmed row is the whole point of the feature. Code that relied on the old side effect should setShowInLegend := Falseinstead, or turnClickToToggleoff for that plot.
Toggling does not rescale the axes: autoscale bounds are computed over all series, visible or not, so the curves that remain stay exactly where they were.
Clicking and dragging coexist the same way picking and panning do — a press on
the legend is a drag candidate until it moves more than 3 px; under that it is
a click and toggles the entry on mouse-up. Set ClickToToggle := False to get
the old behaviour back (legend lists visible series only, clicks do nothing).
Other mouse behaviour
- The legend is draggable;
ResetLegendPositionputs it back on its anchor. - Right-click opens a context menu: copy image to clipboard, export PDF, export PNG.
Annotations (labelling individual points)
TPlotAnnotation is a text label anchored in data coordinates but offset in
screen pixels, so it stays glued to its point through resize and rescale with a
constant visual gap. This is the LP1 / H1 / BP2 convention used by AUTO,
XPPAUT, MatCont and PyDSTool.
var a := Plot.AddAnnotation('LP1', bx, by);   // returns the annotation for tuning
a.OffsetX           := 8;
a.OffsetY           := -10;
a.Align             := aaBottomLeft;
a.BackgroundVisible := True;      // for legibility over a curve
a.LeaderVisible     := True;      // thin line back to the anchor point
Plot.Redraw;

Plot.ClearAnnotations;- Collection:
Plot.Annotations(TPlotAnnotationList) — owns and frees them. - Properties:
Text,Anchor,OffsetX/Y, 9-wayAlign(aaTopLeft…aaBottomRight),FontSize,FontColor, optional background (BackgroundVisible/Color,Padding), optional border (BorderVisible/Color/Width), optional leader line (LeaderVisible/Color/Width), andVisible. - An annotation is not a series: it never contributes to autoscale and never appears in the legend. Drawn on top of the series, under the legend.
- Full JSON persistence, saved with the rest of the plot.
Series
TPlotSeries holds Data: TList<TPointD> — double precision — plus line and
marker styling, and knows how to draw itself given a TPlotMapper.
ps := TPlotSeries.Create('branch', claRed, True);
ps.AddXY(x, y);
ps.AddXY(x, y, SourceRowIndex);          // tagged overload
idx := ps.SourceTag(PointIndex);         // -1 if that point wasn't tagged
Behaviours worth knowing:
- NaN is a pen lift. A point with a NaN coordinate breaks the polyline
(matplotlib/gnuplot convention), so one series can hold several disconnected
runs — e.g. the stable and unstable segments of a branch. Autoscale
(
CalculateDataBounds) ignores NaN points too, so they never poison the range. - Single-point series still render their marker. The draw guard is
Count < 1, notCount < 2, so a lone special point (a fold, a Hopf point) is a perfectly good one-point series with markers on and the line off. ShowInLegendkeeps a curve on the chart but out of the legend, independently ofVisible. Used to collapse several runs of one branch — all sharing a name and style — down to a single legend entry.SeriesKind(skSimulation/skData) andSeriesIdclassify a series;ClearSeriesKind(skData)removes all of one kind.Tagis a free-form integer for the host; the component never interprets it.SourceTagsare a sparse back-reference from a plotted point to the row it came from — populated only by the taggedAddXYoverload, keyed by point index.- Markers:
symPoint,symSquare,symCircle,symCross,symTimes,symDiamond,symTriangle. Line styles:ltSolid,ltDashDash,ltDotDot.
Series management on the control: AddSeries, ClearSeries, ClearSeriesKind,
Series.Find(Name, Index).
Drop lines (residual / stem plots)
Switching on DropLinesVisible draws a vertical line from every point in the
series down to a baseline — the conventional way to present residuals. It is a
whole-series setting; there is deliberately no per-point control.
ps := TPlotSeries.Create('residuals', claRed, True);
ps.LineVisible      := False;      // markers + stems, no connecting curve
ps.DropLinesVisible := True;
Plot.AddSeries(ps);| Property | Default | Meaning |
|---|---|---|
DropLinesVisible |
False |
Off, so existing plots are unaffected |
DropLineColor |
series colour | Stem colour |
DropLineWidth |
PlotDefaults.LineWidth |
Stem width |
DropLineStyle |
ltSolid |
ltSolid, ltDashDash or ltDotDot |
DropLineBaseline |
0.0 |
Where the stems land, in data coordinates |
Notes:
DropLineBaselineis a data value, not a pixel position —0.0is the zero line a residual plot wants. Set it elsewhere to stem from a different level. The baseline does not have to be inside the view; stems are clipped to the plot area like everything else.- On a log Y axis a baseline of zero or less has no representation, so the stems fall to the foot of the plot area instead.
- Stems are drawn before the curve and markers, so those land on top, and they honour the same skip rules — a NaN pen-lift or a log-excluded point gets no stem, just as it gets no marker.
- Dashed stems restart their pattern on each stem rather than running continuously through the series.
- The settings are cloned and persisted with the rest of the series styling.
Y error bars
Error magnitudes are attached per point; ErrorBarsVisible is the
whole-series switch that draws them. Points without an error simply get no bar,
so a series can carry errors on some points only.
ps.SetYError(Index, E);                  // symmetric
ps.SetYError(Index, EMinus, EPlus);      // asymmetric: below, above
ps.ErrorBarsVisible := True;| Property | Default | Meaning |
|---|---|---|
ErrorBarsVisible |
False |
Whole-series switch |
ErrorBarColor |
series colour | Bar and cap colour |
ErrorBarWidth |
1.0 |
Stroke width |
ErrorBarCapSize |
6.0 |
Total cap width in pixels; 0 draws a bare bar |
ErrorBarDirection |
ebdBoth |
ebdBoth, ebdUp or ebdDown |
Supporting calls: TryGetYError(Index, Minus, Plus), HasYError(Index),
ClearYError(Index), ClearYErrors, YErrorCount.
Notes:
- Magnitudes, not offsets. Signs are ignored (
Absis applied when drawing), so a signed-0.2straight from a CSV gives the same bar as0.2. ebdUp/ebdDowndraw one arm only — for an error meaningful in a single direction, such as a detection limit or a one-sided bound.- Bars are included in autoscale, so an arm is never clipped by the plot
edge — but only when
ErrorBarsVisibleis on, and only in the direction(s) actually drawn. A one-sided bar doesn't widen the range at the other end. - On a log Y axis, an arm at or below zero has no representation, so it is pinned to the foot of the plot area and excluded from the autoscale minimum.
- Bars are drawn under the curve and markers, so the point stays legible on top of its bar, and they honour the same NaN / log skip rules.
- Errors are data, not styling: they travel with
SaveToJson/LoadFromJson(a sparseyErrorsarray of[index, minus, plus]triples) and are deep-copied byClone. The styling snapshot used bySaveSettings/RestoreSettingscarries the five properties above but no magnitudes. A plot file written before error bars existed has noyErrorskey and loads with none.
Loading error bars from CSV
LoadData reads the CSV error-bar extension straight into the series, and
switches ErrorBarsVisible on for any column that carried one — a file that
bothered to record errors expects to see them. Clear the flag on the returned
series if you'd rather not.
"Time", "Conc"
1, 10[0.5]              symmetric: ??0.5
2, 20 [+0.1,-0.3]       asymmetric: 0.1 above, 0.3 below
3, 30                   no error
Only Y errors are picked up. An error in the first column would be an X error, which the series doesn't model yet, so it is ignored.
How the two bracketed values map onto the arms:
- If the signs disagree, they decide:
[+0.1,-0.3]and[-0.3,+0.1]both give 0.1 above and 0.3 below. This is worth stating because the parser stores the first bracketed value in.lowerand the second in.upper, which is the opposite way round from the[+e,-e]convention in its own header comment. Reading the signs sidesteps the naming entirely. - If they don't (
[0.7,0.2]), there is no hint to go on, so position decides: first value below the point, second above. - A single value (
[0.5]) is symmetric.
Styling
Published sub-objects, each a TPersistent with an OnChange that the control
wires to a repaint:
AxisLimits— manualMinX/MaxX/MinY/MaxY(used whenAutoXScaling/AutoYScalingare off).AxisStyle—LogX/LogY, per-axis major/minor tick visibility and length, and tick drawing direction (tmOut,tmIn,tmBoth).GridStyle— per-axis major/minor visibility, colour, width and division counts.LegendStyle— visibility, border, background colour and opacity, anchorLocation(llTopRight,llTopLeft,llBottomRight,llBottomLeft), andClickToToggle/DimmedOpacityfor click-to-show/hide.ChartTitle/XAxisTitle/YAxisTitle(TTextProperty: text, visibility, colour, font size), plusXAxisFontSize/YAxisFontSize.- Plot area:
PlotAreaColor,PlotBorderColor/Width/Visible,BackGroundColor,OriginOnAxis.
When adding a styling property, follow the existing setter → Changed → redraw
pattern.
Default series styling
uPlotDefaults holds a global PlotDefaults record read by TPlotSeries.Create.
Point Plot.DefaultsFile at a JSON file (or call ReloadDefaults) before
adding series:
{
  "series": {
    "lineWidth": 2.0,
    "lineStyle": "Solid",
    "markerSize": 6.0,
    "markerShape": "Circle",
    "markerStrokeWidth": 1.5,
    "markerFillColor": "#FFFFFFFF"
  }
}
All keys are optional; missing keys keep the built-in value.
TColorManager.NextColor cycles a fixed palette so successive series get
distinct colours; TColorManager.ResetCycle restarts it.
Persistence and the settings store
Whole plot to/from a file — every styling sub-object plus all series and their data points:
Plot.SavePlotToFile('plot.json');
Plot.LoadPlotFromFile('plot.json');   // replaces series, overwrites settings
Keys absent from the file keep their current value, so older and newer files load gracefully.
In-memory styling snapshots — styling only, no data points, keyed by string. Typical use is one key per analysis, so switching analyses and coming back restores the styling the user last set:
Plot.SaveSettings('bifurcation');
if not Plot.RestoreSettings('bifurcation') then ... ;   // False if key unknown
Plot.HasSettings(Key);
Plot.DeleteSettings(Key);
Plot.ClearAllSettings;
Plot.SettingsKeys;      // TArray<string>
Per-series styling in a snapshot is matched back up by series Name. The component owns every snapshot and frees them on destroy — callers only ever pass keys.
Import / export
Plot.ExportToPng('chart.png', 4.0);        // scale factor
Plot.ExportToPdf('chart.pdf');
Plot.ExportCSV('all.csv', True);           // SharedXColumn
Plot.ExportCSVSeries('outdir');            // one file per series
S := Plot.ExportCSVSeriesAsString(5, 12);  // decimals, min column width
The CSV reader behind LoadData supports an error-bar extension
(value [+e,-e]) and NA missing-data markers. Error terms are loaded into the
series as Y error bars — see Y error bars.
The reader ends rows on CR, so input files need CRLF (or CR) line endings; an LF-only file fails with "Too many datum points on line: 1".
Precision notes
The data model is Double end to end — TPointD, TPlotMapper.DataRect,
TAxisLimits, the zoom/pan view window, and the accumulators in
CalculateDataBounds. Only pixel space is Single (PixelRect and the draw-call
coordinates), because the Skia canvas API is Single.
Keep it that way: a stray Single anywhere in the bounds or mapping path
re-truncates the values and breaks deep zoom.