

StaticCodeAnalyser

Static code analysis for Delphi 12 & 13 and Lazarus / Free Pascal. RAD Studio IDE plugin (32/64-bit) + standalone GUI + CLI, one engine. 201 rules (Pascal AST + DFM/LFM forms): leaks, SQL injection, dead handlers, hardcoded secrets, Unicode & Trojan Source, Win64 pointer bugs. SARIF for CI/CD, SonarQube push.
- Active · last change 11-4-2026
- ★ 43 on GitHub
README
# Static Code Analysis Tool for Delphi and Lazarus / Free Pascal
If this plugin saves you time in your Delphi work, a coffee is appreciated. 🙏
Delphi static code analysis tool and linter for RAD Studio 12 (Athens)
and 13 (Florence) — ships as an IDE plugin with a dockable tool window plus a
standalone Windows app. The installer serves the 32-bit IDE of Delphi 12 and
both IDEs of Delphi 13, 32- and 64-bit; the standalone app ships as a 32-bit and
a 64-bit build. Lazarus / Free Pascal projects are scanned natively by the
standalone app and the CLI — same engine, same rules, dialect-aware: .lpi/.lpk
projects, .pp/.lpr units and .lfm forms
(details).
AST-based analysis with 205 rules: 181 Pascal checks for memory leaks,
SQL injection, code smells, security vulnerabilities, file-encoding & Unicode safety
(Trojan Source), and code duplication
(including a Sonar-Delphi-compatible subset SCA060+), plus a
dedicated DFM scanner with 23 checks built on its own DFM lexer + parser + component
graph paired with the Pascal AST — dead event handlers, hard-coded DB credentials in
form files, circular master-detail wiring, required dataset fields without UI binding,
SQL built from TEdit.Text, cross-form coupling, and more. Sonar-style classification
with a Quality Score. Repo-wide form index for cross-unit analysis. VCS-diff mode
treats .dfm changes as triggers for the companion .pas. HTML report with grouped
.pas+.dfm filter. IDE plugin opens DFM findings as text directly in the Code
Editor. Copy an AI-ready Markdown fix prompt for any finding to the clipboard
(context menu; automatic copy-on-click is opt-in). Open source, MIT-licensed.
🇩🇪 Deutsche Version · 🇫🇷 Version française
What this plugin does
In one sentence: Sonar-style analysis for Delphi projects, with no Sonar setup required, running inside the IDE, with a Claude AI hand-off.
| Capability | Details |
|---|---|
| 🐛 Bug detection | 181 Pascal rules run against every .pas file (MemoryLeak, NilDeref, DivByZero, FormatMismatch, MissingRaise, RoutineResultUnassigned, CharToCharPointerCast, UnpairedLock, GetMemWithoutFreeMem, PointerArithmeticOnString, …) plus 23 DFM rules against every .dfm (dead event handlers, hard-coded DB credentials, circular master-detail, unused components, …) and one rule for .ini files — 205 total, delivered by 162 pipeline registrations |
| 🔐 Security checks | SQLInjection (score-based), HardcodedSecret, HardcodedPath, HardcodedIpAddress (also in .ini files); Unicode safety — Trojan Source / bidirectional-override (CVE-2021-42574), invisible / zero-width characters, BOM / UTF-8 encoding integrity |
| 🧹 Code smells | LongMethod, MagicNumber, EmptyExcept, MissingFinally, DeadCode, DuplicateString/Block |
| ⚡ Incremental analysis | "Branch-Changes" button: only the files modified in the Git/SVN branch — 200 ms instead of 60 s |
| 🤖 Claude AI prompt | Copy AI prompt (context menu) → a complete Markdown block with code context + before/after is copied to the clipboard; copy-on-click is opt-in via [UI] ClipboardOnClick |
| 📊 Sonar-style dashboard | Stat tiles above the grid: Errors / Warnings / Hints / Bugs / Vulnerabilities / Code Quality as a letter grade A–E (Sonar-style; raw score + breakdown in the tooltip) |
| 🎯 Filter & sort | Severity dropdown, type dropdown, live search box, clickable column headers |
| 📤 Export | SARIF, Sonar Generic Issue, self-contained HTML report, CSV, JSON and baseline JSON from the CLI and the GUI; Jira wiki markup and clipboard hand-off from the GUI — formats, workflows and limits in EXPORTS.md |
| 🔇 Suppression | // noinspection MemoryLeak per line, plus ignore.txt for whole files |
| 🌓 Theme aware | Follows the active IDE theme automatically (Light / Dark / Mountain Mist / Carbon) |
| 💡 Before/after help | Every detector has a paired "wrong way / right way" code example in the help panel |
| 🔧 Code actions | reDelphix, part of SCA: quick fixes at findings and refactorings in the editor, always installed with the IDE plugin |
Main features
1. Static code analysis (205 rules — 181 Pascal + 23 DFM + 1 INI, Sonar taxonomy)
Pascal AST checks (~160): bugs (MemoryLeak, NilDeref, DivByZero, FormatMismatch, ReversedForRange, SelfAssignment, VirtualCallInCtor, MissingRaise, RoutineResultUnassigned, ReRaiseException, InstanceInvokedConstructor, CharToCharPointerCast, UnicodeToAnsiCast, DateFormatSettings, IfThenShortCircuit, …), vulnerabilities (SQLInjection, HardcodedSecret, DisabledTlsVerification), security hotspots (HardcodedPath, HttpInsteadOfHttps), code smells (LongMethod, MagicNumber, DeadCode, EmptyExcept, MissingFinally, CastAndFree, NilComparison, InheritedMethodEmpty, RaisingRawException, ~60 SonarDelphi-compatible naming/formatting checks SCA060-SCA131, …), and code duplication (DuplicateString, DuplicateBlock).
DFM checks (23) on the dedicated form-file lexer + parser +
component graph, paired with the Pascal AST via the FormBinder: dead
event handlers, hard-coded DB credentials in form files, circular
master-detail wiring, required dataset fields without UI binding, SQL
built from TEdit.Text, cross-form coupling, duplicate-control
hot-keys, untranslated Caption strings, and more. Repo-wide form
index for cross-unit analysis.
Every finding ships with a before/after fix in the help panel.
2. Incremental VCS-aware analysis (Git + SVN)
Skip the full project scan. One click on Branch-Changes is enough:
the analyser asks git diff (or svn status) for the .pas files
touched in your branch and runs the detectors only on those.
~200 ms instead of 60 s for a typical feature branch — cheap enough
to use as a pre-commit gate. Configuration lives in analyser.ini. Full
details in BRANCH_CHANGES.md.
3. AI hand-off (Claude prompt with one click)
Right-click a finding row and choose Copy AI prompt — the clipboard is filled with a ready-made Markdown prompt: finding metadata, code context (±5 lines, with a marker on the offending line), and the before/after fix. Paste it into Claude with Ctrl+V — the AI now has everything it needs to suggest a concrete patch.
The automatic copy on a plain row click is off by default and
configurable via [UI] ClipboardOnClick in analyser.ini: 1 = leave
the clipboard alone (default), 2 = a compact Jira mini issue
(headline + 5 fact bullets), 3 = the full Claude prompt on every
click. Nothing ever leaves your machine — the text only goes to the
local clipboard.
Use cases by deployment mode
The same analyser engine ships in three forms, each tuned for a different workflow. Pick by where you sit in the day:
| Use case | IDE plugin | Standalone EXE (GUI) | CLI (same EXE) |
|---|---|---|---|
| Inline review while coding — see Bug/Vuln markers next to the line you just wrote | ✅ live grid + 3 px editor stripe + hover-overlay | — | — |
| Quick-Fix the current line — apply a patch suggestion in place | ✅ Ctrl+Alt+F or light bulb, via reDelphix |
— | — |
| Navigate findings with the keyboard | ✅ grid + arrow keys, the editor follows | grid + arrow keys | — |
| Suppress a false positive on this line | ✅ Ctrl+Alt+S adds // noinspection RuleName |
manual | manual |
| Hand a finding to Claude AI — Markdown prompt with code context | ✅ context menu → clipboard (or opt-in row-click) | ✅ context menu → clipboard (or opt-in row-click) | — |
Branch-changes only — analyse files touched since main / current SVN diff |
✅ ☰ → Analyse Branch-Changes | ✅ ⎇ button | ✅ --branch or --diff <ref> |
| Analyse a project outside Delphi (RAD not installed / batch machine) | — | ✅ pick a folder, click ▶ Analyse | ✅ StaticCodeAnalyser.d12.exe --path <folder> |
| Run as a pre-commit hook | — | — | ✅ --min-severity error --quiet --fail-on error, exit code reflects severity |
| Run in CI / GitHub Actions | — | — | ✅ --report-sarif sca.sarif, SARIF upload step |
Get findings into SonarQube / SonarCloud (SCA writes the file, sonar-scanner imports it) |
✅ Export → Sonar | ✅ Export → Sonar | ✅ --sonar-export sca-findings.json — see EXPORTS.md |
| Generate an HTML report for stakeholders / Jira attachments | ✅ Export → HTML | ✅ Export → HTML | ✅ --report-html <file> |
| CSV / JSON export of findings | ✅ Export menu | ✅ Export menu | ✅ --report-csv <file>, --report-json <file> |
| Jira export of findings | ✅ Export menu | ✅ Export menu | — (GUI only) |
| Nightly full-repo scan + diff-against-baseline | — | ✅ schedule via Task Scheduler | ✅ schedule via cron / schtasks |
| Auto-analyse on file save (Live-Watch) | ✅ opt-in, see Live-Watch | — | — |
Author / edit custom rules (YAML file, [Detectors] CustomRulesFile) |
✅ edit analyser.ini |
✅ edit analyser.ini |
✅ --custom-rules <yml> or analyser.ini |
Configure detector thresholds (LongMethodMaxBodyLines, …) |
✅ Settings | ✅ Settings | edit analyser.ini |
| Switch UI language (EN / DE / FR) | ✅ Tools → Options | ✅ hamburger menu → Language | n/a (the CLI has no language switch) |
Pick a rule-set profile (ide-fast, default, strict) |
✅ profile combo | ✅ profile combo | ✅ --profile <name> |
Which deployment fits which role
Developer at the keyboard → IDE plugin. Tightest feedback loop: inline markers, jump-to-line, Quick-Fix-in-place with reDelphix, clipboard-to-Claude. The plugin shares the SAME engine + rule catalog
- FixHints as the other two. The numbers can still differ from CI: the
plugin starts on the
ide-fastprofile, and project scans differ by design (see Scan scope).
Code-reviewer / Tech-lead without RAD Studio open → Standalone GUI.
Same grid, same filter, same help-panel as the plugin, but works on a
folder of .pas+.dfm without the IDE running. Useful for: review on
a different machine, overnight batch on a build server with no Delphi
seat, sharing the EXE with a non-Delphi engineer for one-off audit.
CI pipeline / pre-commit hook / scheduled task → CLI mode of the same
EXE. No GUI, the exit code grades the result and --fail-on <level> sets
the threshold (0 = clean / below threshold; the tiers are listed under
CI/CD integration). Exports available in CLI: SARIF
(--report-sarif <file>) for GitHub Code-Scanning / Azure Pipelines,
Sonar-Generic JSON (--sonar-export <file>) for SonarQube imports, an
HTML report (--report-html <file>), CSV (--report-csv <file>) and
JSON (--report-json <file>). The AI prompt and the Jira text are
GUI-only. Branch-changes filter (--branch for git current branch vs main, or --diff <ref>
for an arbitrary base) lets PR builds analyse only what the diff
touched.
All three modes read the same analyser.ini, the same
rules/sca-rules.json, the same suppression markers, and emit the
same finding kinds. Switching between them is free — a finding
suppressed in the IDE stays suppressed in CI.
Quick start
-
Install the plugin — two routes, in recommended order:
- Setup EXE (recommended): download
StaticCodeAnalyserSetup-<Version>.exefrom the GitHub releases and run it. Per-user install, no admin rights required.
The setup asks which IDEs to install into and lists only the ones it actually finds on the machine:
installs to | Delphi 12 (32-bit IDE) |
bpl\d12|BDS\23.0\Known Packages| | Delphi 13 (32-bit IDE) |bpl\d13|BDS\37.0\Known Packages| | Delphi 13 (64-bit IDE) |bpl\d13x64|BDS\37.0\Known Packages x64|Only the ticked entries are installed, and unticking a previously installed one removes it — files, registration and PATH entry. Each ticked IDE gets the plugin, its two runtime packages and reDelphix, which always comes with the plugin. So that the IDE finds the runtime packages, the setup puts its folder at the front of the IDE's PATH setting (Tools > Options > IDE > Environment Variables); existing entries stay, and uninstalling removes only this folder. The setup also verifies that no Delphi IDE is running, cleans up conflicting registrations of the development package set, offers a German/English language choice, shows the MIT license page and creates a Start-menu uninstall entry.
Updating from 0.9.18: run the new setup. It removes the former single-BPL plugin (
StaticCodeAnalyser.Plugin.d12) from all IDEs, also one installed from GetIt, and says so in a message.- Build it yourself: open
StaticCodeAnalyser.d12.groupprojand build the packages one at a time, in this order:SCA.Engine,SCA.SharedUI,StaticCodeAnalyser.IDE.d12,reDelphix.d12(right-click → Build). Not "Build All": the group also holds test projects that need DUnitX. Build all four for the platform of your IDE; Delphi 12 has a 32-bit IDE only, so Win32 (on Win64 the plugin stops under Delphi 12 with a deliberateF1054). Then installStaticCodeAnalyser.IDE.d12andreDelphix.d12(right-click → Install), neverSCA.EngineorSCA.SharedUI. Without the install step the plugin compiles but never appears in the IDE menu. Full instructions in HowTo_Build.md, section 5.
GetIt is suspended for 0.9.19: the package set cannot be installed through GetIt. If you use GetIt, take the setup.
- Setup EXE (recommended): download
-
In Delphi: View → Static Code Analysis — the dockable window shows up.
-
Pick a project path → click ▶ Analyse.
For incremental scans of branch-changed files only, see BRANCH_CHANGES.md.
What a release contains
Every release on the releases page ships five artifacts:
| Artifact | What it is |
|---|---|
StaticCodeAnalyserSetup-<V>.exe |
IDE plugin installer. Per-user, no admin rights. Picks the target IDEs from what it finds — Delphi 12 (32-bit) and Delphi 13 (32-bit and 64-bit) — and brings reDelphix along. |
StaticCodeAnalyser-v<V>-Win32.zip |
Standalone EXE, 32-bit, with the rule catalogue. Stack reserve patched to 32 MB — needed for deep ASTs on large code bases. |
StaticCodeAnalyser-v<V>-Win64.zip |
Standalone EXE, 64-bit. Use this one for large corpora; the address space is the limit that matters there. |
StaticCodeAnalyser-v<V>-source.zip |
Sources as of the release tag. |
StaticCodeAnalyser-v<V>-docs-scripts.zip |
Documentation and CI examples — all guides in English, German and French, plus examples/ (GitHub-Actions workflow with SARIF upload, pre-commit hook, PR comment bot, MSBuild target, rule profiles). |
The plugin and the standalone EXE share the same engine and the same rule catalogue; they differ only in how you drive them.
Code actions: reDelphix
reDelphix is the SCA feature that adds code actions to the IDE plugin,
as a design-time package of its own.
At a finding it offers quick fixes — for 96 of the 205
rules, for example FreeAndNil(X), try/finally around a release or
Format() instead of a concatenation — through a light bulb at the caret
line, the context menu of the finding (editor and findings grid) and
Ctrl+Alt+F in the grid. Without a finding, the editor context menu
offers refactorings at the caret, such as inverting an if. Every action
checks the current editor buffer first and writes only into the editor,
as one undo step, never into a file. An action that changes behaviour
says so in its menu text and never runs through Ctrl+Alt+F.
The setup installs it. reDelphix belongs to the IDE plugin: every IDE the setup serves gets it, including the 64-bit IDE of Delphi 13, and it cannot be unticked. The ZIPs do not contain it.
You can also build it from source. That takes the dev package set
(SCA.Engine, SCA.SharedUI, StaticCodeAnalyser.IDE.d12), because
reDelphix links against SCA.Engine. Remove a setup installation for that
IDE first.
The steps are in HowTo_Build.md.
An own build also runs without the package: Ctrl+Alt+F then reports
that it is not loaded, Ctrl+Alt+S still inserts the suppression
marker.
Every action with its menu texts, effect, locks and an example: reDelphix/QUICKFIXES.md. Development notes: reDelphix/README.md. Both are in German.
Sonar integration
SCA-Findings can be exported as external issues to SonarQube /
SonarCloud (complementary to SonarDelphi
— our findings are mORMot-aware, cover DFM files, and ship sonar-foreign
checks like TautologicalBoolExpr, ConcatToFormat, WithStatement).
Tested with: SonarQube Community Build 26.5+ (Sonar 10+, MQR mode). SCA findings import as external issues via Generic Issue Format and sit alongside Sonar's built-in default profile (Sonar Way) — no conflict, no override. Works with both SonarQube Server and SonarCloud.
# Run analysis and emit Generic Issue Format for sonar-scanner
StaticCodeAnalyser.d12.exe --path . --sonar-export sca.json --profile default
sonar-scanner   # picks up via sonar.externalIssuesReportPaths
Each rule carries SonarQube MQR fields (cleanCodeAttribute + impacts) so
findings show up correctly in the MQR dashboard.
SCA only writes the file. Short guide: sonarHowto.md; server, scanner and tokens are covered by the official Sonar documentation.
What is detected (205 rules — 181 Pascal + 23 DFM + 1 INI)
Findings fall into one of five Sonar categories:
| Category | Detector | Severity |
|---|---|---|
| Bug | MemoryLeak (LeakDetector + FieldLeak) |
Error / Warning |
NilDeref (nil dereference) |
Warning | |
DivByZero (division by zero) |
Error / Warning | |
FormatMismatch (format vs argument count) |
Error | |
| Vulnerability | SQLInjection (score-based) |
Error |
HardcodedSecret (API keys, passwords) |
Error | |
| Security Hotspot | HardcodedPath (C:\…, /etc/…) |
Warning |
| Code Smell | EmptyExcept (silent swallow) |
Warning |
MissingFinally (Free outside finally) |
Warning | |
DeadCode (unreachable after exit/raise) |
Warning | |
UnusedUses (optional, default off) |
Hint | |
LongMethod, LongParamList |
Hint | |
MagicNumber (in if conditions) |
Hint | |
DebugOutput (OutputDebugString etc.) |
Warning | |
DeepNesting |
Hint | |
TodoComment (TODO/FIXME/HACK) |
Hint | |
EmptyMethod |
Hint | |
| Code Duplication | DuplicateString (same literal, ≥3 occurrences) |
Hint |
DuplicateBlock (≥ DuplicateBlockMinLines, default 8 identical lines) |
Hint | |
| Read error | FileReadError (parser hang or oversized file) |
Error |
Every detector comes with a before/after code example in the help
panel. Copy AI prompt (context menu) copies a Markdown block ready
for Claude AI to the clipboard; the automatic copy on row click is
opt-in via [UI] ClipboardOnClick (off by default).
For the 23 DFM-specific detectors (DFM-DeadEventHandler, DFM-HardcodedDBCredentials, DFM-CircularMasterDetail, DFM-MissingRequiredFieldBinding, DFM-SQLFromTEditText, …) and their fix hints: see DETECTORS.md.
Full status of all 50 Sonar rules: see DETECTORS.md.
Usage
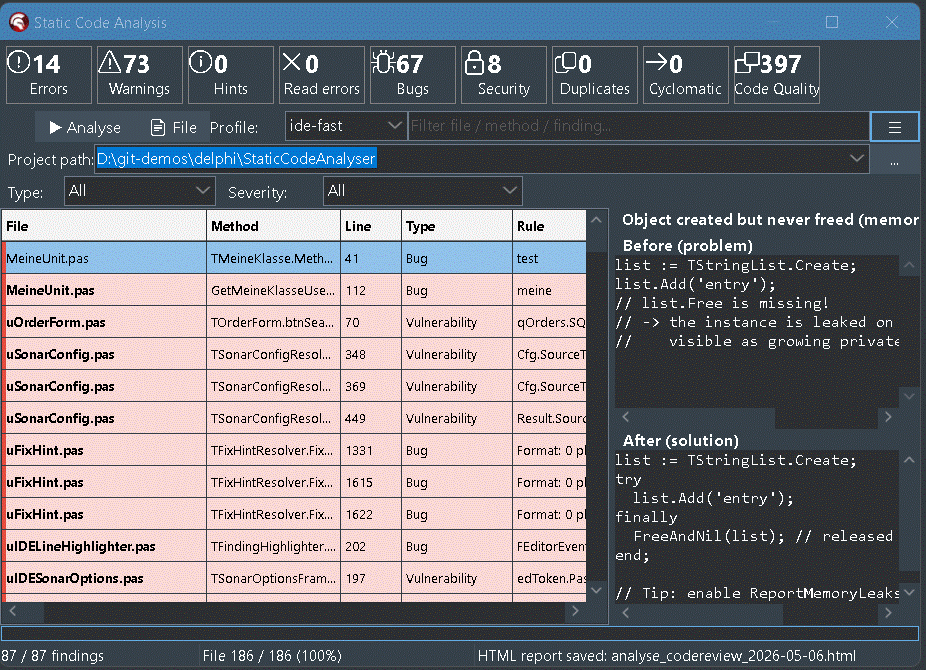
Toolbar and ☰ menu
The folder picker (...) sits at the right end of the path row. The
toolbar, left to right:
| Button | IDE plugin | Standalone EXE | Function |
|---|---|---|---|
| ▶ Analyse | ✅ | ✅ | Recursive scan — what is analysed (folder / project / group) is shown in the button hint |
| 📄 File | ✅ | ✅ | Plugin: the .pas file currently open in the editor. EXE: a .pas file picked in a file dialog |
| ⊘ | ✅ | — | Clear the editor markers in all files (the grid stays) |
| ⎇ | — | ✅ | Branch-Changes: only files changed in Git/SVN (see BRANCH_CHANGES.md) |
| Profile | ✅ | ✅ | Rule-set profile for the next run (see Filter below) |
| ☰ | ✅ | ✅ | Opens the menu below |
Everything else is in the ☰ menu:
| Menu item | IDE plugin | Standalone EXE | Function |
|---|---|---|---|
| Analyse Branch-Changes | ✅ | — (⎇ button) | Only files changed in Git/SVN (see BRANCH_CHANGES.md) |
| Cancel Analysis | ✅ | ✅ | Aborts a running analysis; the EXE also shows a Cancel button in the status bar while it scans |
| Clear all markers, Reset all findings | ✅ | — | Remove the editor markers; the reset also empties the grids |
| Export... | ✅ | ✅ | Export formats, see Export below |
| Write baseline from current scan..., Show only new findings (baseline) | ✅ | ✅ | Write a baseline, show only findings that are not in it |
| Settings... | ✅ | ✅ | Open analyser.ini — VCS settings, custom LeakyClasses (see BRANCH_CHANGES.md) |
| Ignore list... | ✅ | ✅ | Open ignore.txt — file/folder exclusion list |
| Rule-set profiles... | ✅ | ✅ | Show the bundled profiles |
| Appearance, Open findings with, Language | — | ✅ | Theme, target for opening findings, UI language; in the plugin the IDE provides these |
Opening a finding
Double-click a row in the result grid. What happens next depends on
[Editor] in analyser.ini — reread on every double-click, so edits
take effect immediately.
[Editor] key |
Meaning |
|---|---|
ExternalEditor |
Full path to an editor. When set it handles every file type — including .dfm — and the Delphi IDE is not involved. Empty (default) = off. |
ExternalEditorArgs |
Argument template. Placeholders: %file%, %line%, %col%, %dir%, and %% for a literal percent sign. Anything else between percent signs is left alone. |
DfmTarget |
ide (default) or viewer — what a .dfm finding opens when no external editor is set. |
[Editor]
; Visual Studio Code
ExternalEditor=C:\Program Files\Microsoft VS Code\Code.exe
ExternalEditorArgs=-g "%file%:%line%"
Templates for other editors are listed in analyser.ini itself
(Notepad++, Sublime Text, UltraEdit, IntelliJ/Rider). Values containing
a space are quoted automatically when the placeholder is not already
inside quotes, so a template without quotes still works.
Why you may want an external editor. The standalone EXE cannot ask the Delphi IDE to jump to a line — RAD Studio exposes no command-line switch for that. It hands the file to the Windows shell and then simulates Ctrl+G plus the digits, which only works while the IDE actually holds the foreground. An editor that takes the line number as an argument always hits. (The IDE plugin has no such problem: it navigates through the ToolsAPI directly and ignores these settings entirely.)
.dfm findings. The IDE opens a .dfm in the form designer
depending on how the extension is registered, and there is no route to a
line number there. The built-in viewer shows the file as text and jumps
to the line reliably, but is read-only. Pick with DfmTarget, or from
the hamburger menu under Open findings with. If no handler responds
at all, the viewer is used regardless.
Per-detector configuration
There are no toggle checkboxes in the toolbar. All optional detector
behaviour is configured via analyser.ini (see Configuration files
below) — open it through ☰ → Settings..., edit, save, click
▶ Analyse again. Settings are reloaded on every run, no IDE
restart required.
Stat cards
One row of tiles above the grid counts the findings of the last run:
- Errors / Warnings / Hints / Read errors: by severity. A read error counts only under Read errors.
- Bugs / Security / Duplicates: by type — Bug, Vulnerability, Code Duplication. Code smells and security hotspots have no tile of their own; they count in the severity tiles and in the quality score.
- Cyclomatic: findings of the McCabe complexity rule (SCA022), counted in addition to their severity.
A click on a tile filters the grid to that group; a click on the Quality tile resets all filters. In a narrow plugin window only Errors, Warnings, Hints and Quality stay visible.
A Quality score tile next to them shows the code quality as a letter grade A–E (Sonar-style); the raw score and its breakdown appear in the tile's tooltip.
Filter
- Severity / type dropdowns: narrow the grid down to a single category.
- Profile dropdown: switch the active rule-set on the fly. Bundled
profiles:
ide-fast(IDE default — bugs + vulns only),default(everything except the eight pure-convention rules),strict(really everything; SCA007 only with[Detectors] UsesCheck=1, unlike the CLI),style(exactly those eight),security(vulns + hotspots only),bugs-only,code-quality,dfm-only. Profiles live inrules/sca-rules.jsonunderprofilesand the dropdown is populated from there — drop your own profile in the JSON and it shows up. Selection is persisted to[Rules] IdeProfileand takes effect at the next analysis run. - Search box (
Filter file / method / finding): live filter across every column.
Grid interaction
| Action | Effect |
|---|---|
| Click a row | Shows the finding in the help panel; if the file is open in the IDE, a 3 px stripe is painted on the left edge of the corresponding line in the editor. What lands in the clipboard is controlled by [UI] ClipboardOnClick: 1 = nothing (default), 2 = Jira mini issue, 3 = Markdown prompt for Claude AI. |
| Right-click → Copy AI prompt | Copies the Claude AI Markdown prompt — always, regardless of ClipboardOnClick. |
| Double-click / Enter | Open the file in the IDE, jump to the finding line, paint the line marker |
| Ctrl+Alt+F | Apply the quick fix of the finding — the first available code action of the reDelphix package, the same one the light bulb offers (in-place via IOTAEditWriter after checking the buffer, one Ctrl+Z step). Code actions marked "(changes behavior)" run only from the menu or the light bulb. Needs reDelphix; the status bar reports the result or why there is no quick fix. |
| Ctrl+Alt+S | Insert suppression marker above the finding line: // noinspection <RuleName> (reDelphix adds the rule to an existing marker). Next analysis run filters the finding. Ctrl+Z to revert. |
| Arrow keys, Page Up/Down, Home/End | Move through the grid; once the selection rests, the editor jumps to the finding |
| Hover (file column) | Tooltip with the full file path (100 ms delay) |
| Click a column header | Sort by that column |
| 3 px stripe on the left edge of the grid row | Severity accent (red / orange / green / blue) |
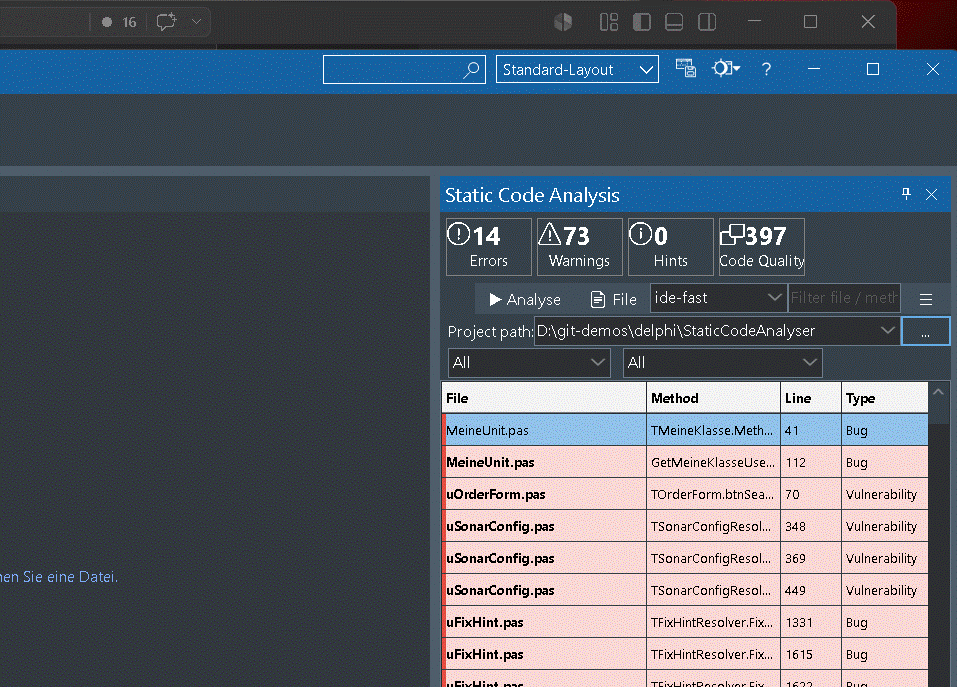
The right-side help panel with before/after code blocks is shown only when the IDE plugin window is floating — when docked into a side bar / tab the panel auto-hides and the grid takes the full width (re-appears within ~250 ms after un-docking).
Export
☰ → Export... opens these entries:
| Entry | Format | Content |
|---|---|---|
| JSON | .json |
The filtered grid view as an array (the menu caption says so) |
| CSV | .csv |
Excel-friendly (semicolon-separated) |
| HTML report | .html |
Self-contained workbench report — search, filters, top-lists, sortable columns, side drawer with source excerpt and rule documentation. Suggested file name sca_codereview_YYYY-MM-DD.html. See below |
| SARIF | .sarif |
All findings, for GitHub Code Scanning and other SARIF consumers |
| Sonar | .json |
All findings as a Sonar Generic Issue report for sonar-scanner |
| Detector info | .html |
The rule catalogue as an HTML page |
| Jira | Clipboard | Wiki markup ready to paste into a Jira ticket (filtered to one file) |
| Clipboard | Clipboard | Plain text with before/after (filtered to one file) |
The HTML report
One report instead of a growing family: next to the original HTML report the menu had gained a second, workbench-based one — and a third variant existed briefly during development. Since 2026-09-09 the GUI ships exactly one, the workbench report.
It opens with the health rating, the stat tiles and two top-lists ("where does it hurt?"), followed by search, the file and rule dropdowns and the type / severity / confidence chips. A click on a finding opens a side drawer with the source excerpt, the location and the documentation for that rule, including the reDelphix code actions the rule has (see below). Page header, filter bar and column row pin below one another as you scroll, so you always see what you are filtering and which column you are reading.
It is self-contained — no external assets, no CDN, nothing leaves the machine. It opens from a file share or a CI artifact.
Size matters at this scale, and three things keep it down: the rule documentation is stored once per rule instead of once per finding, the source excerpt is stored as plain text and only rendered when the drawer opens, and the search text is read off the row instead of being written out a second time. Together that is roughly half of what the same report used to weigh.
The CLI's
--report-htmlis a different report — see EXPORTS.md.
File-Findings panel (per-file dock)
A second dockable window that focuses on the currently active editor file. Open via View → Static Code Analysis - File. Designed for side-docking next to the editor so you always see the findings for the file you are working on.
| Property | Behaviour |
|---|---|
| Trigger | Auto-scans the active editor file on open and on every tab switch. No "Aktuelle Datei" click needed |
| Live update | If the watch-mode is active, save/edit triggers re-feed the panel as well |
| Grid columns | Method / Line / Type / Rule / Severity (Rule stretches; severity accent bar on the left of every row) |
| Filter | Combo with All severities / Errors only / Errors + Warnings |
| Sort | Click a column header to sort (toggle asc/desc) |
| Click a row | Jump to the finding line in the editor (soft navigate, does not close/reopen the file) |
| .pas + .dfm | Treated as one scan target — tab-switching between them keeps the findings visible |
| Position memory | Re-opens at the last position (session-persisted via analyser.ini, cross-session via IDE Save Desktop). Falls back to centred on the IDE main window when nothing is stored or the position is off-screen |
| Theme + font | Follows the active IDE theme (light/dark/custom) and the plugin font (Segoe UI 8) |
Language / localisation
The UI source language is English; German and French ship with it.
UI strings are wrapped with _('…') from uLocalization.pas, which looks
them up in the .po translations with a small parser of its own. There
is no external library, and the translations are compiled in, so a bare
copy of the EXE shows German or French as well.
Switching the language
| Where | How |
|---|---|
| IDE plugin | Tools → Options → Third Party → Static Code Analyser |
| Standalone EXE | Hamburger menu → Language. Filter row, path row, grid header and the Analyse button switch at once, the remaining captions after a restart |
analyser.ini |
[UI] Language = en, de or fr. Empty or unknown means English; the system locale is not read |
Where translations live
| Path | Purpose |
|---|---|
i18n/template.pot |
Source-language template (English) |
i18n/de.po |
German translation |
i18n/fr.po |
French translation |
i18n/en.po |
English baseline (identity) |
SCA.Engine/sources/Common/uLocalizationPo.inc |
Compiled-in copy, generated from the .po files |
The .po files are plain text and Git-friendly; edit them with
poEdit or a regular editor. A .po in an i18n\
folder next to the EXE or BPL takes precedence over the compiled-in
copy, so a translation can be tried without a rebuild.
The translations themselves are the .po files under
i18n/ — that is the single source. After editing one, run
python tools/gen_po_inc.py to regenerate the compiled-in copy, then do a
Clean + Build: the IDE does not track .inc dependencies reliably and
would otherwise link the previous text.
Theme integration
Standalone EXE: light / dark
The EXE follows the Windows app theme by default and can be pinned
via the hamburger menu under Appearance (Like Windows / Light /
Dark) or in analyser.ini:
[UI]
; system = follow Windows (default), light, dark
Theme=system
Every key of analyser.ini - thresholds, profiles, baseline, UI - is
listed with its default in the
configuration reference. Which rules a
profile actually contains - and how to write your own - is in the
scan-profile guide.
The dark style ships embedded in the EXE — no VCL-style project option
involved. In system mode a Windows theme switch takes effect
immediately (the EXE listens for the broadcast); no restart needed. The
menu writes the very same INI key, so the setting can also be rolled out
by distributing analyser.ini.
Result grid sorting (EXE)
Click a column header to sort; click again to reverse. The arrow in the header shows the active column and direction. Severity sorts by rank (Error > Warning > Hint), not alphabetically. A double-click on the header row just toggles twice — it never opens a finding.
IDE plugin
The plugin tracks the active Delphi IDE theme through several mechanisms:
StyleServices.GetSystemColorin custom drawing (OnDrawCell, TTilePanel.Paint)clBtnFace/clWindow/clBtnTextas property values (auto-themed via VCL Styles)IOTAIDEThemingServices.ApplyThemewhen the frame is hostedINTAIDEThemingServicesNotifierfor live theme changesCM_STYLECHANGEDplus aSetParentoverride as additional triggers
Severity background colors are blended at paint time from the themed
clWindow base mixed with a saturated accent color, so the same code
works in any theme without separate light/dark tables.
Known limitation: in floating mode the plugin window does not pick
up runtime IDE theme changes reliably — INTACustomDockableForm exposes
no official hook for re-applying the theme on the wrapper form.
Workaround: dock the plugin, or close and re-open the window after
switching themes.
Scan scope: folder, project or project group (CLI)
Besides the recursive folder scan (--path <dir>), the CLI can scan
exactly what a Delphi project file references. The input flags
--path, --file, --project and --project-group are mutually
exclusive (invalid combinations exit with code 99):
--project <file.dproj>— analyses exactly the.pasfiles listed in the.dproj(its DCCReference list). Units that are only reachable via search paths are not included.--project-group <file.groupproj>— analyses the union of all projects in the group, deduplicated.--index-root <dir>— builds the cross-unit index (used by the unused-/reference-family of detectors) over this directory while still analysing only the resolved file list. Default: the common root of the resolved list. Also valid with--branch/--diff.
StaticCodeAnalyser.d12.exe --project D:\repo\MyApp\MyApp.dproj `
  --report-sarif sca.sarif
StaticCodeAnalyser.d12.exe --project-group D:\repo\All.groupproj `
  --report-sarif sca.sarif

# Project-only analysis, but index the whole repo so "unused" verdicts
# see consumers outside the project:
StaticCodeAnalyser.d12.exe --project D:\repo\MyApp\MyApp.dproj `
  --index-root D:\repo
Two things to know:
- IDE plugin and CLI may report different finding counts for the
"same" project — by design. The plugin reads the live project state
from the ToolsAPI (including unsaved membership changes), the CLI
parses the
.dprojon disk; consumer configuration differs as well. Do not expect the numbers to match, and do not tune one to the other. - Baselines are bound to the scan scope. A baseline written from a folder scan does not fit a project scan (different file set → different fingerprint set). Keep one baseline per scope you gate on.
Using the analyser with Git and SVN
The analyser auto-detects the VCS system based on the project
directory (looks for .git/ or .svn/ markers). Custom rules and
all detector configuration are VCS-agnostic — the same workflow
works with both systems.
Auto-detection
| Marker in project path | Detected as | Backend CLI |
|---|---|---|
.git/ (or any parent contains .git/) |
Git | git diff + git status |
.svn/ |
SVN | svn status + svn diff |
| neither | None | --branch disabled, --full works |
A relative --path is first made absolute against the working
directory, so the search through the parent folders works with it too:
--path . --branch also finds the repository from a subfolder.
The VCS executable is located via PATH, then typical install paths
(TortoiseGit, TortoiseSVN, Git for Windows, ...). Override via
analyser.ini (see below).
Using with Git
Plugin/GUI: point the project path at the Git working tree, then run Branch-Changes (plugin: ☰ → Analyse Branch-Changes, standalone EXE: the ⎇ button). The analyser determines:
- Modified
.pasfiles betweenBaseBranchandHEAD(committed) - Plus uncommitted working-tree modifications (when
IncludeWorkingTree=1)
CLI:
StaticCodeAnalyser.d12.exe --path D:\my-git-repo --branch `
  --report-sarif sca.sarif

# Optional: narrow the rule-set via profile + minimum severity
StaticCodeAnalyser.d12.exe --path . --profile security --report-sarif sec.sarif
StaticCodeAnalyser.d12.exe --path . --profile bugs-only --min-severity warning
First run: if you get
0 findings, check the filter line. With thedefaultprofile the tool hides findings in files that look like test fixtures —uTest*.pas,*_Test.pas,*Sample.pas,*Demo.pas,MeineUnit.pas. If your first experiment happens to be calledDemo.pas, it is filtered out. The scan says which files it dropped;--show-test-fixtureskeeps them,--profile strictdisables the filter entirely.
The filter is on automatically for --profile default and
selftest-quiet, and off for every other profile. Both switches override
the profile: --show-test-fixtures keeps fixture findings even under
default, --hide-test-fixtures drops them even under strict or
security. Because the filter runs before the exit code is computed, it
matters in CI, not just on screen.
Conditional compilation ({$IFDEF})
Since 2026-09-05 the analyser parses ONE branch by default — the
Windows compiler view, with the define set MSWINDOWS, WIN64, UNICODE, CONDITIONALEXPRESSIONS. One branch is what a Delphi compiler actually
translates; reading every {$IFDEF} branch (the old default) was a
frequent source of odd findings — duplicate declarations, dead
branches. Three switches control the behaviour:
| Switch | Effect |
|---|---|
--ifdef-aware |
The explicit form of the default — a documenting no-op since 2026-09-05. |
--define X[,Y,Z] |
Replace the default define set with your own. |
--no-ifdef-aware |
Opt out: parse all branches (the pre-2026-09-05 behaviour). Wins over --ifdef-aware regardless of the order on the command line. |
--no-include-defines |
Do not read {$I} includes for the {$DEFINE}s they contain. Reading them is the default since 2026-09-06; --include-defines is its explicit form. |
--ifdef-aware without --define keeps the default set above — it
does not run with an empty set. If your build uses different
defines, pass them explicitly; the failure mode of a wrong set is not
an error message, it is silently missing findings:
StaticCodeAnalyser.d12.exe --path . --full `
  --define MSWINDOWS,WIN64,UNICODE,CONDITIONALEXPRESSIONS,MY_FEATURE
--dialect=fpc extends the effective one-branch view with the
FPC/LCL defines. --dialect=auto resolves the dialect per file in a
recursive --path scan: the first folder upwards with project files
decides (a tie picks delphi), files without one inherit the verdict of
the scan root, and a mixed tree runs both parts and merges the findings.
--file, --branch and --diff resolve once at the scan root;
--project with a Lazarus project forces fpc (see --help).
Lazarus / Free Pascal (FPC)
The analyser scans Lazarus projects natively — same engine, same rules, dialect-aware:
| What | How |
|---|---|
| Dialect switch | --dialect fpc — additionally collects *.pp and *.lpr units, pairs .lfm form files, parses the one-branch view with the FPC/LCL defines, and disables the three Delphi-only rules below. --dialect auto resolves per file in a recursive --path scan, otherwise once at the scan root (see the IFDEF section above). |
| Project scan | --project accepts .lpi / .lpk (and --project-group accepts .lpg) and forces the fpc dialect for that run. |
| Default without switch | [Scan] Dialect=delphi|fpc in analyser.ini (the switch always wins). The GUI reads the same key and offers a toggle via right-click on the status bar; an active fpc dialect shows as Dialect=fpc in the rule-set indicator. |
| Delphi-only rules, skipped under fpc | SCA041 (VCL layer model does not apply to LCL), SCA129 (FPC string is 8-bit/UTF-8 — the cast is not a lossy narrowing), SCA185 (BOM-less UTF-8 is the Lazarus norm; invalid-UTF-8 and ANSI checks stay active). Details on each rule page. |
| IDE plugin | Delphi-IDE only (by design) — Lazarus users scan via CLI or the standalone GUI. |
Full switch reference
StaticCodeAnalyser.d12.exe --help (also -h, -?, /?) prints every
switch with its explanation and exits 0, so it is safe to call from a
script. --version prints the version alone. The help lists every
switch — this README covers the switches in the context of a task, the help
text covers all of them, including diagnostics such as --gate-stats (hit
count per false-positive filter after the scan).
--profile <name> accepts any profile from rules/sca-rules.json
(bundled: default, strict, style, ide-fast, security,
bugs-only, code-quality, dfm-only). default deliberately leaves out
eight pure-convention rules — public-member docs, Assigned() vs <> nil,
begin..end on single-statement branches, asymmetric begin..end around
if/else, with, one-class-per-unit, hardcoded DFM captions and the
function name instead of Result. They are correct findings, but they are conventions,
and together they were 48 % of everything a newcomer saw. --profile style
turns exactly those on; --profile strict turns on everything, SCA007
included (the EXE and the IDE plugin run SCA007 only with [Detectors] UsesCheck=1). --min-severity hint|warning|error skips
detectors below the threshold. Both flags override [Rules] in analyser.ini.
An unknown profile name, mistyped on the command line or in [Rules] Profile, ends the run with exit 99 before the scan, and the message lists
the known profiles. Your own profiles from the profile window
(profiles.json) count as known.
analyser.ini settings for Git:
[Repo]
; empty = auto: origin/HEAD -> main -> master
BaseBranch=develop
; 1 = include uncommitted changes, 0 = committed only
IncludeWorkingTree=1

[Paths]
; empty = auto-detection
GitExe=C:\custom\git\bin\git.exe
Comments go on their own line. A
;after a value is not stripped — it becomes part of the value.BaseBranch=develop ; autoasks Git for a branch literally calleddevelop ; auto.
Using with SVN
Plugin/GUI: identical to Git — pick the working-copy path, run Branch-Changes (☰ menu or ⎇ button, as above). Since SVN has no real "branch" concept in a working copy, branch mode here returns:
- All uncommitted changes (
svn statusoutput: M/A/R/D/?) - Optionally extended with committed differences since BASE revision
Ideal as a pre-commit hook: it checks exactly what would go into
the next svn commit.
CLI:
StaticCodeAnalyser.d12.exe --path D:\my-svn-wc --branch --report-sarif sca.sarifanalyser.ini settings for SVN:
[Repo]
; SVN: typically trunk (informational, no real diff)
BaseBranch=trunk
; include uncommitted changes
IncludeWorkingTree=1

[Paths]
; empty = auto: PATH + TortoiseSVN
SvnExe=C:\custom\svn\bin\svn.exe
Auto-detected SVN paths:
svn.exein PATHC:\Program Files\TortoiseSVN\bin\svn.exeC:\Program Files (x86)\TortoiseSVN\bin\svn.exeC:\Program Files\Subversion\bin\svn.exe
Custom rules with both VCS
The custom-rule engine (YAML profiles) is VCS-independent — it just reads files. Recommended workflow for both VCS systems:
- Place
analyser-rules.yml(or one of the profiles fromexamples/) in the project root — Git/SVN version it along with the source - Reference it in
analyser.ini:[Detectors] ; relative to the project root CustomRulesFile=analyser-rules.yml - Plugin/GUI loads it automatically on the next analysis run; on the
command line
--custom-rules <yml>names the file directly
This way each project carries its own ruleset in the repo — team-shared, versioned, reviewable in PR/MR diffs.
CI/CD integration
GitHub Actions (Git): see template examples/ci/github-actions-sca.yml.
SARIF upload appears as inline annotations in PRs.
GitLab CI / Jenkins / TeamCity / Azure DevOps: same pattern — make the
tool available in the pipeline image, run
StaticCodeAnalyser.d12.exe --path . --branch --report-sarif sca.sarif,
attach the artifact or process further (SARIF plugins available for most
CI systems).
SVN pre-commit hook (Windows, on the machine that holds the repository):
The analyser is a Windows program, so the hook runs where the repository
lives, on Windows. It takes the added and modified .pas/.dfm files of
the transaction from svnlook, scans only those, and rejects the commit
from exit code 3 on.
@echo off
rem <repository>\hooks\pre-commit.cmd
setlocal
set "REPOS=%~1"
set "TXN=%~2"

rem Adjust. Set every path here, do not rely on the hook's environment.
rem APPDATA selects the analyser.ini the hook uses.
set "SVNLOOK=C:\Program Files\TortoiseSVN\bin\svnlook.exe"
set "SCA=C:\Tools\SCA\StaticCodeAnalyser.d12.exe"
set "APPDATA=C:\Tools\SCA\hook"
set "WORK=C:\Tools\SCA\work\%TXN%"

rem Copy the added and modified .pas/.dfm files of the transaction.
set "FOUND="
for /f "tokens=1,*" %%A in ('""%SVNLOOK%" changed -t "%TXN%" "%REPOS%""') do (
  if /i not "%%A"=="D" call :copy "%%B"
)
if not defined FOUND exit /b 0

rem The CSV carries the findings; versions before 0.9.19 cannot redirect from cmd.
"%SCA%" --path "%WORK%\src" --full --quiet --fail-on error --report-csv "%WORK%\sca.csv"
set "RC=%ERRORLEVEL%"
if %RC% GEQ 3 if exist "%WORK%\sca.csv" type "%WORK%\sca.csv" 1>&2
rd /s /q "%WORK%"

rem SVN rejects the commit on any non-zero exit and shows only stderr.
rem 3 = errors, 4 = read errors, 99 = tool error: block. 0: allow.
if %RC% GEQ 3 (
  echo SCA: commit blocked, exit code %RC%. 1>&2
  exit /b 1
)
exit /b 0

:copy
set "P=%~1"
if /i not "%P:~-4%"==".pas" if /i not "%P:~-4%"==".dfm" exit /b 0
set "FOUND=1"
set "P=%P:/=\%"
for %%D in ("%WORK%\src\%P%") do if not exist "%%~dpD" mkdir "%%~dpD"
"%SVNLOOK%" cat -t "%TXN%" "%REPOS%" "%~1" > "%WORK%\src\%P%"
exit /b 0- Checked with a local
file://repository (Subversion command-line tools from TortoiseSVN): hints pass, an error blocks and shows the findings, a missing tool blocks too.--fail-on errorwas added afterwards and checked on the EXE alone: a read error next to hints returns 4 instead of 1. Under svnserve or Apache the hook runs as the service account; it needs read access to the tool and write access toWORKandAPPDATA. - Only the committed files are scanned, not the rest of the repository. Findings that depend on other units can differ from a full scan.
Exit code mapping with --fail-on error:
- 0 = no errors (hints and warnings do not count) → commit allowed
- 3 = errors → commit blocked
- 4 = read errors (files the scan could not read), also next to hints or warnings → commit blocked; a scan that skipped files must not look like a clean one
- 99 = tool error (bad arguments, unknown profile, report not writable)
→ commit blocked. A scan that never happened must not look like a clean one;
the
GEQ 3rule above covers both.
Without --fail-on the exit code is graded (1 = hints, 2 = warnings,
3 = errors) and reports only the highest rank: a read error next to a
hint returns 1, and the hook would let it through. To block warnings as
well, write --fail-on warning and GEQ 2; warnings then return 2.
--parallel — correct, but pointless
Corrected on 2026-09-15. This section read "broken, do not use" until today. It had been obsolete since 2026-08-20: the switch was repaired, and this text spent almost a month warning about a fixed bug.
Measured on 2026-09-15, a repository of 137 source files, four runs (one serial, three parallel): a single SARIF byte hash across all four, 9,086 findings each, zero adds and zero drops in the multiset diff. The result is deterministic and identical to the serial run.
It just does not buy anything. Measured on the largest single repository of the test corpus (jvcl), two runs each: serial 95.5 s and 94.7 s, parallel 93.4 s and 93.3 s — about 1.8 %, which is noise. The reason appears in the architecture section below: a good share of the wall time is the serial pre-phase (parsing, symbol and type indexes), which the switch does not touch. The stderr notice says the same.
So the recommendation stays "leave it off" — but for a different reason
than before: not because it hurts, but because it gains nothing. For
experiments, --parallel-workers <n> sets the worker count (0 or left
out: the CPU cores, capped at the number of files).
What used to be broken (history, fixed since 2026-08-20)
Eleven detectors shared unit-global TRegEx instances. A TRegEx is a
record around one shared engine object whose subject and offsets are
mutated on every match, so two workers hitting the same detector
corrupted each other's state. Measured back then: five serial runs
produced one identical SARIF hash; thirteen parallel runs produced
thirteen different results, with 40 real findings lost and three
error-severity findings invented.
The older lesson is the more important one: the original "byte-identical" claim had never been measured — the test behind it only checked the merge step, never a real scan. That is why this section now carries run counts and hashes instead of an assertion.
Configuration files
Most settings can be edited through Tools > Options > Third Party > Static Code Analyser in the IDE plugin (live preview, theme-aware):
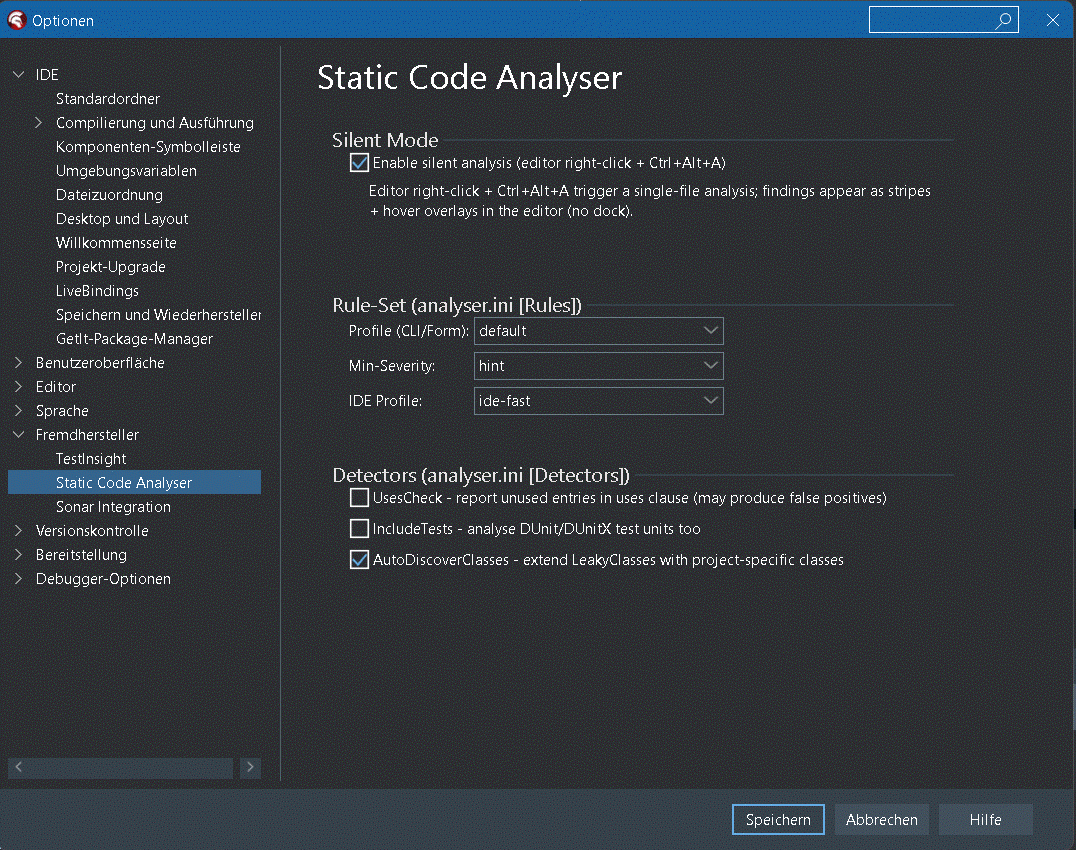
The same values persist to the INI files below — pick whichever is more
convenient. All under %APPDATA%\StaticCodeAnalyser\:
| File | Content |
|---|---|
analyser.ini |
All settings — VCS (BaseBranch, git/svn paths), detector toggles (UsesCheck, IncludeTests, AutoDiscoverClasses), custom LeakyClasses / ExcludeLeakyClasses, detector thresholds, UI language. The file is created on first start with self-documenting comments next to every option |
ignore.txt |
File and directory patterns to skip during analysis |
recent.ini |
Recently used project paths |
LeakyClassesDiscover.log |
Output of AutoDiscoverClasses=1 — discovered classes split into instantiable (have ctor/dtor or Create() call) and static-only candidates. Manually copy the relevant ones into LeakyClasses= in analyser.ini |
StaticCodeAnalyser_scan.log |
Diagnostic log: which file took how long |
Detector thresholds (all optional, in [Detectors])
| Key | Default | Effect |
|---|---|---|
LongMethodMaxBodyLines |
50 | LongMethod triggers when both body-line count AND statement count are above their thresholds |
LongMethodMaxStatements |
30 | (secondary threshold for LongMethod) |
LongParamListMaxParams |
5 | > N parameters → refactoring hint |
DeepNestingMaxDepth |
4 | > N nested control structures |
CyclomaticMax |
10 | McCabe complexity > N per method (counts if, case arm, for/while/repeat, on handler, and/or/xor) |
DuplicateBlockMinLines |
8 | minimum normalised line count for duplicate-block detection |
MaxFileMB |
5 | files larger than that are skipped (OOM guard for generated code) |
MaxLineLength |
120 | TooLongLine triggers when a line exceeds this |
MaxCaseBranches |
10 | CaseStatementSize triggers when a case has this many branches |
MagicNumberTrivials |
0,1,2,-1,10,100 |
numbers exempt from MagicNumber detection |
UsesCheck |
0 | UnusedUses detector (off by default — can produce false positives) |
IncludeTests |
0 | include uTest*.pas, *_Tests.pas, TestProject*.dpr, /tests/ directories |
AutoDiscoverClasses |
0 | scan project AST for custom classes that need Free and add them to LeakyClasses |
LeakyClasses |
(empty) | comma-separated list of additional classes to track |
ExcludeLeakyClasses |
(empty) | comma-separated list of classes to NOT track even if they're in the defaults |
Live-Watch (IDE plugin only) — ⚠️ RISKY
Clicking 📄 File in the IDE plugin activates a single-file live watch on exactly that file: every save (300 ms debounced) and every edit (1000 ms debounced) re-runs the analysis for THIS file in a background thread. Switching tabs to another file changes nothing; clicking 📄 File again moves the watch to the new file. Bulk paths (▶ Analyse, Branch changes) explicitly deactivate the watch. There is no INI flag for this.
⚠️ Infinite-loop risk. A re-entrancy guard allows at most one watch worker at a time, and a generation counter drops late results. There is no watchdog and no hard cap yet: if a worker hangs, the guard blocks further runs without saying so. Additionally (Delphi-version dependent), an editor repaint following a findings update can be re-interpreted as
Modified— edit/save paths can then re-trigger each other.
Suppression
Silence individual findings inline:
// noinspection MemoryLeak
list := TStringList.Create;

// noinspection NilDeref, DivByZero
DoSomethingRisky;

// noinspection All
// suppress every check on the next line
// noinspection-file MemoryLeak, NilDeref silences the named rules in the
whole file; in an .ini file the markers start with ;.
The name after noinspection is the kind name of the rule, as it appears
in the profile window and in DETECTORS.md (single source
of truth is KIND_META in uSCAConsts.pas). Common ones:
MemoryLeak, EmptyExcept, SQLInjection, HardcodedSecret,
FormatMismatch, FileReadError, UnusedUses, NilDeref,
MissingFinally, DivByZero, DeadCode, LongMethod, LongParamList,
MagicNumber, DuplicateString, HardcodedPath, DebugOutput,
DeepNesting, TodoComment, EmptyMethod, DuplicateBlock, All.
All does not cover HardcodedSecret, SQLInjection, CommandInjection,
DfmHardcodedDbCreds, DfmSqlFromUserInput, InsecureCryptoAlgorithm and
UnusedSuppression: these must be named explicitly.
Ownership transfer (no MemoryLeak warning)
These patterns are recognised as ownership hand-off and don't trigger a MemoryLeak finding:
| Pattern | Meaning |
|---|---|
Result := varName |
Function returns ownership to its caller |
varName.Parent := winControl |
VCL: TWinControl frees its Controls[] children |
varName := X.Add(...) |
Borrowed return — item lives in container's OwnsObjects list |
varName := X.AddChild(...) |
AST / DOM tree: child owned by parent |
varName := X.AddNode(...) |
TTreeView etc. |
varName := X.AppendChild(...) |
XML-DOM / IXMLNode |
FField := varName |
Var-to-field transfer — ownership leaves method scope |
FField := varName as ISomething |
Interface-refcount keeps the object alive |
inherited Create(varName, …) |
Parent constructor takes ownership |
TAnyClass.Create(varName, …) |
Another constructor takes ownership |
Container.Add(varName) |
TObjectList (etc.) takes ownership |
Container.Add(key, varName) |
TObjectDictionary takes ownership |
Container.AddObject(text, varName) |
TStringList with objects |
Container.Insert(i, varName) |
TList.Insert |
Container.Push(varName) |
TStack.Push |
Container.Enqueue(varName) |
TQueue.Enqueue |
For class fields, the FieldLeak detector additionally recognises the standard TComponent-owner pattern as no-leak:
| Pattern | Meaning |
|---|---|
FField := X.Create(Self) |
TComponent owner: inherited Destroy calls DestroyComponents |
FField := X.Create(AOwner) |
Owner forwarded from constructor parameter |
FField := X.Create(Owner) |
Owner taken from existing field/property |
Architecture
StaticCodeAnalyserIDE/                 IDE expert package; the release
                                       ships it as a package set
                                       (SCA.Engine.dpk + SCA.SharedUI.dpk +
                                       StaticCodeAnalyser.IDE.d12.dpk +
                                       reDelphix.d12.dpk)
  uIDEExpert.pas                       Wizard registration (IOTAMenuWizard)
  uIDEAnalyserForm.pas                 Dockable window (TFrame) - main shell:
                                       filters, stats grid, sort, export,
                                       Claude prompt copy, lifecycle sentinel
  uIDELineHighlighter.pas              3 px red stripe in the IDE editor
                                       gutter on the offending line
  uIDEMessages.pas                     Hand-off into the IDE Messages tab
  uIDEWatchMode.pas                    Single-file live watch (Current file)
                                       save 300 ms / edit 1000 ms debounced
                                       ?????? risky - see README
  uIDEEditorIntegration.pas            ToolsAPI wrappers: current .pas file,
                                       project dir, OpenFileAtLine
  uIDEStatusBar.pas                    Three-panel status bar
                                       (findings / progress / mode)
  uIDETheme.pas                        IDE-theme notifier + ApplyTheme refresh
  uIDEAnalyseProgress.pas              Busy-state controller
                                       (Begin/EndRun, Cancel-flag)

SCA.Engine/sources/                    Analysis engine (shared by standalone, IDE plugin and CLI)
  Common/
    uSCAConsts.pas                     TFindingKind + KIND_META single source
                                       of truth (Sonar category mapping)
    uMethodd12.pas                     TLeakFinding record + helpers
    uRegExMatches.pas                  shared regex helpers
    uDetectorUtils.pas                 IsIdentChar, IsWholeWord helpers
    uCollectValues.pas                 AST literal-value collection

    uAnalyserTypes.pas                 TFindingSeverity enum + conversions
    uLocalization.pas                  Translation (_('…')), reads the .po files

  Parsing/
    uLexer.pas                         Tokeniser, watchdog (200k tokens)
    uParser2.pas                       Recursive-descent parser with
                                       forward-progress guarantee
    uAstNode.pas                       AST with FindAll / FindFirst lookup

  Infrastructure/
    uStaticAnalyzer2.pas               Orchestrates the ~160 Pascal detectors per file
    uStaticFiles.pas                   Recursive file scan, tick callback,
                                       cancel support, symlink protection
    uIgnoreList.pas                    ignore.txt + test filter
    uVcsChanges.pas                    Git/SVN diff via CreateProcess + pipe
    uRepoSettings.pas                  analyser.ini (BaseBranch, exe paths)
    uSuppression.pas                   // noinspection markers
    uExport.pas                        JSON / CSV / Jira / clipboard
    uExportHtml.pas                    HTML report of the CLI
                                         (--report-html); also the home
                                         of the shared HTML helpers
    uFindingsWorkbenchExport.pas       Workbench findings report (GUI)
    uDetectorInfoExport.pas            Rule catalogue page
    uWorkbenchStyle.pas                Shared CSS + pinned-header
                                         behaviour (JS) of the workbench
                                         pages

  Output/
    uClaudePrompt.pas                  AI Markdown prompt generator
    uFixHint.pas                       Before/after example per finding type

  Detectors/
    uLeakDetector2.pas                 MemoryLeak (local-var, AST-based)
    uFieldLeak.pas                     Class-field leak (Create / Destroy)
    uCodeSmells2.pas                   EmptyExcept
    uSQLInjection.pas                  + uSQLInjectionScore.pas (scoring)
    uHardcodedSecret.pas, uHardcodedPath.pas
    uFormatMismatch.pas, uUnusedUses.pas
    uNilDeref.pas, uMissingFinally.pas
    uDivByZero.pas, uDeadCode.pas
    uLongMethod.pas, uLongParamList.pas
    uMagicNumbers.pas, uDuplicateString.pas
    uDuplicateBlock.pas
    uDebugOutput.pas, uDeepNesting.pas
    uTodoComment.pas, uEmptyMethod.pas
    uCustomClassDiscovery.pas          AutoDiscoverClasses helper
                                       (not a detector ??? feeds LeakyClasses)

SCA.SharedUI/sources/                  UI pieces shared by EXE and IDE plugin
  uAnalyserPalette.pas                 Central colour constants
  uAnalyserTheme.pas                   SeverityBg, SeverityAccent, BlendColor
  uFindingGridRenderer.pas             StringGrid OnDrawCell logic
  uFindingFilter.pas                   Severity/type/search filter pipeline
  uExportMenu.pas                      Export dropdown (JSON/CSV/HTML/
                                       Sonar/Jira/rule catalog)
  uRecentPaths.pas                     recent.ini handling
  uIDEStatsTiles.pas                   Sonar-style tile row builder
  uIDEHelpPanel.pas                    Right-side help panel with before/after,
                                       auto-hide when docked

StaticCodeAnalyserForm/sources/        Standalone front-end
  UI/                                  Forms, options dialog, panels
  Console/uConsoleRunner.pas           CLI (--path, --report-*, exit codes)

reDelphix/                             IDE package with the code actions,
                                       see reDelphix/README.md
Data flow
File ??? Lexer ??? Parser2 ??? AST (TAstNode)
                            ???
                            ????????? detectors run one by one (try/except per detector)
                            ???       each emits TLeakFinding
                            ???
                            ????????? TSuppression strips noinspection markers
                                        ???
                                        ????????? TObjectList<TLeakFinding>
                                                ???
                                                ????????? PopulateFindings ???
                                                    Stat cards + grid + export
Performance
For a typical 1 000-unit repository:
| Phase | Per file | 1 000 files |
|---|---|---|
| Folder scan | — | 1–3 s |
| Lexer | ~5–15 ms | ~10 s |
| Parser2 | ~10–50 ms | ~30 s |
| ~160 Pascal detectors | ~10–60 ms | ~50 s |
DFM parser + 23 DFM detectors (per .dfm) |
~5–20 ms | ~5–10 s |
| Suppression sweep | — | <1 s |
| Total | ~30–100 ms | ~60–90 s |
For incremental re-scans, use Branch-Changes instead of a full scan — typically 200 ms to 3 s. See BRANCH_CHANGES.md.
Robustness
- Watchdog: 200k-token limit per file — pathological inputs are aborted in under a second instead of hanging.
- GuardAdvance: forward-progress guarantee in every outer parser loop.
- Real-world Delphi syntax coverage: the parser handles
interfacetype declarations, generic types/methods (TFoo<T>,function Get<T>: T;),packed record/packed class, locallabelsections,record helper for X/class helper for X, and IFDEF-conditional method headers without losing method bodies — important for real-world codebases (mORMot2, etc.). MaxFileMB(default 5 MB): oversized files are reported immediately asFileError. Configurable inanalyser.ini.- MAX_DEPTH = 32: protection against symlink loops.
- Cancel any time:
EAbortpropagates cleanly through every layer. - Per-detector try/except: a crashing detector never blocks any of the other 161.
Test projects
StaticCodeAnalyserForm/tests/
  TestProject.dpr                      DUnitX runner
  uTest<DetectorName>.pas              one file per detector, 284 files
                                       in total ??? about 5,770 tests across
                                       about 350 fixtures (counted in the
                                       source, not from a run)
  uTestFindingHelper.pas               shared harness (FindingsOf /
                                       FindingsOfFile / FindingsViaPipeline)
  uTestTAstNode.pas                    AST helper tests
  uTestPerformance.pas                 throughput benchmarks
                                       (tokens/ms, lines/ms)
Tests run on DUnitX. Debug and Release builds are console runners that
emit an NUnit XML report for CI; only the build configuration
TestInsight defines TESTINSIGHT, see HowTo_Tests.md.
Pick the harness deliberately: FindingsOf drives the AST detectors,
FindingsOfFile is required for detectors that read source lines, and
FindingsViaPipeline runs the full production path including profile,
severity, suppression and confidence filters — that is what a user
actually sees.
Requirements
- Delphi 12 (Athens), versions 12.0–12.3 (32-bit IDE, BDS 23.0), and
Delphi 13 (Florence, BDS 37.0) with both its 32-bit and 64-bit
IDE. Delphi 12 has no 64-bit IDE — it ships
designidefor Win32 only, so a 64-bit design-time package cannot even be built there. Delphi 11 and older are not supported. - DUnitX (only for the test suite, not for the plugin itself);
TestInsight optionally, only for the
TestInsightbuild configuration of the test projects, see HowTo_Tests.md - Optional: Git for Windows or TortoiseSVN with CLI tools for the Branch-Changes feature
Build targets
| Target | Win32 | Win64 |
|---|---|---|
IDE plugin (StaticCodeAnalyser.IDE.d12.dpk) |
✅ required | ✅ under Delphi 13 only — a design-time package inherits the bitness of its IDE, and only Delphi 13 has a 64-bit one. Under Delphi 12 a Win64 build fails on the missing designide; the .dpk catches that with a readable message |
Standalone EXE / CLI (StaticCodeAnalyser.d12.dproj) |
✅ | ✅ |
Test suite (TestProject.dproj) |
✅ | ✅ |
reDelphix (reDelphix.d12.dpk) |
✅ | ✅ under Delphi 13 only, like the IDE plugin |
The standalone EXE compiles cleanly for both Win32 and Win64 —
both targets pass through the same detector engine and emit the
same SARIF/JSON/CSV/HTML reports. Choose Win64 if you want a
larger heap (relevant only on multi-GB scans).
Component overview
| Component | Path | Purpose |
|---|---|---|
| Standalone EXE | StaticCodeAnalyserForm/StaticCodeAnalyser.d12.dproj |
Folder/file scan outside the IDE |
| IDE plugin | StaticCodeAnalyserIDE/StaticCodeAnalyser.IDE.d12.dpk (package set with SCA.Engine.dpk + SCA.SharedUI.dpk, the same in dev and in a release) |
Main feature — dockable tool window with the full feature set |
| reDelphix | reDelphix/reDelphix.d12.dpk (part of the package set, always installed with the plugin) |
Quick fixes and refactorings in the editor |
Standalone EXE and IDE plugin share the analysis engine in SCA.Engine/sources/.
Documentation
docs/index.md is the map of the main documents, grouped by what you are trying to do. The four you are most likely to need:
| File | Content | When to consult |
|---|---|---|
| README.md | Overview — what the plugin does, how to use it, architecture, performance, suppression, theme integration | Default starting point |
| EXPORTS.md | Every export format — SARIF, Sonar, HTML, CSV, JSON, baseline — with the workflow each one serves and the CLI switches that drive it | When you want findings out of the tool: CI gate, code review, ticket system, spreadsheet |
| DETECTORS.md | Canonical detector list — every rule with status (✅ implemented / 🟡 partial / 🔲 open), description and the responsible unit | When you want to know which rule is implemented, what exactly it checks, or which detector is up next |
| BRANCH_CHANGES.md | VCS / Branch-Changes feature — how the Branch-Changes button works, Git/SVN setup, Tortoise compatibility, analyser.ini configuration, troubleshooting for repo detection |
When the Branch-Changes button isn't doing what you expect, or you want to fine-tune the VCS setup |
Per-rule pages (what a finding means and how to fix it) live under docs/rules/; the catalogue with severities is docs/rules.md.
Convention: README.md is broad, the specialised files are deep. Whenever
a section in the README grows too large, it gets moved into its own file
(which is exactly what happened with the Branch-Changes content).
🇩🇪 German versions carry a _de suffix: README_de.md,
EXPORTS_de.md, DETECTORS_de.md,
BRANCH_CHANGES_de.md
🇫🇷 French versions carry a _fr suffix: README_fr.md,
EXPORTS_fr.md, DETECTORS_fr.md,
BRANCH_CHANGES_fr.md
Related projects and alternatives
If you are evaluating this project, you may also be looking at:
- SonarQube / SonarLint — language coverage is broad but Delphi / Object Pascal is not supported out of the box. This project is the closest "Sonar feel" you can get for Delphi without writing a Sonar plugin yourself. Same five categories (Bug / Vulnerability / Security Hotspot / Code Smell / Code Duplication), same quality-score idea, SARIF export for GitHub Code Scanning.
- FixInsight (CodeHealer) — commercial, IDE-integrated. This project is a free, open-source FixInsight alternative with comparable detector coverage on Pascal plus a dedicated DFM scanner that FixInsight does not ship.
- Pascal Analyzer (PAL) — commercial. Overlapping detector set, but no DFM-aware checks, no Claude AI hand-off, no SARIF.
- DFMCheck / GExperts DFM-Check — single-purpose DFM linters. The 23 DFM detectors in this project are a superset (graph-based cross-form analysis, repo-wide form index, Pascal-AST coupling).
- DCC32 hints / warnings — built-in compiler diagnostics. Useful but limited to syntactic and trivially-semantic checks; no taxonomy, no AST queries, no security category.
Keywords
Delphi static code analysis, Object Pascal linter, RAD Studio plugin, Delphi 12 Athens, Delphi 13 Florence, Delphi IDE plugin, ToolsAPI, DFM analyzer, form file linter, Pascal AST, SonarQube alternative for Delphi, FixInsight alternative, Pascal Analyzer alternative, Delphi memory-leak detector, SQL injection detector for Delphi, hardcoded secret scanner, Delphi code smell, Delphi code duplication, McCabe complexity Delphi, SARIF Delphi, Branch-Changes incremental scan, Git diff Delphi, SVN diff Delphi, Claude AI prompt, Delphi code review automation, TADOQuery security, TFDQuery security, TClientDataSet provider chain, TDataSetProvider audit, master-detail circular detection, dead event handler detection, untranslated Caption detector, dxgettext audit, TEdit.Text SQL injection, hardcoded DB credentials in DFM, Pascal lint CI/CD, GitHub Actions Delphi SARIF, pre-commit hook Delphi.
License
This project is released under the MIT License — see LICENSE for the full text.
Copyright (c) 2026 Nicolas GerlachIn short:
- ✅ Free to use, copy, modify, merge, publish, distribute and sublicense
- ✅ Free for commercial use
- ✅ No warranty — the software is provided "as is"
- ℹ️ The copyright notice and the license text must be kept in copies or substantial portions of the software
- ⚠️ Not covered: the dark VCL style (
SCADark.vsf,sca_styles.RES) is a modified Embarcadero style and stays under the RAD Studio license terms, see LICENSE
Support
Donate link is at the top of this README — thanks!