

Catalog · How the catalog works
Delphi-Dependency-Visualizer

- ★ 11 on GitHub
Anyone may press Interesting, signed in or not. It helps others find this project.
README
Delphi Dependency Visualizer
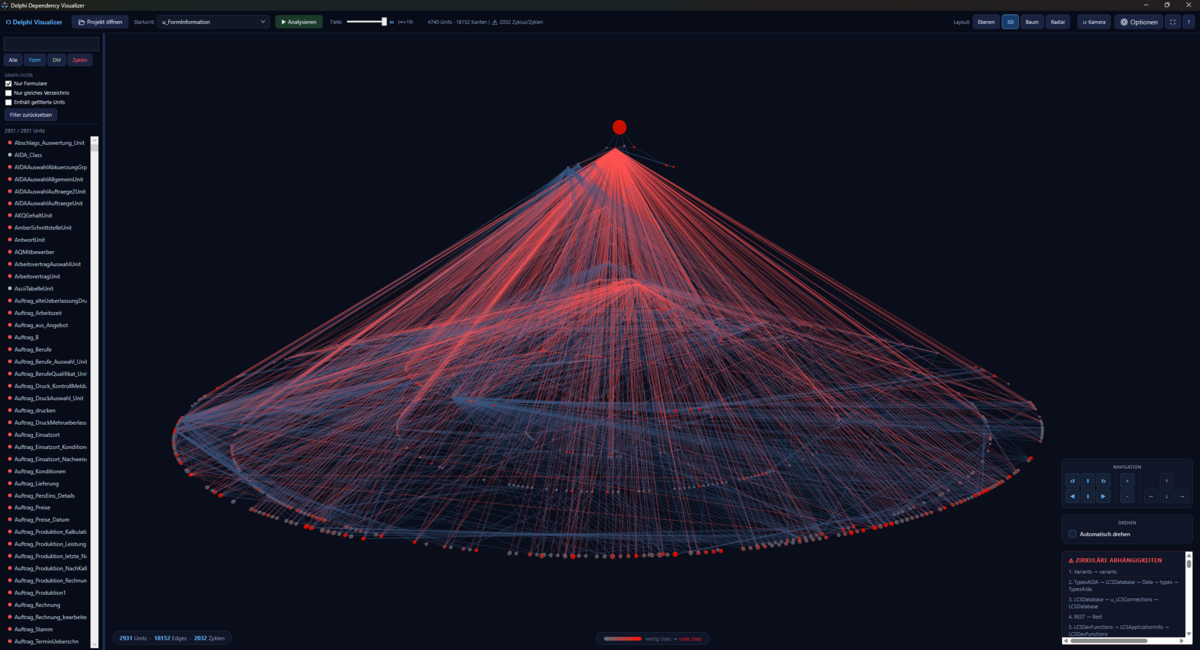
Interactive 3D visualization of Delphi unit dependencies. Analyzes .dpr projects and renders the dependency graph in a navigable 3D view — including circular dependency detection and heatmap coloring.
Features
- 4 layout modes — Layered, 3D Force, Tree, Radial
- Heatmap coloring — units with many dependencies glow red
- Circular dependency detection — listed and highlighted
- Filters — show only Forms, DataModules, or cyclic units
- Adjustable depth — limit analysis to N levels
- Self-contained — no .NET installation required
Requirements
- Windows 10 / 11 (x64)
- WebView2 Runtime (pre-installed on Windows 11)
Installation
Download the latest installer from Releases and run it. No admin rights required.
Usage
- Click Open Project and select a
.dprfile (or a.gv/.dotfile exported by the Delphi 12+ compiler switch--graphviz) - Choose a start unit and analysis depth
- Click Analyse
- Navigate with mouse: rotate, zoom, click nodes for details
Sample project
A bundled demo project ships in SampleProject/AcmeERP/ (also installed next to the
executable). It is a synthetic ~520-unit Delphi application (50 feature modules of
10 units each) with a mega-hub main form, cross-cutting utility units and ~70 cycles
— including uAppContext, which every form uses and which itself pulls in the main
form, so fMain and all forms form one big strongly-connected component. Enough to
exercise every layout, the heatmap and the progress bar without pointing at your own source.
AcmeERP.dpr— full parser path; start unitfMain, depth ∞AcmeERP.gv— same graph in Delphi 12--graphvizformat (compiler-resolved edges)
Build from source
build.batRequires .NET 8 SDK.