

Toro Kernel
A dedicated kernel for multi-threading applications
Introduction
This wiki presents how to debug an application that is built with Toro and executes as a QEMU guest in Windows. This procedure however does not work for applications that are deployed as KVM-QEMU guests. In that case, the built-in gdbstub that is included in QEMU does not work correctly as it is unable to catch breakpoints or do step-by-step execution. To debug an application that is deployed as a KVM-QEMU guest, please follow the tutorial at https://github.com/torokernel/torokernel/wiki/How-to-Debug-the-Kernel-and-the-Application-in-Toro.
On Windows
It's possible to develop Toro Kernel microservices on Windows.
Building
- you'll need to have cross-compile linux binary utils
those could be acquired from fpcup or fpcupdeluxe (https://github.com/LongDirtyAnimAlf/fpcupdeluxe/releases/download/crosslibs_v1.1/CrossLibsLinuxx64.zipp
- you can find a tutorial about how to get a cross-compiler in 1
- the project contain "build" utility complication as well. The utility produces an image from the resulting .elf file
Running QEMU
- install QEmu for Windows
- run the system specifying the built image
qemu-system-x86_64 -hda HelloWorldMicroservice.img- on start qemu can complain about unknown or raw format of ".img" file.
One might find the script files to build the Qemu recognizable image file formats: BuildVHDX.cmd and/or BuildVMDK.cmd
From Lazarus as Hosting Application
Lazarus can be configured to run QEmu as a hosting or launching application. Typically such approach is used for developing libraries, rather than virtual machines. Yet, the approach could be used for the virtual machine as well. While it works, it does introduce some difficulties when debugging is needed.
Open Run->Run Parameters... and specify QEmu as the host application.
On the command-line parameters specify -hda parameter, that should point to the produced image file.
Normally this would be an output file with .img extension.
[[Image:torokernel_run_params.png]
From Lazarus as External Tool
Another approach is to launch from IDE QEmu manually as an External Tool.
The approach is semi-automatic, yet it's friendly with the remote debugging capabilities (which are covered below)
To create an external tool, click Tools->Configure External Tools.... (if there are some other tools configured you need to click "Add")
On the new dialog, the similar information regarding QEmu needs to be provided:
- the qemu executable
- a parameter -hda specifying the target image file
- additional parameters (i.e. network configuration)
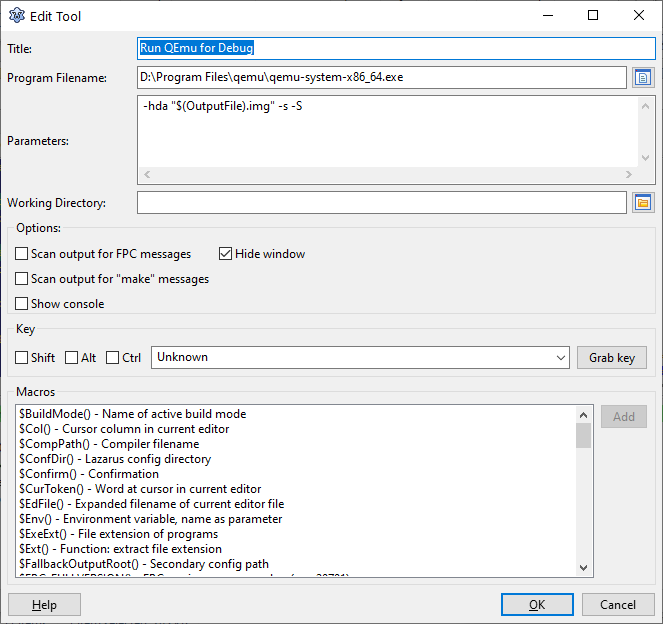
Once the external tool configuration has been saved. The new section is added under "Tools" menu.
The execution can be invoked by either selecting the menu or assigning hot key combinations.
Debugging
QEmu provides a built-in support for GDB remote debugging.
Remember, the debugging information must be enabled in the Project Options. It's recommended to use the EXTERNAL debug symbol file (-Xg) to keep the executable and the actual file image in a small size.
Manual
- run QEmu with enabling gdb (-s) and also requesting the QEmu to halt until getting the "continue" signal from gdb (-S)
qemu-system-x86_64 -s -S -hda HelloWorldMicroservice.imgThe expected result is that Qemu window will halt with the message that "vga" system has not been initialized yet (and doing nothing)
-s - configures the default remote GDB mode for the use of TCP socket for port 1234
- run the debugger, and provide the previously complied binary file as its gdb target. (The file is needed to load debugging information)
gdb HelloWorldMicroservice- after that run the remote target command
(gdb)> target remote localhost:1234The command makes gdb connect to the specified address. In which case this would be Qemu running locally at port 1234.
- setup the debugging information (i.e. breakpoints, etc)
The debugging information in the compiled binary contains the information necessary to work with binary during debugging.
Example
(gdb)> b HelloWorldMicroservice.pas:250sets a breakpoint HelloWorldMicroservice at the line that outputs "ToroService: listening on port xxxx ..."
- "continue" the process.
(gdb)> continueFrom Lazarus IDE
It's possible to use Gdb with Lazarus IDE to debug remote applications.
The Lazarus IDE handles the debugger in 2 possible ways:
- By default Lazarus attempts to launch the debugger first, and let debugger launch the debugged application.
- For remote debugging the remote application is expected to be launched outside of Lazarus IDE project run flow:
How to launch the process to be debugged for remte debugging depends on the version of Lazarus:
- for the trunk version of lazarus, see the explanation in the section below on init exec.
- For the released (2.0.x) version of lazarus the method is explained here. This method can of course still be used in trunk.
In both cases, the most important thing to remember is to have
-s
-S
parameters added to the Qemu command line. (as described above "-s" configures the network port for GDB, while "-S" makes sure QEmu would wait for the debugger to connect)
The "debugger" needs to be configured as following.
- type should be set to (gdbserver)
- executable should be the same as the Lazarus supplied gdb.exe.
- Debugger_Remote_HostName should be set to "localhost" (you are running Qemu locally)
- Debugger_Remote_Post should be set to 1234. (This is dictated by "-s" parameter passed to QEmu)
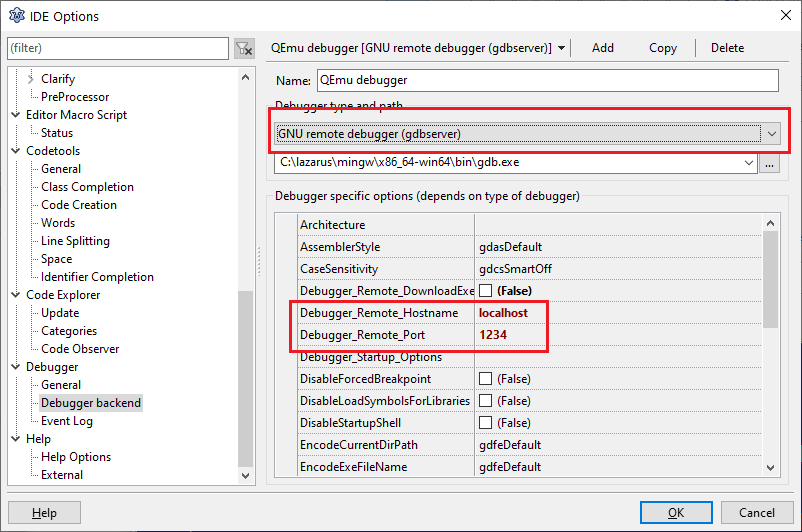
Start Qemu As External Tool
Run the QEmu via configured "External Tool" (or manually). When ran you should see "Guest has not initialized the display (yet)". That means that Qemu is waiting for the debugger to connect. 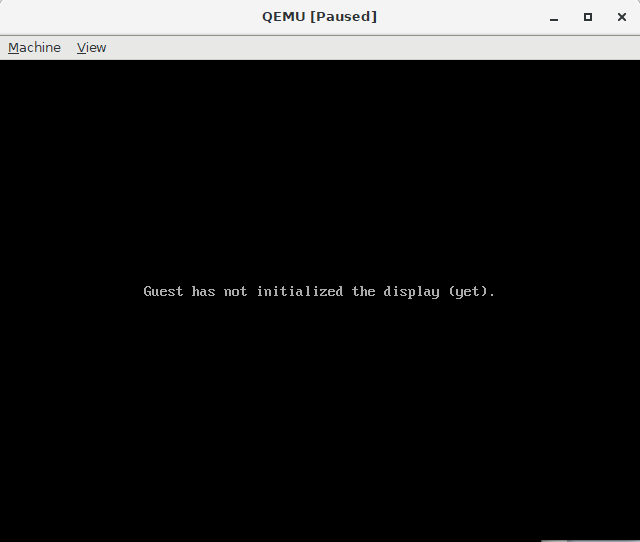
IMPORTANT - make sure that "Run Parameters" don't have Host Application or Launch Application configured. If they're configured it will prevent the debugger from loading proper symbol files and will prevent the debugging.
Hit "Run" project (F9) in Lazarus IDE.
With the gdb connected to the QEmu you should see the services run as they should.
Lazarus IDE will allow you to set the breakpoints, inspect variables and callstack as needed.
In order to terminate the QEmu process one should either close QEmu window or press "Alt+Ctrl+Q". 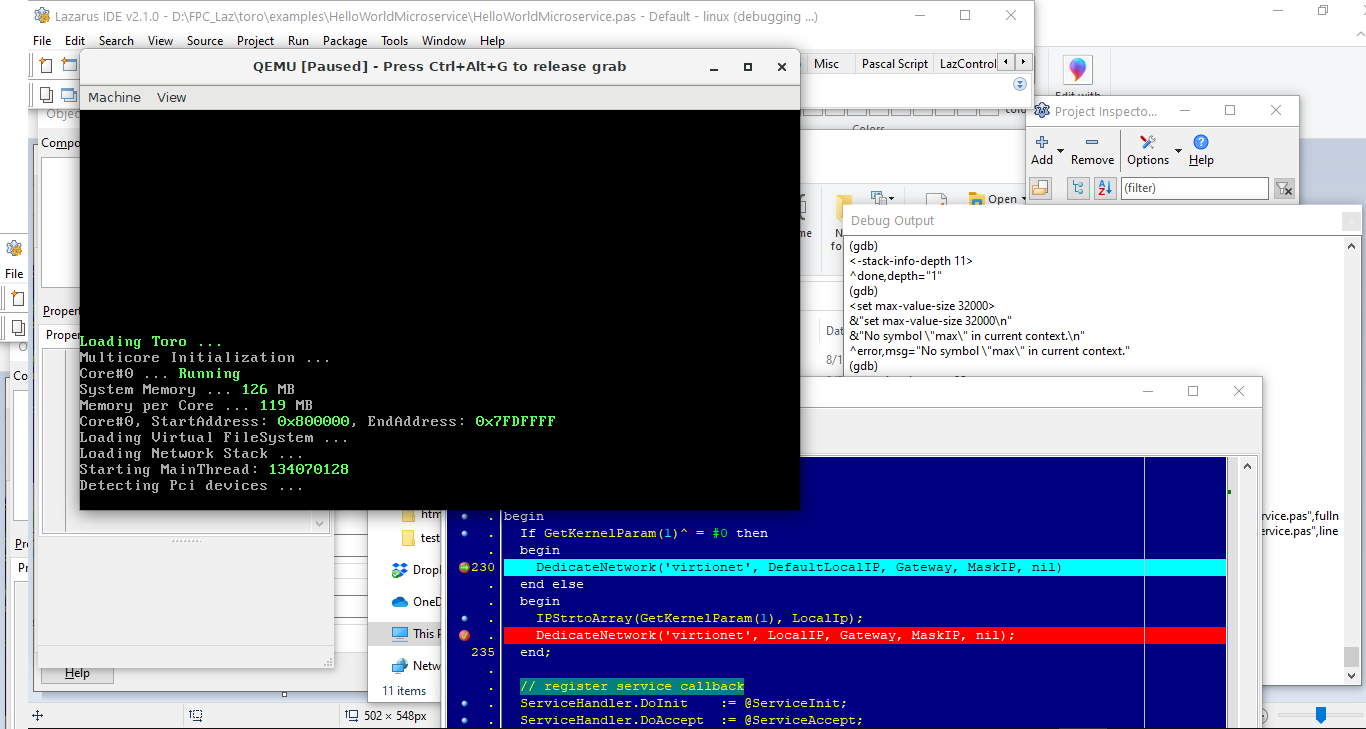
Using Init Exec of Remote Debugger
In Lazarus trunk there's an extension of gdbserver available, that allows to run QEmu automatically.
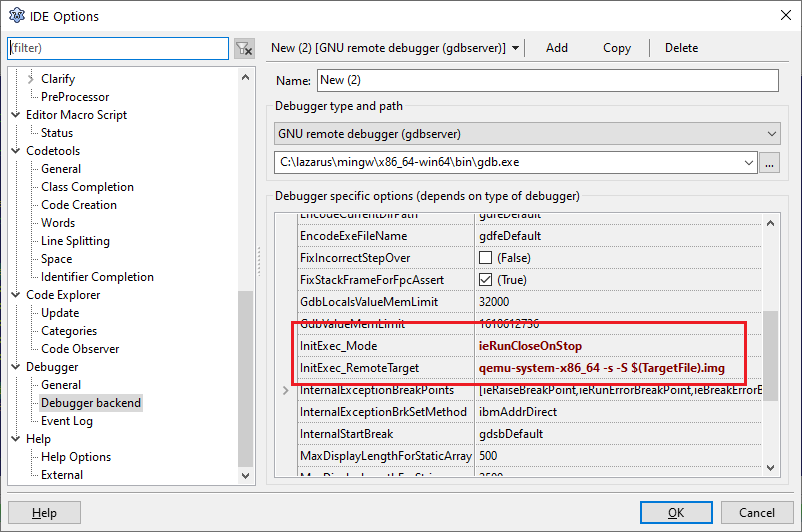
Two additional options were added and should be configured in the following manner:
- InitExec_Mode = ieRunCloseOnStop (starts QEmu and closes when the debugging is done)
- InitExec_RemoteTarget = the command line that would open up QEmu PRIOR to the debugger trying to connect.
See also
- https://github.com/torokernel/torokernel - source code
- https://torokernel.io - the official website
- https://www.qemu.org/download/#windows - QEmu Windows download
- https://github.com/torokernel/torokernel/wiki/How-to-Debug-the-Kernel-and-the-Application-in-Toro - Debugging of Toro Appliances
From the Free Pascal wiki, page "Toro Kernel", as it stood on 2021-03-14 after a change by Trev, out of the wiki's dump of 2024-05-26. Copyright stays with the author who wrote it, according to the old wiki's Licensing page. If you have concerns about this material, message the admin.
Talk about this page
Nobody has opened a bench for this page yet. Sign in to open one.