

TChart: what changed
Revision 1 to 2. Removed lines have a minus sign; added lines have a plus sign.
| Old | New | Line | |
|---|---|---|---|
| 1 | 1 | **TChart**  is a component that can draw various kind of graphs and charts on screen. It is part of the [[TAChart]] package and is available under the [[Chart tab]] of the [[Component Palette]]. More information about usage of TChart can be found at the [[TAChart Tutorial: Getting started]] | |
| 2 | 2 | ||
| 3 | - | ||
| 4 | - | ||
| 5 | - | ||
| 6 | - | ||
| 3 | + | 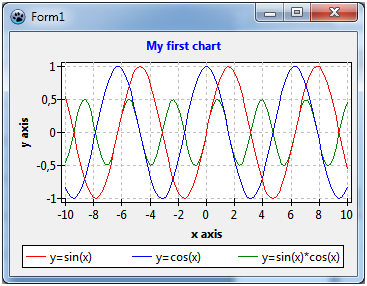 | |
| 7 | 4 | ||
| 8 | 5 | --- | |
| 9 | 6 | *From the Free Pascal wiki, page "TChart", as it stood on 2017-10-06 after a change by E-ric, out of the wiki's dump of 2024-05-26. Copyright stays with the author who wrote it, according to the old wiki's [[Licensing]] page. If you have concerns about this material, [message the admin](/wiki-contact).* |