

TAChart documentation: what changed
Revision 1 to 2. Removed lines have a minus sign; added lines have a plus sign.
| Old | New | Line | |
|---|---|---|---|
| 1 | 1 | ## Overview | |
| 2 | 2 | ||
| 3 | 3 | [[TAChart]] is a package for drawing graphs, charts and other diagrams. It is [[Comparing TAChart with Delphi&|comparable in features]], but not specifically compatible, with Delphi's TeeChart package. One substantial difference is that some features (e.g. data sources and axis transformations) are implemented via separate components instead of through simple chart properties. This design gives increased flexibility and opportunity for code re-use, but at the cost of a slightly more complex API. | |
| 4 | 4 | ||
| 5 | 5 | This document provides a concise but comprehensive overview of TAChart concepts, features and components. For a step-by-step introduction, see [[TAChart Tutorial: Getting started]] and [[TAChart|other tutorials]]. | |
| 6 | 6 | ||
| 7 | 7 | The documentation describes the TAChart package as found in the latest development version of Lazarus. Some features may not yet be available in the official Lazarus release version. We recommend that you use this latest document version because it has corrected and improved older descriptions in previous versions, as well as the fact that it includes details about the newest features. | |
| 8 | 8 | ||
| 9 | 9 | Nevertheless, you can look at the \[ the old version\] of this document to see the state of the documentation around the time of the Lazarus 1.0 release. | |
| 10 | 10 | ||
| 11 | 11 | ## Series | |
| 12 | 12 | ||
| 13 | 13 | 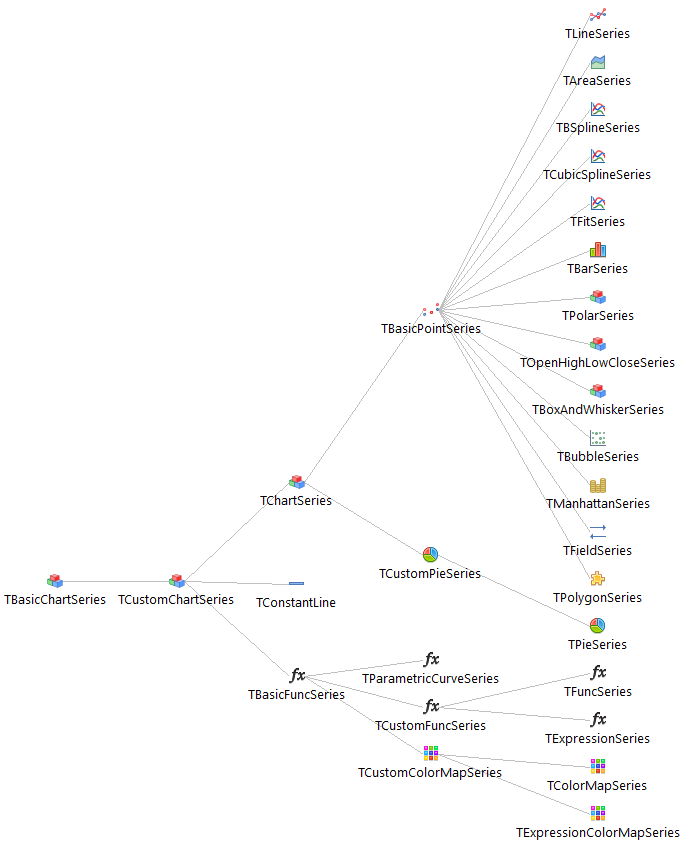Series are the central part of TAChart. Their hierarchy is illustrated in the figure. The series inheriting from TCustomChartSeries represents data taken from a ChartSource in graphical ways, such as lines or bars; the other series get their data in another way. | |
| 14 | 14 | ||
| 15 | 15 | ### Constant line series | |
| 16 | 16 | ||
| 17 | 17 | This is the simplest series type, representing an "infinite" vertical or horizontal line. It can be used as a "central axis" in function graphs, or as a draggable marker line. | |
| 18 | 18 | ||
| 19 | 19 | Also, by setting `Active`=true, `Pen.Style=psClear` and `UseBounds=true` and an appropriate `AxisIndexX`, it becomes an "axis extender", making sure that a given `Position` will always be included in the axis range. | |
| 20 | 20 | ||
| 21 | 21 | ### Basic series | |
| 22 | 22 | ||
| 23 | 23 | Basic series are most often used, and include line, bar and area series. All basic series can be "stacked" by using multi-valued source. Also, all basic series fully support rotation and 3-D drawing. | |
| 24 | 24 | ||
| 25 | 25 | #### Line series | |
| 26 | 26 | ||
| 27 | 27 | `TLineSeries` can be used to draw a given set of points, optionally marking each data point with a symbol and/or connecting the data points with a line. The color of the line series is defined by the `SeriesColor`. | |
| 28 | 28 | ||
| 29 | 29 | `ColorEach` gives control over coloring inidividual data points and the adjacent line segments (the data point color is provided by the chart source): | |
| 30 | 30 | ||
| 31 | 31 | - `ceNone` -- no individual coloring, even if colors are assigend to the chart data item. | |
| 32 | 32 | - `cePoint` -- colorize only the data point symbol, not the line segment. | |
| 33 | 33 | - `ceLineAfter` -- apply the data point color to the line segment following the data point | |
| 34 | 34 | - `ceLineBefore` -- apply the data point color to the segment before the data point | |
| 35 | 35 | - `cePointAndLineAfter, cePointAndLineBefore` -- like before, but colorizes also the data point symbol. | |
| 36 | 36 | ||
| 37 | 37 | You can get a "stepped" look by setting `LineType` property to `ltStepXY`, `ltStepYX`, `ltStepCenterXY` or `ltStepCenterYX`. | |
| 38 | 38 | ||
| 39 | 39 | Using a multi-valued data source `TLineSeries` can handle several y values for each x value. If `Stacked` is set to `true` then the individual y values are plotted in a stacked way, i.e., the second y value is added to the first one, the third y value to the second value etc. Note, however, unlike stacked bar or area series it may not be clear that the data values are stacked, and therefore stacking is usually not recommended for a line series. | |
| 40 | 40 | ||
| 41 | 41 | ##### Fast lines | |
| 42 | 42 | ||
| 43 | 43 | Some charting packages include a special "fast line" series to quickly draw line series from extremely large datasets (10000+ points). TAChart, by contrast, contains an optimized fast path inside standard line series code, which achieves comparable drawing speed. A line series will be drawn very fast if all of the following are true: | |
| 44 | 44 | ||
| 45 | 45 | - There are no marks. | |
| 46 | 46 | - There are no pointers. | |
| 47 | 47 | - `LineType` is not `ltFromOrigin`. | |
| 48 | 48 | ||
| 49 | 49 | Some operating systems/widgetsets may additionally require that `LinePen.Style=psSolid` and `LinePen.Width=1` and `LinePen.Cosmetic=true`. | |
| 50 | 50 | ||
| 51 | 51 | Additional speedups will be available if `Source.Sorted=true`, and if `AxisIndexX` and `AxisIndexY` are `-1` (i.e. if no axis transformations are applied). | |
| 52 | 52 | ||
| 53 | 53 | You can measure line speed drawing on your platform with the "line" demo. | |
| 54 | 54 | ||
| 55 | 55 | ##### Point series | |
| 56 | 56 | ||
| 57 | 57 | `TLineSeries` can be drawn as a "point series" showing only symbols at the position of the data points and hiding the connecting lines by setting `ShowPoints` to `True` and `LineType` to `ltNone`. Note that the `SeriesColor` applies only to the connecting lines; to specify the color of the points change the `Pointer.Brush.Color` for the fill and/or `Pointer.Pen.Color` for the border line color. The `Pointer` property also gives access to the shape (circle, box, etc) of the symbols (`Style`). | |
| 58 | 58 | ||
| 59 | 59 | #### Bar series | |
| 60 | 60 | ||
| 61 | 61 | `TBarSeries` represents data as a set or bars, extending from `ZeroLevel` to data points. | |
| 62 | 62 | ||
| 63 | 63 | You can control bar width with `BarWidthPercent` property. Note that the it is measured relative to the neighboring bars. If the X values are not equidistant, bars will have varying width. To prevent that, set `BarWidthStyle=bwPercentMin`. | |
| 64 | 64 | ||
| 65 | 65 | You can draw multiple bar series side-by-side by using `BarOffsetPercent` property. | |
| 66 | 66 | ||
| 67 | 67 | Use multiple y values to create stacked bar series (`Stacked = true`). Beginning with Lazarus v2.0 multiple y values can also be drawn in a side-by-side arrangement (`Stacked = false`). | |
| 68 | 68 | ||
| 69 | 69 | In addition to rectangular bars the data can be represented by alternative shapes: cylinder, hexagonal prism, pyramid or cone - see property `BarShape` which supports these values: `bsRectangular, bsCylindrical, bsHexPrism, bsPyramid, bsConical`. Furthermore, the event `OnCustomDrawBar` allows to paint the bars in any user-defined manner. | |
| 70 | 70 | ||
| 71 | 71 | #### Area series | |
| 72 | 72 | ||
| 73 | 73 | `TAreaSeries` represents data as a polygon extending downwards from the data points either to a `ZeroLevel` line or towards infinity (if `UseZeroLevel=false`). | |
| 74 | 74 | ||
| 75 | 75 | You can get a "stepped" look by setting the `ConnectType` property. | |
| 76 | 76 | ||
| 77 | 77 | Like `TBarSeries` and `TLineSeries`, an area series can accept several y values for the same x from a multi-valued data source. These y values are drawn in a stacked way if the property `Stacked` is set to `True` (its default value). Use a ChartStyles component to define the appearance of the individual layers. (Note that in Lazarus versions 1.8.x or older, ChartStyles do not colorize overlapping layers consistently). | |
| 78 | 78 | ||
| 79 | 79 | The property `Banded` (available in Lazarus v2.0+), if set to true, suppresses painting of the lowest stack level. This way a band of data values can be highlighted: use a chartsource with two y values and set the first y value to the lower and the second y value to the upper band level. Alternatively, the width of the band can be specified in the second y value if both properties `Banded` and `Stacked` are set to true. | |
| 80 | 80 | ||
| 81 | 81 | Multiple-y value support should be applied with caution: Stacking non-positive values may produce plots which are difficult to understand, and unstacked area series (`Stacked = false`) may suffer from data being covered by other y values. Also, the `ZeroLevel` should be included only in the lowest stack level to avoid unusual results. | |
| 82 | 82 | ||
| 83 | 83 | A 3D-like presentation of the series can be obtained if `Depth` is set to a positive value, something like 10 or 20. Note that the drawing algorithm is very simple and likely produces incorrect displays when curves cross, or stacking and banding are turned off. | |
| 84 | 84 | ||
| 85 | 85 | #### Polygon series | |
| 86 | 86 | ||
| 87 | 87 | `TPolygonSeries` draws a filled polygon defined by the points of the series. It is intended to be the basis of contour plots or GIS plots (earth maps). The series supports both single and multiple polygons. Single polygons are closed automatically. Multiple Polygons are created by closing a first polygon and simply adding the points of one ore more subsequent polygon(s); each contributing polygon must be closed. Such polygonare are useful to display disconnected "islands" or to display "holes" in an outer shape; in the latter case the points of inner and outer polygons must have opposite orientations. | |
| 88 | 88 | ||
| 89 | 89 | ### Multi-value series | |
| 90 | 90 | ||
| 91 | 91 | Multi-value series require a multi-valued data source, and use additional X and/or Y values as extra parameters to draw complex shapes. | |
| 92 | 92 | ||
| 93 | 93 | #### Bubble series | |
| 94 | 94 | ||
| 95 | 95 | `TBubbleSeries` represents data as circles of variable radius centered at data points. This series requires a source with `YCount` of at least 2, and uses the first additional Y value for the bubble size. | |
| 96 | 96 | ||
| 97 | 97 | Using the `BubbleRadiusUnits` property, the bubble radius can be mapped on the chart area in the following ways | |
| 98 | 98 | ||
| 99 | 99 | - `bruX`: Bubbles are drawn as circles and the radius units are the same as used on the x axis. | |
| 100 | 100 | - `bruY`: like `bruX`, but the bubble radius is measured on the y axis. | |
| 101 | 101 | - `bruXY`: Bubbles are drawn as ellipses, the radius is understood to have the x axis units horizontally, and the y axis units vertically. | |
| 102 | 102 | - `bruPercentageRadius, bruPercentageArea`: Bubbles are drawn as circles. The data defining the bubble size are interpreted as being relative to the bubble radius (`bruPercentageRadius`) or to the bubble area (`bruPercentage`). The bubble size is scaled such that the radius of the largest bubble has a percentage `BubbleRadiusPercentage` of the plot area size. | |
| 103 | 103 | ||
| 104 | 104 | Background and border of the bubbles are determined by `BubbleBrush` and `BubblePen`, respectively. But by means of the `OverrideColor` property the color of either interior or edge of each bubble can be changed individually to the color value stored in the chartsource. | |
| 105 | 105 | ||
| 106 | 106 | Since v3.99, the `Styles` property can be used to define all brush and pen parameters of bubbles indivudually. | |
| 107 | 107 | ||
| 108 | 108 | #### Box-and-whiskers series | |
| 109 | 109 | ||
| 110 | 110 | `TBoxAndWhiskerSeries` represents data as rectangles with a central line and two T-like shapes protruding in both directions. Although in statistics a [box-and whiskers plot](https://en.wikipedia.org/wiki/Box_plot) is supposed to be based on specific data quartiles, TAChart does not enforce this, allowing users to draw arbitrary plots. | |
| 111 | 111 | ||
| 112 | 112 | With some effort, box-and whiskers series may be used to represent other charts of different meaning but similar appearance, such as [Gantt diagrams](https://en.wikipedia.org/wiki/Gantt_chart). | |
| 113 | 113 | ||
| 114 | 114 | This series requires a source with `YCount` of at least 5, and uses Y values as follows: | |
| 115 | 115 | ||
| 116 | 116 | | Index | Usage | | |
| 117 | 117 | |-------|-----------------| | |
| 118 | 118 | | 0 | Lower whisker | | |
| 119 | 119 | | 1 | Lower box bound | | |
| 120 | 120 | | 2 | Central line | | |
| 121 | 121 | | 3 | Upper box bound | | |
| 122 | 122 | | 4 | Upper whisker | | |
| 123 | 123 | | | | | |
| 124 | 124 | ||
| 125 | 125 | Since Lazarus v2.3 a more flexible assignment of Y values to the parts of the box/whisker shape is possible by means of the properties `YIndexWhiskerMin`, `YIndexBoxMin`, `YIndexCenter`, `YIndexBoxMax` and `YIndexWhiskerMax`. Special combinations of Y values can be selected easily via the enumerated `YDataLayout` property: | |
| 126 | 126 | ||
| 127 | 127 | - **bwlLegacy**: above assignment running the Y values from the lower to the upper end of the shape (default) | |
| 128 | 128 | - **bwlNormal**: here the ordinary Y value has index 0; this makes it easier to reuse the same chart source in other series types. It is followed by the Y indices for whisker min, box min, box max and whisker max. This selection will become the default in later versions. | |
| 129 | 129 | - **bwlCustom**: uses the Y index values as defined by the `YIndex*` properties. | |
| 130 | 130 | ||
| 131 | 131 | #### Open-high-low-close series | |
| 132 | 132 | ||
| 133 | 133 | `TOpenHighLowCloseSeries` represents data as vertical lines with two ticks, as described [here](https://en.wikipedia.org/wiki/Open-high-low-close_chart). | |
| 134 | 134 | ||
| 135 | 135 | It usually requires `YCount` of at least 4, and uses Y values as follows: | |
| 136 | 136 | ||
| 137 | 137 | | Property | Default | Usage | | |
| 138 | 138 | |-------------|---------|----------------------------| | |
| 139 | 139 | | YIndexLow | 0 | Lower point of line | | |
| 140 | 140 | | YIndexOpen | 1 | Left-facing tick position | | |
| 141 | 141 | | YIndexClose | 2 | Right-facing tick position | | |
| 142 | 142 | | YIndexHigh | 3 | Upper point of line | | |
| 143 | 143 | | | | | | |
| 144 | 144 | ||
| 145 | 145 | Note that although Y values are supposed to be ordered ascending along the table above, the series does not enforce this and will draw any supplied data. | |
| 146 | 146 | ||
| 147 | 147 | #### Field series | |
| 148 | 148 | ||
| 149 | 149 | `TFieldSeries` displays a vector at each data point. The vector is drawn as a line segment with an optional arrow. By default, the line is centered at the x,y coordinates stored in the chart source, its direction is given by additional values stored in the XList and YList of the chart source. When property `VectorCoordKind` is switched to `vckStartend` the line is defined by start and end points directly. In total, this series type requires a source with two x and y values: | |
| 150 | 150 | ||
| 151 | 151 | | Source data item field | Usage | | |
| 152 | 152 | |----|----| | |
| 153 | 153 | | X | X coordinate of line center (or start point, if `VectorCoordKind = vckStartEnd`) | | |
| 154 | 154 | | Y | Y coordinate of line center (or start point) | | |
| 155 | 155 | | XList\[0\] | X coordinate of line direction (or end point, if `VectorCoordKind = vckStartEnd`) | | |
| 156 | 156 | | YList\[0\] | Y coordinate of line direction (or end point) | | |
| 157 | 157 | | | | | |
| 158 | 158 | ||
| 159 | 159 | The method `AddVector(x,y: Double; vectorx, vectory: Double; ALabel: String = ''; AColor: TColor = clTAColor)` helps to assign all values correctly to the internal list source. | |
| 160 | 160 | ||
| 161 | 161 | In order to avoid overlapping of vectors call the method `NormalizeVectors(ALength: Double)` to normalize their lengths such that the longest vector has the specified length. | |
| 162 | 162 | ||
| 163 | 163 | The arrow parameters are understood to be percentages of the vector length, i.e. the arrow becomes smaller for shorter vectors. | |
| 164 | 164 | ||
| 165 | 165 | ### Radial series | |
| 166 | 166 | ||
| 167 | 167 | Radial series ignore axis transformations. You can see examples of radial series in the "radial" demo. | |
| 168 | 168 | ||
| 169 | 169 | #### Pie series | |
| 170 | 170 | ||
| 171 | 171 | `TPieSeries` draws pie charts. | |
| 172 | 172 | ||
| 173 | 173 | For each data point, the pie series interprets the Y value as relative size of the slice, and the X value as the distance of the slice from the center of the pie, relative to the pie radius (only if `Exploded` property is true). | |
| 174 | 174 | ||
| 175 | 175 | Beginning at `StartAngle`, the pies run in counter-clockwise direction around the circle. When `AngleRange` is at its default of 360 the pies cover the full circle; a smaller value allows to use the circle only partially. | |
| 176 | 176 | ||
| 177 | 177 | The pie radius can either be set manually by the `FixedRadius` property, or be calculated automatically so that the whole series, including all labels, exactly fits the parent chart. | |
| 178 | 178 | ||
| 179 | 179 | A ring can be painted instead of a pie slice by giving the property `InnerRadiusPercent` a value greater than 0, but smaller than 100 - this determines the radius of the inner circle as percentage of the total radius. | |
| 180 | 180 | ||
| 181 | 181 | The slice colors are determined by either the data items' `Color` field or a hard-coded palette. Slice contours are drawn using the `EdgePen` property. Since v3.99, all brush and pen parameters can be controlled individually for each slice by means of the Styles property. | |
| 182 | 182 | ||
| 183 | 183 | There are several options for label positioning, controlled by the `MarkPositions` property: | |
| 184 | 184 | ||
| 185 | 185 | - `pmpAround` -- marks are drawn outside the pie, on the continuation of the radius vector for each slice | |
| 186 | 186 | - `pmpInside` -- marks are drawn inside each slice | |
| 187 | 187 | - `pmpLeftRight` -- marks are drawn directly to the left or to the right of slice | |
| 188 | 188 | ||
| 189 | 189 | `MarkDistance` defines the distance between the marks starting point and the label. The starting point is defined by `MarkPositionCentered` to be either the pie perimeter (`false`) or center (`true`). `MarkDistancePercent`, if set to `true`, interprets `Marks.Distance` as percentage of the pie radius. Otherwise it is in image units. | |
| 190 | 190 | ||
| 191 | 191 | If `RotateLabels` is true, each label is additionally rotated so that (if `LabelFont.Orientation=0`) it is parallel to the radius vector of its slice. | |
| 192 | 192 | ||
| 193 | 193 | If the Y value of a data item is set to NaN, the item is skipped. If the X value is set to NaN, the item is not drawn, but the space for it is still reserved. This allows drawing of "partial" pie diagrams. | |
| 194 | 194 | ||
| 195 | 195 | Pie charts have limited support for 3-d drawing. The property `Depth` determines the thickness of the pie. `Orientation` supplements the normal view (`poNormal`) with an oblique view of the reclined (`poHorizontal`) and upright (`poVertical`) pie series, the latter two being controlled by property `ViewAngle` in degrees between 0 and 89. Since TAChart does not implement a true hidden line/hidden area algorithm there may be some chance of drawing artifacts for some combinations of parameters, in particular when `AngleRange` is not `360`. A slight change of `StartAngle` and/or `AngleRange` usually helps to fix this issue. | |
| 196 | 196 | ||
| 197 | 197 | #### Polar series | |
| 198 | 198 | ||
| 199 | 199 | `TPolarSeries` represents data as points in [polar coordinates](https://en.wikipedia.org/wiki/Polar_coordinate_system). | |
| 200 | 200 | ||
| 201 | 201 | The origin of the polar coordinate system is defined in graph coordinates by `OriginX` and `OriginY` properties. | |
| 202 | 202 | ||
| 203 | 203 | For each data point, X value is interpreted as an angle in radians and Y value -- as a distance from the center. | |
| 204 | 204 | ||
| 205 | 205 | The TPolarSeries does not support axis transformations. | |
| 206 | 206 | ||
| 207 | 207 | Some additional properties: | |
| 208 | 208 | ||
| 209 | 209 | - `CloseCircle`: If true the last point is connected with the first one. | |
| 210 | 210 | - `Filled`: If true the polygon of the series points is filled using the current `Brush`. If `CloseCircle` is false the fill goes to the origin. | |
| 211 | 211 | - `ShowPoints`: If true then the series pointer is drawn at the position of each data point. | |
| 212 | 212 | ||
| 213 | 213 | ### User-drawn series | |
| 214 | 214 | ||
| 215 | 215 | Provides `OnDraw` and `OnGetBounds` events to allow arbitrary custom drawing on the TChart. Note that using `TChart.Canvas` directly is highly discouraged and will often not work as expected. | |
| 216 | 216 | ||
| 217 | 217 | ### Functional series | |
| 218 | 218 | ||
| 219 | 219 | Functional series are recommended way to draw functional plots as opposed to, for example, pre-calculating function data and using line series. They provide scale-independent controls of smoothness vs drawing speed. | |
| 220 | 220 | ||
| 221 | 221 | You can see examples of functional series in "func" demo. | |
| 222 | 222 | ||
| 223 | 223 | #### Function series | |
| 224 | 224 | ||
| 225 | 225 | `TFuncSeries` represents a one-dimensional function defined by the `OnCalculate` event. The function is calculated for each `Step` pixels of the image, so you can use this property to increase either "smoothness" or drawing speed. | |
| 226 | 226 | ||
| 227 | - | ||
| 227 | + | The `Extent` property may be used to set both x and y extents for the purpose of calculating full extent of the chart. While drawing, however, this property is ignored, and the function will be displayed according to the current extent. | |
| 228 | 228 | ||
| 229 | 229 | The `DomainExclusions` property allows to exclude some intervals from the function domain. The TFuncSeries correctly draws discontinuity points set by `DomainExclusions`. Currently, `DomainExclusions` can only be set at run-time by calling the `AddRange` or `AddPoint` procedures. Intervals defined by `DomainExclusions` are closed by default, i.e. contain the end points; this means that the function is not calculated at the end points. If the domain exclusion must contain endpoints (as needed for the funtion `y = sqrt(x)`) call `AddRange` with the corresponding element of the set `TIntervalOptions = (ioOpenStart, ioOpenEnd)` as optional third parameter. | |
| 230 | 230 | ||
| 231 | 231 | The `DomainExclusions.Epsilon` property controls the distance between endpoint and last drawn point (of course, in case of an open interval, the curve begins immediately at the end point). `Epsilon` can be adjusted in the rare cases that the default value of 1E-6 does not produce correct results. | |
| 232 | 232 | ||
| 233 | 233 | #### Expression series | |
| 234 | 234 | ||
| 235 | 235 | The `TExpressionSeries` is similar to the `TFuncSeries`, but the function is specified as a mathematical expression string such as `'sin(1.23456*x)'` (property `Expression`). The series creates an instance of the [[How To Use TFPExpressionParser|FPExpressionParser]] to analyze the string and to calculate the function values. In this way functions can be plotted at designtime. | |
| 236 | 236 | ||
| 237 | 237 | The property `Params` allows to define parameters for the function term; in the object inspector it opens a collection editor in which every parameter can be specified by its name (as used in the expression) and its value. If, for example, a parameter `f` is defined to have the value `1.23456` then above expression can also be written as `'sin(f*x)'`. | |
| 238 | 238 | ||
| 239 | 239 | Similarly to `TFuncSeries`, domain exclusions are supported to define the regions at which the function cannot be calculated. But in agreement with mathematical conventions, `TExpressionSeries` requires in property `Domain` the region in which the function is **defined** (the complement of the domain exclusions). The region is specified by a string such as `'x >= 0'`. If several conditions exist they must be separated by a colon, e.g. `'x < -1; x > 1'`. The colon has function of a logical OR. An interval is defined like `'-1 < x < 1'`. The constant parts of the conditions can be mathematical expressions as well - the following example excludes the point π/2 from calculation of the function values: `'x <> pi/2'`. Decimal numbers must be entered with a dot as decimal separator, no matter what is defined in the language settings of the operating system. | |
| 240 | 240 | ||
| 241 | 241 | > **Note:** Parameters and domains must be defined before the expression is entered, otherwise the parser will report an error | |
| 242 | 242 | ||
| 243 | 243 | #### B-spline series | |
| 244 | 244 | ||
| 245 | 245 | `TBSplineSeries` draws [B-spline](https://en.wikipedia.org/wiki/B-spline) of given `Degree` using [De Boor's algorithm](https://en.wikipedia.org/wiki/De_Boor's_algorithm). | |
| 246 | 246 | ||
| 247 | 247 | Spline segments shorter then `Step` pixels are represented by straight lines. | |
| 248 | 248 | ||
| 249 | 249 | #### Cubic spline series | |
| 250 | 250 | ||
| 251 | 251 | `TCubicSplineSeries` draws the data curve as a [cubic spline](https://en.wikipedia.org/wiki/Spline_interpolation) using the standard *NumLib* package of FPC. | |
| 252 | 252 | ||
| 253 | 253 | In Lazarus v2.0+, a property `SplineType` allows to select between [natural](https://en.wikipedia.org/wiki/Spline_interpolation) and [monotone Hermite](https://en.wikipedia.org/wiki/Monotone_cubic_interpolation) splines, the latter avoiding overshoot of the interpolation. | |
| 254 | 254 | ||
| 255 | 255 | The spline function is calculated for each `Step` pixels of the image, so you can use this property to increase "smoothness" or drawing speed. | |
| 256 | 256 | ||
| 257 | 257 | The data source must contain at least two points and have strictly increasing X coordinates. (Older Lazarus versions before v2.0 require at least 4 data points; for less points a polygon is drawn instead of a spline using the `BadDataPen` if the `csoDrawFewPoints` option is set.) | |
| 258 | 258 | ||
| 259 | 259 | If X values are unordered and the `csoDrawUnorderedX` option is set, the spline will be drawn ignoring offending points using `BadDataPen`. | |
| 260 | 260 | ||
| 261 | 261 | The options `csoExtrapolateLeft` and `csoExtrapolateRight` enable natural extrapolation to the left and to the right correspondingly. | |
| 262 | 262 | ||
| 263 | 263 | #### Fit series | |
| 264 | 264 | ||
| 265 | 265 | `TFitSeries` performs [least squares fitting](https://en.wikipedia.org/wiki/Least_squares) using calculation routines contained in the standard [[numlib|Numlib]] package from the FPC. The main fitting unit is *TAFitLib* which is self-contained and can be applied also without TAChart. | |
| 266 | 266 | ||
| 267 | 267 | The fitting function is selected via the `FitEquation` property: | |
| 268 | 268 | ||
| 269 | 269 | - `fePolynomial`: *y* = *b*<sub>0</sub> + *b*<sub>1</sub>*x* + *b*<sub>2</sub>*x*<sup>2</sup> + … + *b*<sub>n</sub>*x*<sup>n</sup>, where the value of *n* is controlled by `ParamCount` property (`ParamCount = n + 1`). | |
| 270 | 270 | - `feLinear`: *y* = *a* + *bx* | |
| 271 | 271 | - `feExp`: *y* = *a* * e*<sup>bx</sup>* | |
| 272 | 272 | - `fePower`: *y* = *a* * *x*<sup>b</sup> | |
| 273 | 273 | - `feCustom`: *y* = *b*<sub>0</sub>X<sub>0</sub>(*x*) + *b*<sub>1</sub>X<sub>1</sub>(*x*) + *b*<sub>2</sub>X<sub>2</sub>(*x*) + … + *b*<sub>n</sub>X<sub>n</sub>(*x*) where the value of *n* is controlled by the `ParamCount` property (`ParamCount = n + 1`), and X<sub>i</sub>(*x*), *i* = 0..*n*, are "basis functions" which are defined by the method `SetFitBasisFunc(AIndex: TFitFuncIndex; AFitFunc: TFitFunc; AFitFuncName: String)`. | |
| 274 | 274 | - `AIndex` - index *i* of the basis function, `1..MaxInt`. | |
| 275 | 275 | - `AFitFuncName` is a text representation of the function to be used for the default legend. | |
| 276 | - | ||
| 276 | + | - `AFitFunc` - address of the basis function X<sub>i</sub>(*x*) which has the signature `function(x: ArbFloat; Param: Integer): ArbFloat` with `ArbFloat` being the general floating-point data type in FPC's [[numlib|Numlib]] (unit typ). Some basis functions are readily available in unit *TAFitLib*: | |
| 277 | 277 | ||
| 278 | 278 | ``` pascal | |
| 279 | 279 | function FitBaseFunc_Const(x: ArbFloat; Param: Integer): ArbFloat; // constant term | |
| 280 | 280 | function FitBaseFunc_Linear(x: ArbFloat; Param: Integer): ArbFloat; // linear term (x) | |
| 281 | 281 | function FitBaseFunc_Square(x: ArbFloat; Param: Integer): ArbFloat; // square term (x^2) | |
| 282 | 282 | function FitBaseFunc_Cube(x: ArbFloat; Param: Integer): ArbFloat; // cubic term (x^3) | |
| 283 | 283 | function FitBaseFunc_Poly(x: ArbFloat; Param: Integer): ArbFloat; // power term (x^Param) | |
| 284 | 284 | function FitBaseFunc_Sin(x: ArbFloat; Param: Integer): ArbFloat; // sin(x*Param) | |
| 285 | 285 | function FitBaseFunc_Cos(x: ArbFloat; Param: Integer): ArbFloat; // cos(x*Param) | |
| 286 | 286 | ``` | |
| 287 | 287 | ||
| 288 | 288 | By default, the parameters, `b`<sub>`0`</sub>`, b`<sub>`1`</sub>`, ..., a, b` are varied by the fitting process such that the mean square deviation between data and fitted curves is minimized. However, it is also possible to hold one or more fitting parameters constant, e.g. in order to force a fitted straight line to run through the origin. For this purpose, the values of the constant parameters must be specified in the ';' or '\|' delimited list of string values of property `FixedParams`. The order of values must match the order of the fitting parameters. Variable parameters can be left empty or replaced by a non-numerical string. | |
| 289 | 289 | ||
| 290 | 290 | Example: `FixedParams='var;2'` (or shorter: `';2'`) means that the first fitting parameter is variable, but the second one is held constant a the value 2; if there are more than 2 parameters, the others are considered to be variable, too. | |
| 291 | 291 | ||
| 292 | 292 | The fitting range is usually defined by the series extent, but can be manually set via the `FitRange` property. The fitting function is drawn over the entire axis unless `DrawFitRangeOnly = true`. | |
| 293 | 293 | ||
| 294 | 294 | When fitting is complete the `ErrCode` of the series is set to indicate whether the calculation was successful or not: | |
| 295 | 295 | ||
| 296 | 296 | - `fitOK`: successful | |
| 297 | 297 | - `fitDimError`: calculation was aborted because the dimensions of the data arrays (x, y, y error bars) do not match. | |
| 298 | 298 | - `fitMoreParamsThanValues`: calculation failed because there are more fitting parameters than data values. | |
| 299 | 299 | - `fitNoFitParams`:calculation aborted because no fit parameters are specified. This could happen incidentally if all fitting parameter are forced to be fixed in the `FixedParams` property. | |
| 300 | 300 | - `fitSingular`: the design matrix of the fit problem is found to be (nearly) singular. | |
| 301 | 301 | - `fitNoBaseFunction`: Not enough fit basis functions are specified for the case of `FitEquation=feCustom`. | |
| 302 | 302 | ||
| 303 | 303 | The method `ErrorMsg` creates a text for an error message from the current `ErrCode`. | |
| 304 | 304 | ||
| 305 | 305 | The event `OnFitComplete` is called after the fitting equation is found, but before the drawing starts. This is a good place to query the results of the fitting procedure: | |
| 306 | 306 | ||
| 307 | 307 | - `Param[AIndex]` is the best-fit value for the parameter with the specified index, `AIndex = 0..ParamCount-1`. | |
| 308 | 308 | - `ParamError[AIndex]` tells the uncertainty ("standard error" in statistical terms) of the corresponding fitting parameter. | |
| 309 | 309 | - The procedure `GetConfidenceLimits(AIndex: Integer; out ALower, AUpper: Double)` returns the range between `ALower` and `AUpper` within which the corresponding best-fit parameter is expected to be found at the probability specified by `ConfidenceLevel` (default: `0.95`, i.e. 95%). | |
| 310 | 310 | - `Param_tValue[AIndex]` returns the value of the [t statistic](https://en.wikipedia.org/wiki/T-statistic) for the corresponding fit parameter. This is the ratio of value divided by standard error. For an accurate parameter, the t value should be much larger than 1. | |
| 311 | 311 | - `Param_pValue[AIndex]` is the probability that any t value as high as `Param_tValue` occurs just by chance for the given degrees of freedom. In order to "trust" the fitted value with a certainty given by `ConfidenceLevel`, the p value should be smaller than `1 - ConfidenceLevel`, by default 0.05. | |
| 312 | 312 | - `FitStatistics` informs about other statistical parameters helpful to verify the validity of the fitted model or for further statistical calculations. These data are accessible as properties or functions of this class: | |
| 313 | 313 | - `N` (integer): the number of data points used for fitting. Note that this can be less than the data points provided by the chart source since it may contain NaN values which are skipped. | |
| 314 | 314 | - `M` (integer): the number of fitting parameters. Normally this is the value of `ParamCount`, but if certain parameters are forced to be constant (`FixedParams`) their count is subtracted. | |
| 315 | 315 | - `DOF` (integer): "degrees of freedom" - is the difference `N - M`, an important parameter in the statistical analysis of the fit results. | |
| 316 | 316 | - `SST`: "total sum of squares" - this is the sum of the squares of the term `(y[i] - ymean)/dy[i]` over all data points. Here, `y[i]` is the y value of a data point at index `i`, `dy[i]` the size of its error bar (standard deviation) - or 1 if not available -, and `ymean` is the average value of `y[i]/dy[i]`. The quantity identifies the total variation of data points around their mean value. | |
| 317 | 317 | - `SSE`: "error sum of squares" - the variation of the data points around the fitted curve, i.e. sum of `((y[i] - ycalc(x[i])/dy[i])^2)`; here `ycalc(x[i])` is the calculated value of the fitted curve at the point `x[i]`. | |
| 318 | 318 | - `SSR`: "regression sum of squares" - the variation of the fitted curve alone, i.e. sum of `((ycalc(x[i]) - ymean)/dy[i])^2`. | |
| 319 | 319 | - `xBar`: average value of the x coordinates of all used data points. | |
| 320 | 320 | - `SSx`: variation of the x coordinates of the data points, i.e. sum of `(x[i] - xbar)^2`. | |
| 321 | 321 | - `VarCovar[i, j: Integer]: Double`: is an element of the variance-covariance matrix for the fit parameters at the given indexes. | |
| 322 | 322 | - `R2`: "coefficient of determination". This is the ratio `SSR/SSE` and describes how much of the variation in the data is explained by the fitted curve. The value is 1 for a perfect fit and 0 for absolutely no agreement. | |
| 323 | 323 | - `AdjR2`: was introduced to compensate for the effect that `R2` usually increases by adding more and more fit parameters. | |
| 324 | 324 | - `Chi2`: another word for `SSE`. In essence, this is the statistical quantity which is minimized during the fitting procedure. The value given is the minimum value found. | |
| 325 | 325 | - `ReducedChi2`: is `Chi2` (or: `SSE`) normalized to the degrees of freedom, i.e. variation of the data around the fitted curve per degree of freedom. Should be "small" for a good fit. | |
| 326 | 326 | - `ResidualStdError`: is the overall standard error of the fit. Should be "small". | |
| 327 | 327 | - `pValue`: (fractional) probability that the residual scatter of the data points around the fitted curve is by chance. Should be high, in practice a few thenths, although sometimes values as low as 0.001 are still accepted. If no error bars are included in the fit, sometimes p turns out to be either exactly 0 or 1 - such values should be ignored. | |
| 328 | 328 | - The procedures `GetLowerConfidenceInterval(const Ax: Double; out AY: Double)`, `GetUpperConfidenceInterval`, `GetLowerPredictionInterval` and `GetUpperPredictionInterval` can be hooked into the `OnCalculate` event of a `TFuncSeries` in order to plot the limits of the lower and upper confidence and prediction intervals around the fitted curve. These limits define areas around the fitted curve within which the overall fitted curve (confidence interval) or individual data points (prediction interval) can be expected based on the probability given by `ConfidenceLevel`. | |
| 329 | 329 | - Note: all these statistical data assume that the residual errors follow a normal distribution and that the error bars have been estimated appropriately. | |
| 330 | 330 | ||
| 331 | 331 | The `EquationText` method returns an `IEquationText` interface, which allows to construct a string representing the fit equation. You can override names of *x* and *y* variables, numeric format, and, finally, obtain a string from `Get` function. Note that a transformation from IEquationText to String is defined, so usually there is no need to call `Get` explicitly. | |
| 332 | 332 | ||
| 333 | 333 | Legend.Format property of fit series supports additional format argument ('%2:s') pointing to the default equation text. | |
| 334 | 334 | ||
| 335 | 335 | After a change to `TFitSeries` parameters, the equation will be recalculated on the next drawing of the series. To recalculate it immediately, call `ExecFit` procedure. Use `State` property to check the validity of current equation. | |
| 336 | 336 | ||
| 337 | 337 | #### Color map series | |
| 338 | 338 | ||
| 339 | 339 | `TColorMapSeries` represents a 2-dimensional function defined by the `OnCalculate` event as a field of pixels, with color depending on function value. | |
| 340 | 340 | ||
| 341 | 341 | The series is drawn as a set of rectangles of size `StepX` by `StepY` pixels. The function is called once for each rectangle. | |
| 342 | 342 | ||
| 343 | 343 | Color values are defined by one of the built-in palettes (property `BuiltinPalette = cmpHot, cmpCold, cmpRainbow, cmpMonochrome`). The range of values mapped to the colors of the palette must be specified in `BuiltinPaletteMax` and `BuiltinPaletteMin`, otherwise the results are not predictable. | |
| 344 | 344 | ||
| 345 | 345 | Alternatively, an external ChartSource can be assigned to property `ColorSource`, which must be sorted. Each data point of the chart source is interpreted as having its X value correspond to the Color value. If the actual value falls between color levels, it can be either linearly interpolated (if `Interpolate` is `true`) or rounded down to the nearest level. | |
| 346 | 346 | ||
| 347 | 347 | When `Legend.Multiplicity=lmPoint`, the color map series will display the color levels in the legend. | |
| 348 | 348 | ||
| 349 | 349 | #### Expression color map series | |
| 350 | 350 | ||
| 351 | 351 | is similar to the color map series with the main difference that the 2-dimensional function is not defined by an event, but by a mathematical expression, such as `x^2+y^2`, like in the TExpressionSeries, but now with two variables `x` and `y`. The variables can be renamed by means of the properties `VariableNameX` and `VariableNameY`. Similar to `TExpressionSeries` it is also possible to introduce parameters (property `Params`). Domains, however, are not supported, the function must be defined within the entire visible x/y range. | |
| 352 | 352 | ||
| 353 | 353 | ## Sources | |
| 354 | 354 | ||
| 355 | 355 | 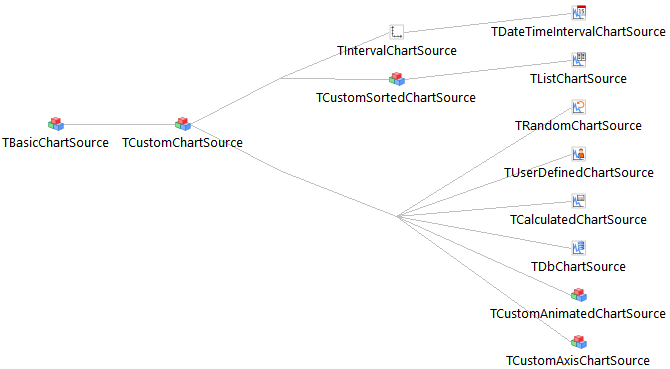Data can get into a chart from various sources. They are implemented as a set of components derived from `TCustomChartSource`. | |
| 356 | 356 | ||
| 357 | 357 | To assign a source to a series, you can set the `Source` property. If the property is left unassigned, the series will use its own built-in list source. Methods like `AddXY` are delegated to the current series source. Note that the list source is the only editable source, so after you assign, for example, a random chart source to the series, a call to `AddXY` will raise an exception. | |
| 358 | 358 | ||
| 359 | 359 | Each data item has the following fields: `X`, `Y`, `XList`, `YList`, `Color`, `Text`. | |
| 360 | 360 | ||
| 361 | 361 | The element `Text` can provide a text for each y value. In this case, the individual texts must be separated by the `LabelSeparator` defined by the source (by default, `'|'`). The number of texts must match the number of y values. | |
| 362 | 362 | ||
| 363 | 363 | ### Sorted sources | |
| 364 | 364 | ||
| 365 | 365 | If it is known that X values of the source are ascending, some additional optimizations like binary search become possible. So all sources have an `IsSorted` property which helps determine that. | |
| 366 | 366 | ||
| 367 | 367 | In Lazarus 2.1+, the TListChartSource can be sorted according to several criteria: | |
| 368 | 368 | ||
| 369 | 369 | - `SortBy` = `sbX`, `sbY`, `sbText`, `sbColor`, `sbCustom`: sorting by X or Y value, Text, Color or in a user-defined way, respectively. In the latter case a handler for the event `OnCompare` must be provided. | |
| 370 | 370 | - `SortIndex`: the index of the X or Y value used for sorting. | |
| 371 | 371 | - `SortDir` = `sdAscending`, `sdDescending`: sorting in ascending or descending order. | |
| 372 | 372 | ||
| 373 | 373 | When a source is sorted by anything other than x only the drawing order of the related series is affected, and it may be possible that nothing changes in the chart. A visual effect is seen for | |
| 374 | 374 | ||
| 375 | 375 | - TPieSeries because the data point order determines to order of the pies around the circle | |
| 376 | 376 | - TBubbleSeries when bubbles overlap. Use the combination `SortBy=sbY`, `SortIndex=1` and `SortDir=sdDescending` to avoid covered bubbles because large bubbles are drawn first and small bubbles last. | |
| 377 | 377 | - all series inherited from TBasicPointSeries when the `XCount` of the associated chart source is 0: in this case, the X value of the source is ignored and replaced by the data point index. Since the data point index changes upon sorting the data points will be automatically rearranged in the sorted order - see example *sort_demo* in the *demo* folder. | |
| 378 | 378 | ||
| 379 | 379 | ### Multi-valued sources | |
| 380 | 380 | ||
| 381 | 381 | Sources can contain multiple Y values for each X value. These values are stored in the `YList` field of the source data item. The number of Y values is determined by the `YCount` property. Note that the first Y value is stored in Y field anyway, so `YCount=3` means that values are stored in `Y`, `YList[0]` and `YList[1]`. | |
| 382 | 382 | ||
| 383 | 383 | Additional values may be used by various series -- for example, stacked bars or bubble charts. | |
| 384 | 384 | ||
| 385 | 385 | Moreover, it is also possible to store several X values for the same data point. This is required by `TFieldSeries`. These additional X values are stored in the `XList` of the source data item. Like with the Y values, the total count of X values is given by the `XCount` property which contains the "ordinary" X value plus the length of the `XList` array. | |
| 386 | 386 | ||
| 387 | 387 | ### Skipping source items | |
| 388 | 388 | ||
| 389 | 389 | It is possible to instruct TAChart to skip drawing some source items without removing them from the source. This may be useful for both optimization and user interface reasons. | |
| 390 | 390 | ||
| 391 | 391 | To skip the item, assign [NaN](http://www.freepascal.org/docs-html/rtl/math/nan.html) to either X value or one of the Y values. The exact effect of skipping depends on the series, but usually setting X to NaN means skipping the entire item, while setting Y or some element of YList means skipping only this Y value, while still drawing others. | |
| 392 | 392 | ||
| 393 | 393 | Also note that if you set only one coordinate to NaN, the other will still take part in extent calculation. | |
| 394 | 394 | ||
| 395 | 395 | In case of stacked series it is not clear how the missing value should be handled when the following levels are added to it. In Lazarus v2.1+ there is a property `StackedNaN` which can be selected as | |
| 396 | 396 | ||
| 397 | 397 | - `snReplaceByZero` -- the missing value is considered to be zero; this is the way how Excel handles this case. | |
| 398 | 398 | - `snDoNotDraw` -- skips the entire data point with all stack levels. | |
| 399 | 399 | ||
| 400 | 400 | You can see examples of skipping items in the "nan" demo. | |
| 401 | 401 | ||
| 402 | 402 | ### Error bars | |
| 403 | 403 | ||
| 404 | 404 | `TLineSeries`, `TBSplineSeries`, `TCubicSplineSeries`, `TFitSeries` and `TAreaSeries` can display error bars at each data point. The size of the error bars in both `x` and `y` direction is determined by the parameters in the `XErrorBarData` and `YErrorBarData` properties of the chart source, respectively: | |
| 405 | 405 | ||
| 406 | 406 | - `Kind: TChartErrorBarKind`: defines how the following data are interpreted | |
| 407 | 407 | - `ebkNone`: ignore - no error bars will be diplayed | |
| 408 | 408 | - `ebkConst`: all data points have the same error bar given by `ValuePlus` and `ValueMinus`. | |
| 409 | 409 | - `ebkPercent`: the values `ValuePlus` and `ValueMinus` are understood as percentage of the data values. | |
| 410 | 410 | - `ebkChartSource`: every data point can have an individual error bar. The error bar length is stored in the XList or YList of a multi-valued chart source. The index among all x and y values is specified by `IndexPlus` and `IndexMinus` for positive and negative error bar, respectively. | |
| 411 | 411 | - `ValuePlus` and `ValueMinus`: length of the positive and negative error bars, respectively. Depending on the setting of `Kind`, the value is assumed to be constant for all data points (`Kind = ebkConst`, axis units), or a percentage of the data point value (`Kind = ebkPercent`). Both values must be positive numbers with the exception of `ValueMinus = -1` which indicates that the negative error bar should be equal to the positive error bar. | |
| 412 | 412 | - `IndexPlus` and `IndexMinus` are used when `Kind` is `ebkChartSource` and indicate the x or y index in a multi-valued chartsource from which the error bar lengths for the individual data points can be obtained. Suppose a chart source contains two x values (`XCount = 2`) and `XErrorBarData.ValuePlus` is `1` then the second x value (stored in `XList[0]`) is used for the positive error bar length. If `IndexMinus` is -1 then the negative error bar length is assumed to be equal to that of the positive error bar without having to provide an explicit value in the chart source. | |
| 413 | 413 | ||
| 414 | 414 | > **Note:** Usage of multiple y values for other purposes than individual error bars is discouraged in this context because the present implementation can display error bars only for the y value with index 0. | |
| 415 | 415 | ||
| 416 | 416 | Each series type supporting error bars has additional properties `XErrorBars` and `YErrorBars` which determine how the error bars will be displayed: | |
| 417 | 417 | ||
| 418 | 418 | - `Visible` can be used to turn off error bars even if their size is specified in the chart source. | |
| 419 | 419 | - `Width` is the length of the crossbar drawn at the end of the error bar. The default value -1 means that its length will be equal to the corresponding size of the series' `Pointer`. | |
| 420 | 420 | - `Pen` defines the pen parameter used for drawing the error bars. Usually set `Pen.Color` to the color of the series. | |
| 421 | 421 | ||
| 422 | 422 | ### List source | |
| 423 | 423 | ||
| 424 | 424 | `TListChartSource` is a basic chart source, storing chart data inside itself. As such, you can use `Add` and `Delete` functions to change source data. | |
| 425 | 425 | ||
| 426 | 426 | The `Item` property returns a pointer directly to the underlying storage, so you can modify item fields directly. However, doing this will not automatically update the chart and will also invalidate some internal state of list source. It is recommended: | |
| 427 | 427 | ||
| 428 | 428 | - To change a single item, use `Set{Color|Text|XValue|YValue|YList}` procedures. | |
| 429 | 429 | - To change many items in a time-sensitive code, call `BeginUpdate`, then modify items directly, then call `EndUpdate`. | |
| 430 | 430 | ||
| 431 | 431 | The source also has `DataPoints` property to allow setting data at design time. This property is a TStringList, with each line representing a data point. Line consists of X, Y, optional YList, Color and Text values separated by \| (vertical bar) character. Note that `DataPoints` property is designed primarily for sample and demo code. It is very inefficient, and you should not use it to add data points from the code. | |
| 432 | 432 | ||
| 433 | 433 | You can control X value sorting by setting the `Sorted` property. Note when `Sorted` is set to true, list source sorts the data and keeps it sorted after insertion of new points. If inserted points are not sorted, this may result in quadratic running time. You should either set `Sorted` to true only after insertion, or pre-sort your data to avoid this. | |
| 434 | 434 | ||
| 435 | 435 | ### Random source | |
| 436 | 436 | ||
| 437 | 437 | `TRandomChartSource` source generates random data in the given range and is intended mostly to use in demos. You can also use it as design-time replacement for your actual data source. This will let you see and change the look of your chart without having to run the application. | |
| 438 | 438 | ||
| 439 | 439 | Each random source uses its own independent random number generator to guarantee the stability of its values. | |
| 440 | 440 | ||
| 441 | 441 | ### User-defined source | |
| 442 | 442 | ||
| 443 | 443 | This source may be used if you already have your data in memory, but in a format different from the data items used in TAChart. With user-defined source you can access your data directly instead of first moving it all into a list source. In some cases this may improve performance or reduce memory consumption. You can of course also generate, filter or modify data with the user-defined source. | |
| 444 | 444 | ||
| 445 | 445 | The number of data items in the source is determined by `PointsNumber` property. Items themselves must be returned by the `OnGetChartDataItem` event handler. You should call `Reset` method to notify the chart about changes in the data. (Other sources detect changes and perform notification automatically). | |
| 446 | 446 | ||
| 447 | 447 | Note that if the `Sorted` property is set to true, it is the responsibility of the event handler to provide actually sorted data. | |
| 448 | 448 | ||
| 449 | 449 | ### Database source | |
| 450 | 450 | ||
| 451 | 451 | `TDbChartSource` takes data directly from a database. It is contained in a separate unit to avoid introducing a db-aware component dependency into every project using TAChart. | |
| 452 | 452 | ||
| 453 | 453 | The following properties contain database field names for data item fields: | |
| 454 | 454 | ||
| 455 | 455 | | Property | Access method | | |
| 456 | 456 | |--------------|---------------------------------------------------------| | |
| 457 | 457 | | `FieldX` | AsFloat (or AsDateTime, if option dcsoDateTimeX is set) | | |
| 458 | 458 | | `FieldY` | AsFloat (or AsDateTime, if option dcsoDateTimeY is set) | | |
| 459 | 459 | | `FieldColor` | AsInteger | | |
| 460 | 460 | | `FieldText` | AsString | | |
| 461 | 461 | | | | | |
| 462 | 462 | ||
| 463 | 463 | If `FieldX` property is empty, `RecNo` is used instead. `NULL` values in coordinate fields are translated into NaNs. | |
| 464 | 464 | ||
| 465 | 465 | To get a multi-valued source, set the `FieldY` property to a comma-separated list of field names. Note that `YCount` will be set automatically -- trying to set it by hand will raise an exception. | |
| 466 | 466 | ||
| 467 | 467 | When the dataset returns date/time fields as strings you should set the property `DateTimeFormat` accordingly (e.g. `'yyyy-mm-dd'`) so that the strings can be converted to a TDateTime variables. | |
| 468 | 468 | ||
| 469 | 469 | Please note that iterating through the items of a `TDBChartSource` is very ineffective. Do not attach other DB-aware controls to the same dataset because they will mirror the process. Usually it is recommended to copy the `DBChartSource` to a `ListChartSource` for better performance. Note also that some dataset types do not read all records of a table or query. | |
| 470 | 470 | ||
| 471 | 471 | ### Calculated source | |
| 472 | 472 | ||
| 473 | 473 | `TCalculatedChartSource` is the source used for manipulating data taken from the `Origin` source. This source performs transformations in the following order: | |
| 474 | 474 | ||
| 475 | 475 | - Y reordering -- Y values of multi-valued source can be duplicated, removed or exchanged according to `ReorderYList` property, which is a comma-separated list of original Y value indexes. Step skipped if `ReorderYList` is empty. | |
| 476 | 476 | - Accumulation -- replaces each item's Y values by a function of the neighboring values. | |
| 477 | 477 | - Percentage -- replace each Y value by the percentage of total of all Y values for that item. Useful for drawing "stacked percentage" bar and area charts. Step skipped if the `Percentage` property is false. | |
| 478 | 478 | ||
| 479 | 479 | Accumulation is controlled by several properties: | |
| 480 | 480 | ||
| 481 | 481 | `AccumulationRange` controls number of items to accumulate, counting the current item, so `AccumulationRange = 1` disables accumulation. `AccumulationRange = 0` is interpreted as "infinite" range, i.e. request to accumulate over all the available data. This is mostly useful in conjunction with `camSum` method to produce cumulative sums. | |
| 482 | 482 | ||
| 483 | 483 | Note that the actual number of items may be lower for the points near the beginning or end of the source. | |
| 484 | 484 | ||
| 485 | 485 | `AccumulationDirection`: | |
| 486 | 486 | ||
| 487 | 487 | - `cadBackward` -- use previous values from the source, | |
| 488 | 488 | - `cadForward` -- use next values from the source, | |
| 489 | 489 | - `cadCenter` -- use both previous and next values for a total number of up to `2 * AccumulationRange - 1`. | |
| 490 | 490 | ||
| 491 | 491 | `AccumulationMethod`: | |
| 492 | 492 | ||
| 493 | 493 | - `camNone` -- skip accumulation step, | |
| 494 | 494 | - `camSum` -- sum of the last `AccumulationRange` items, | |
| 495 | 495 | - `camAverage` -- average the last `AccumulationRange` items, | |
| 496 | 496 | - `camDerivative` -- finite differences derivative, calculated using the last `AccumulationRange` items. Note that the calculation method assumes equidistant X values, and may loose accuracy if the X distance varies substantially. | |
| 497 | 497 | - `camSmoothDerivative` -- smoothed finite differences derivative, more robust against random measurement errors in the data. | |
| 498 | 498 | ||
| 499 | 499 | ### Interval source | |
| 500 | 500 | ||
| 501 | 501 | `TIntervalChartSource` can supply arbitrarily many points in a given interval, controlled by various properties of the source. This source is the default built-in source for axis marks. If you want to set the same axis interval parameters for several axes, you can assign a single `TIntervalChartSource` component the `Marks.Source` of each of those axes. | |
| 502 | 502 | ||
| 503 | 503 | ### Date-time interval source | |
| 504 | 504 | ||
| 505 | 505 | `TDateTimeIntervalChartSource` is similar to the TIntervalChartSource, but provides marks formatted as date/time values. This source automatically selects appropriate calendar interval (such as week or hour) depending on the axis scale. | |
| 506 | 506 | ||
| 507 | 507 | Note that X values of provided data items are `TDateTime` values, and `Label` values contain formatted date-time strings. If you want to use `TDateTimeIntervalChartSource` as the source of axis marks, you should probably set `Marks.Format` or `Marks.Style` properties to make use of provided labels (e.g. by setting `Marks.Style` to `smsLabel`). | |
| 508 | 508 | ||
| 509 | 509 | If the `DateTimeFormat` property is set, it is used to format all labels. Formatting is performed with standard [SysUtils.FormatDateTime](http://www.freepascal.org/docs-html/rtl/sysutils/formatdatetime.html) function. If `DateTimeFormat` is empty, format is chosen automatically based on scale. | |
| 510 | 510 | ||
| 511 | 511 | TDateTimeIntervalChartSource is defined in the [[TAIntervalSources]] unit. | |
| 512 | 512 | ||
| 513 | 513 | ### Source optimization notes | |
| 514 | 514 | ||
| 515 | 515 | Primary data source API allows random access. Nevertheless, many sources, in particular random, database and calculated, may exhibit quadratic or worse behavior if actually accessed randomly. TAChart itself takes care to only use sequential access (although it may require several passes). Sources optimize sequential access by using internal state. User code should be careful not to reset this state during chart drawing from event handlers or custom series code. | |
| 516 | 516 | ||
| 517 | 517 | A notable exception is the list source, which is guaranteed to provide fast random access. It may be used to cache slow sources with the help of `CopyFrom` procedure. | |
| 518 | 518 | ||
| 519 | 519 | Also note that the pointer returned by `GetItem` function may point to the internal buffer which will be overwritten by the next call to `GetItem`. Again the list source does not have this limitation. | |
| 520 | 520 | ||
| 521 | 521 | ## Coordinates and axes | |
| 522 | 522 | ||
| 523 | 523 | TAChart uses four coordinate systems: | |
| 524 | 524 | ||
| 525 | 525 | - *Axis coordinates* (known in some other applications as object coordinates) -- this is the "raw" coordinate values obtained from the data. As the name implies, axis coordinates are interpreted in terms of specific axis -- the same coordinate value may have different meaning depending on the axis it is applied to. | |
| 526 | 526 | - *Graph coordinates* (aka world coordinates) are converted from the axis coordinates using axis transformation, such as logarithmic scale. Graph coordinates are common for all objects in the chart. | |
| 527 | 527 | - *Image coordinates* (aka screen coordinates) are converted from graph coordinates based on the chart viewport. This transformation is always linear and can be influenced by chart tools such as zooming and panning. | |
| 528 | 528 | - *Device coordinates* are usually equal to screen coordinates, but may be adjusted to the drawing back-end to accommodate different physical resolutions (DPI values). See, for example, printer drawer. | |
| 529 | 529 | ||
| 530 | 530 | You can add or remove an arbitrary number of axes by editing `AxisList` property. By default, chart have two axes: one horizontal and one vertical. They are accessible via `BottomAxis` and `LeftAxis` properties. Note that those properties are aliases to `AxisList[0]` and `AxisList[1]`, so if you remove those default axes, accessing `BottomAxis` and `LeftAxis` will return nil. | |
| 531 | 531 | ||
| 532 | 532 | Visually, axis consists of the axis line (drawn by `AxisPen`), grid lines (drawn by `GridPen`), ticks, marks and arrow. | |
| 533 | 533 | ||
| 534 | 534 | Each axis is drawn inside its own rectangle, determined by the size of mark labels and ticks. By assigning several axes the same positive `Group` number, you can have them share the same rectangular area. Grouped axes can be used to achieve a "panes" look, when several series are drawn on different portions of the same graph. | |
| 535 | 535 | ||
| 536 | 536 | Axes with the same alignment, but different groups, are stacked alongside each other. You can use the `Margin` property to control spacing between such axes. | |
| 537 | 537 | ||
| 538 | 538 | ### Axis transformations | |
| 539 | 539 | ||
| 540 | 540 | Axis transformations are grouped in the `TChartAxisTransformations` component. It contains a list of transformations which are applied in the order given. (For example, performing scale before and after logarithm will yield different results). | |
| 541 | 541 | ||
| 542 | 542 | For transformations to have an effect, you should: | |
| 543 | 543 | ||
| 544 | 544 | - Make sure that the `Enabled` property is true for all transformations. (Default) | |
| 545 | 545 | - Assign transformations component to `Transformations` property of at least one axis. | |
| 546 | 546 | - Assign `AxisIndexX` and/or `AxisIndexY` properties of the series to the appropriate axis index. | |
| 547 | 547 | ||
| 548 | 548 | Note that by default, `AxisIndexX` and `AxisIndexY` have a special value of -1, which means "ignore axis transformations". Also note that if you add or remove axes, the indexes may change. You can rotate the series by assigning *both* `AxisIndexX` to vertical axis and `AxisIndexY` to the horizontal axis. | |
| 549 | 549 | ||
| 550 | 550 | #### Linear and logarithmic transformation | |
| 551 | 551 | ||
| 552 | 552 | Those are simple arithmetic transformations. | |
| 553 | 553 | ||
| 554 | 554 | #### Auto-scaling transformation | |
| 555 | 555 | ||
| 556 | 556 | To display several independently-scaled series, assign them to two or more axes and apply `TAutoScaleAxisTransform` to each axis. See "axistransf" demo, page "Linear", checkbox "Auto scale". | |
| 557 | 557 | ||
| 558 | 558 | By using the `MinValue` and `MaxValue` properties you can control the in graph coordinates of the auto-scaled series. For example, by setting one transformation to a range from 0 to 1, and another to a range from 1 to 2, you will confine all the series using the first transformation to the upper half of the chart, and all the series using the second transformation to the lower half (assuming there are no unassigned series left). | |
| 559 | 559 | ||
| 560 | 560 | #### Cumulative normal distribution transformation | |
| 561 | 561 | ||
| 562 | 562 | Use `TCumulNormDistrAxisTransform` to set [cumulative normal distribution](https://en.wikipedia.org/wiki/Cumulative_distribution_function) as an axis transformation. This may be useful in statistical charting. | |
| 563 | 563 | ||
| 564 | 564 | Note that this transformation result is in range from 0 to 1. It is recommended to restrict the axis range accordingly. | |
| 565 | 565 | ||
| 566 | 566 | See the "Normal distribution" page of the "axistransf" demo for an example. | |
| 567 | 567 | ||
| 568 | 568 | #### User-defined transformation | |
| 569 | 569 | ||
| 570 | 570 | You can create you own transformation either by inheriting from `TAxisTransform`, or, if you prefer "visual" programming, by using `TUserDefinedAxisTransform`. In either case there are two basic requirements: | |
| 571 | 571 | ||
| 572 | 572 | - `AxisToGraph` and `GraphToAxis` functions should be defined everywhere in data range and inverse of each other (for example, avoid now only dividing, but also multiplying by zero). | |
| 573 | 573 | - Functions should be monotonic. | |
| 574 | 574 | ||
| 575 | 575 | ### Date and time axes | |
| 576 | 576 | ||
| 577 | 577 | Using date/time values for axis marks is a common requirement. The correct way to do this depends on the exact nature of your date/time data: | |
| 578 | 578 | ||
| 579 | 579 | - If the data is actual `TDateTime` values, use it as an X coordinate in points, assign TDateTimeIntervalChartSource to the `Marks.Source` of the corresponding axis, and change `Marks.Style` to `smsLabel`. `TDateTimeIntervalChartSource` provides automatic labeling depending on the scale in wide range -- from centuries to milliseconds. | |
| 580 | 580 | - If the data is in physical units, but outside `TDateTime` values range, such as astronomical or micro-electronics timings, use it as a normal X coordinate with custom `Marks.Format`. | |
| 581 | 581 | - If the data is in calendar units, such as months and years, which is common for financial data, you have several options: | |
| 582 | 582 | - If date units are "equidistant" when interpreted as numbers (for example, simple year numbers), assign the same data source to both series and axis marks, then use custom `Marks.Format`, `Axis.OnMarkToText` event or `Text` field of the data items to format dates per your requirements. | |
| 583 | 583 | - If date units are not "equidistant" (for example, numbers in YYYYMM format or even date strings), use surrogate X coordinate (usually, simply a point index) instead and display dates using methods described above. | |
| 584 | 584 | - Convert coordinates to `TDateTime` values beforehand, then use `tt` as described above. | |
| 585 | 585 | ||
| 586 | 586 | ### Axis ranges | |
| 587 | 587 | ||
| 588 | 588 | Axis range is measured in axis units and determines the extent of series attached to this axis. Normally an axis range is equal to the union of all series extents, but may be overridden with the `Range` property. | |
| 589 | 589 | ||
| 590 | 590 | Axis marks are displayed inside the axis marks range, which is determined as the intersection of: | |
| 591 | 591 | ||
| 592 | 592 | - Logical extent (converted to axis coordinates) | |
| 593 | 593 | - Combined extent of all data series of this axis, if `Marks.AtDataOnly = true` | |
| 594 | 594 | - `Marks.Range` property. | |
| 595 | 595 | ||
| 596 | 596 | ### Axis intervals | |
| 597 | 597 | ||
| 598 | 598 | Axis marks are located along the axis at equal intervals chosen by the chart. The choice of intervals can be influenced via `Intervals` property. This property has a few subproperties, which are applied in the following order: | |
| 599 | 599 | ||
| 600 | 600 | - The `Options` property contains a set of flags controlling usage of other parameters. If a flag is not in the set, the corresponding parameter is ignored. Additionally, the following options play a special role: | |
| 601 | 601 | - `aipGraphCoords`: tries to find the labels based on the graph coordinates rather than on the axis coordinates. This is required for logarithmic axes. | |
| 602 | 602 | - `aipInteger`: accepts only integer labels. This feature is useful for barcharts to suppress labels between the bars, or for logarithmic plots to get labels at powers of 10 (together with `aipGraphCoords`). But note that the axis can be left without any labels in unfavourable cases. | |
| 603 | 603 | - `NiceSteps` is a string containing a sequence of "step multipliers" -- floating point values in the range from 0 to 1, excluding 0. If this property is applied, the axis step will be a power of ten multiplied by one of the provided values. If several multipliers can be used, the leftmost one will be chosen. Multipliers are separated by the vertical bar (\|) character. | |
| 604 | 604 | - If `NiceSteps` is ignored or TAChart fails to find appropriate step, the axis range will be divided into equal intervals without regard to the number of decimal digits in the representation of mark values. In this case, it is recommended to reduce the number of visible digits in `Marks.Format`. | |
| 605 | 605 | - `MinLength` and `MaxLength` properties set the limits of interval length *in image units* (usually pixels). | |
| 606 | 606 | - The `Count` property is the desired number of axis marks. Among all mark steps passing the previous tests, TChart chooses the one which gives the number of marks nearest to the `Count`. If `Count` property is ignored, or there are several steps with equal number of marks, the longest step is chosen. | |
| 607 | 607 | - The `Tolerance` property sets the maximum distance *in image units* by which the mark may be moved in order to reduce the length of its decimal representation. This helps to avoid a lot of meaningless digits in mark labels when previous steps have for some reason failed to generate "nice" marks. Note that this stage ignores all previous restrictions, so large `Tolerance` values may result in significant distortions. Setting `Tolerance = 1` is often sufficient. | |
| 608 | 608 | ||
| 609 | 609 | Note that if you set the chart source manually, the `Intervals` property may apply only partially or not apply at all. For example, list source is unable to guarantee maximum interval length, since it has only a finite number of points. See also interval chart source. | |
| 610 | 610 | ||
| 611 | 611 | ### Axis position | |
| 612 | 612 | ||
| 613 | 613 | By default, the axis is aligned to the side of the chart corresponding to the `Alignment` property. You can position an axis differently by setting the `Position` and `PositionUnits` properties. | |
| 614 | 614 | ||
| 615 | 615 | The following values of the `PositionUnits` property are accepted: | |
| 616 | 616 | ||
| 617 | 617 | - `cuPercent` -- percentage of the clipping rectangle. | |
| 618 | 618 | - `cuGraph` -- absolute position in graph coordinates. | |
| 619 | 619 | - `cuAxis` -- absolute position in axis coordinates. In order to apply the correct axis transformation the index of the orthogonal axis (`OrthogonalAxisIndex`) must be specified (new feature in Laz 4.0). | |
| 620 | 620 | - `cuPixels` -- position in screen units relative to the default coordinate. | |
| 621 | 621 | ||
| 622 | 622 | **Note 1:** If the axis position is changed from default (`Position = 0` and `PositionUnits = cuPercent`), it will be excluded from the margins calculation, so it will appear to overlap the series. | |
| 623 | 623 | ||
| 624 | 624 | **Note 2:** The `Alignment` affects not only the position of the axis itself, but also of the corresponding labels. So, if two axes have both `Position = 50` and `PositionUnits = cuPercent`, but one has `Alignment = calLeft` and another `Alignment = calRight`, they will display a common axis line with labels on different sides. | |
| 625 | 625 | ||
| 626 | 626 | See "Position" page of the "axis" demo for an example. | |
| 627 | 627 | ||
| 628 | 628 | ### Axis titles | |
| 629 | 629 | ||
| 630 | 630 | If the property `TextFormat` is switched to `tfHTML` then HTML entities and tags can be embedded for special formatting of axis titles, such as subscripts/superscripts or greek characters. See HTML for details. | |
| 631 | 631 | ||
| 632 | 632 | The property `Wordwrap`, if set to `true`, allows to wrap extra long axis titles into new lines. Note that this feature works only when the title is horizontal for the x axis and vertical for the y axis. Moreover, html-formatted text is not supported for word-wrapping. | |
| 633 | 633 | ||
| 634 | 634 | ### Axis LabelSize | |
| 635 | 635 | ||
| 636 | 636 | Since Lazarus v1.4 the chart axes have a new property `LabelSize` which - if different from `0` - overrides the automatic calculation of the space needed by the axis marks. The `LabelSize`, approximately, defines the pixels between axis line and axis title, independently of the size of the axis labels. This feature can be used to align the axis lines of several charts that are stacked above each other or placed side by side. | |
| 637 | 637 | ||
| 638 | 638 | See the "axisalign" demo and [[TAChart documentation|Graphical explanation]] for an example. | |
| 639 | 639 | ||
| 640 | 640 | > **Note:** If the (non-zero) `LabelSize` value is too small then the axis labels may reach into the axis title or may even be truncated at the chart border. | |
| 641 | 641 | ||
| 642 | 642 | ## Extents and margins | |
| 643 | 643 | ||
| 644 | 644 | ### Extents | |
| 645 | 645 | ||
| 646 | 646 | Chart *extent* is a rectangle in graph coordinates. | |
| 647 | 647 | ||
| 648 | 648 | There are several extents defined by TChart: | |
| 649 | 649 | ||
| 650 | 650 | - *Full extent* -- usually determined automatically as the area encompassing all the data from series and axis ranges. Is returned by the `GetFullExtent` function. | |
| 651 | 651 | - *Fixed extent* -- determined by the `TChart.Extent` property. May override full extent calculation partially or fully. | |
| 652 | 652 | - `LogicalExtent` -- the extent requested by the user to be seen on the chart image. Writing to this property is the official way to change the chart extent by external code. For example, `LogicalExtent := GetFullExtent` is (almost) equivalent to calling the `ZoomFull` procedure. | |
| 653 | 653 | - `CurrentExtent` -- the extent actually displayed to the user. May differ from the `LogicalExtent` due to the need to reserve space for series marks, inner chart margins etc. | |
| 654 | 654 | ||
| 655 | 655 | The value of the minimum extent cannot be greater than the value of the maximum extent. If an attempt is made to set such values an exception will be generated. To prevent exceptions, the procedure `.Extent.FixTo(aBounds: TDoubleRect)` can be used to set logical extents. The values in `TDoubleRect` are ordered in the following way: *\[xmin, ymin, xmax, ymax\]*. | |
| 656 | 656 | ||
| 657 | 657 | In order to invert the extents, the property `Inverted`' of the (left, bottom, etc) axis shall be set to `True`. | |
| 658 | 658 | ||
| 659 | 659 | **Important:** Setting logical extents will work as required only if all the `Margins` of the chart are set to 0 (default value is 4) and `Series.Marks.AutoMargins` to all series in the chart is set to `False` (default is `True`). Otherwise, the requested extent will be enlarged to include also the chart's `Margins` as well as the series' `Marks`. | |
| 660 | 660 | ||
| 661 | 661 | ### Extent limits | |
| 662 | 662 | ||
| 663 | 663 | By default, TAChart allows arbitrary extents. However, for both usability and speed reasons it may be desirable to limit extent size. For example, setting the lower bound of the size may disallow extreme zoom levels, while setting the upper bound may force the user to only see a part of the very long series at any given time. | |
| 664 | 664 | ||
| 665 | 665 | The extent can be limited with the `ExtentSizeLimit` property. Sub-properties `MinX`, `MinY`, `UseMinX` and `UseMinY` control the lower bounds of the extent, while sub-properties `MaxX`, `MaxY`, `UseMaxX` and `UseMaxY` control the upper bounds. | |
| 666 | 666 | ||
| 667 | 667 | Extent limits are expressed in graph units. | |
| 668 | 668 | ||
| 669 | 669 | Setting `Proportional = true` will enforce the current extent to have the shape of the plot area. This may be useful for cartographic or some math plots which require the same scale on both axes. | |
| 670 | 670 | ||
| 671 | 671 | ### Linked extents | |
| 672 | 672 | ||
| 673 | 673 | Using the `TChartExtentLink` component, you can ensure that the logical extents of several charts enumerated by the `LinkedCharts` property always stay the same. In Laz 2.1+ the component is extended to provide an additional property `AlignSides` which adjusts the `LabelSize` properties of aligned charts such that the corresponding sides of the plot area are aligned, too. (When property `AlignMissingAxes` is `true` (default) dummy axes are created for those sides having no axes so that alignment works for these sides, too). | |
| 674 | 674 | ||
| 675 | 675 | This is useful for simulating multi-pane chart layouts. See "panes" demo for an example. | |
| 676 | 676 | ||
| 677 | 677 | ### Margins | |
| 678 | 678 | ||
| 679 | 679 | *Margin* is a distance reserved around the edges of rectangular region. Margins are measured in image units (usually pixels). The chart itself has two kinds of margins: | |
| 680 | 680 | ||
| 681 | 681 | - Internal (`Margins` property) -- applied after axis drawing. Are also influenced by series marks and series themselves. | |
| 682 | 682 | - External (`MarginsExternal` property) -- applied before axis drawing. Are also influenced by axis marks and arrows. | |
| 683 | 683 | ||
| 684 | 684 | Other chart elements, such as legend, title, footer and labels, have margins, too. | |
| 685 | 685 | ||
| 686 | 686 | ### Optimization notes | |
| 687 | 687 | ||
| 688 | 688 | Calculation of `CurrentExtent` and actual margins is a non-trivial *iterative* process (see `TChart.PrepareAxis` code for details). Although usually fast, in complex cases it can require multiple passes through chart sources. | |
| 689 | 689 | ||
| 690 | 690 | ### Graphical explanation | |
| 691 | 691 | ||
| 692 | - | ||
| 693 | 692 | <tbody> | |
| 694 | - | ||
| 695 | - | ||
| 693 | + | ||
| 696 | 694 | 2 = Chart.LeftAxis.Margin<br /> | |
| 697 | 695 | 3 = Chart.LeftAxis.Title.Margins.Top <br /> | |
| 698 | 696 | 4 = Chart.LeftAxis.Title.Distance<br /> | |
| 699 | 697 | 5 = Chart.LeftAxis.LabelSize<br /> | |
| 700 | 698 | 6 = Chart.Margins.Left<br /> | |
| 701 | 699 | 7 = Autosized</p></td> | |
| 702 | - | ||
| 703 | - | ||
| 704 | - | ||
| 705 | - | ||
| 706 | - | ||
| 700 | + | ||
| 707 | 701 | </tbody> | |
| 708 | - | ||
| 709 | 702 | ||
| 710 | 703 | ## Tools | |
| 711 | 704 | ||
| 712 | 705 | Chart tools define how the chart reacts to various user actions, primarily mouse movements and clicks. You can see examples of tools usage in the "tools" or "barseriestools" demos. | |
| 713 | 706 | ||
| 714 | 707 | Tools are grouped in a `TChartToolset` component, which should be assigned to the chart's `Toolset` property. The same toolset can be used in several charts. | |
| 715 | 708 | ||
| 716 | 709 | If `Toolset` is unassigned, for compatibility reasons a built-in toolset consisting of zoom drag and pan drag tools is used; these builtin tools can be turned off individually by setting the chart properties `AllowZoom` and/or `AllowPanning` to `false`, respectively (the latter is available only after Lazarus v2.2+). | |
| 717 | 710 | ||
| 718 | 711 | In each user action, tools in the toolset are processed in order, and for each tool: | |
| 719 | 712 | ||
| 720 | 713 | - If `Enabled=false`, the tool is ignored. | |
| 721 | 714 | - If `Shift` is not equal to the current shift state, the tool is ignored. | |
| 722 | 715 | - Tool is requested to process the action. | |
| 723 | 716 | - If the tool signals that the action is handled, processing is stopped, otherwise it continues to the next tool. This way, tools with the same `Shift` value may be differentiated based on special activation conditions. For example, some drag tools may be configured to not activate on a simple click, leaving the click event available for other actions. | |
| 724 | 717 | - Finally, if no suitable tool is found, the chart's event handler is called. Note that this means that chart event handlers will only work with all tools disabled. Generally it is recommended to use tools for interactivity, chart events are left mostly for compatibility. | |
| 725 | 718 | ||
| 726 | 719 | In your application you can create, for example, a toolbar with each button enabling the corresponding tool in the toolset and disabling all others. Alternatively, by assigning different `Shift` values, you can enable several tools at once. | |
| 727 | 720 | ||
| 728 | 721 | Some tools publish the `EscapeCancels` property which, if set to `true`, cancels the tool operation if the user pressed the ESC key. | |
| 729 | 722 | ||
| 730 | 723 | ### Keyboard handling in tools | |
| 731 | 724 | ||
| 732 | 725 | Besides mouse events, some tools may react on key presses -- for example, crosshair tool with `Shift = [ssCtrl]` will display crosshairs when the CTRL key is pressed, without mouse buttons. Unfortunately, the chart must be focused to receive keyboard events. This means that after the user interacted with other controls on the same form, the chart stops reacting on keyboard-only events. | |
| 733 | 726 | ||
| 734 | 727 | To prevent this, you can either call the `Chart.SetFocus` method, or set `Chart.AutoFocus = true`, which will make a chart grab the focus when the mouse moves over it. | |
| 735 | 728 | ||
| 736 | 729 | ### Drawing mode | |
| 737 | 730 | ||
| 738 | 731 | Some tools, such as zoom drag or crosshair, display moving shapes over the chart with the mouse movement. | |
| 739 | 732 | ||
| 740 | 733 | There are two ways to display those shapes: either simply draw them over the chart, fully redrawing the chart upon each mouse movement, or use `pmXor` pen mode to draw and erase the shape directly from the `MouseMove` event handler. The former method allows to use arbitrary pen color and style, but the latter is much more efficient. Additionally, some widgetsets ignore all drawing outside the `Paint` event, in such a case the latter method will not work at all. | |
| 741 | 734 | ||
| 742 | 735 | The display method is controlled by the `DrawingMode` property with the following values: | |
| 743 | 736 | ||
| 744 | 737 | - `tdmXor` -- use XOR method; | |
| 745 | 738 | - `tdmNormal` -- use full chart redraw; | |
| 746 | 739 | - `tdmDefault` -- use XOR method on widgetsets where it is known to work (Windows and Gtk) and full redraw on others. | |
| 747 | 740 | ||
| 748 | 741 | ### Extent tools | |
| 749 | 742 | ||
| 750 | 743 | Extent tools modify the chart's logical extent. | |
| 751 | 744 | ||
| 752 | 745 | Zooming tools can be animated by setting `AnimationSteps` to a value greater then `1` and specifying an appropriate `AnimationInterval` in milliseconds. | |
| 753 | 746 | ||
| 754 | 747 | In the zooming tools, adapt the `LimitToExtent` property to restrict zooming to the chart's full extent on all or some directions. The same property is available also in the panning tools for the corresponding purpose when the viewport is panned. | |
| 755 | 748 | ||
| 756 | 749 | #### Zoom drag tool | |
| 757 | 750 | ||
| 758 | 751 | `TZoomDragTool` allows the user to zoom in by drawing a rectangle with the mouse. The rectangle then becomes the new logical extent. | |
| 759 | 752 | ||
| 760 | 753 | Restoration of the zooming to the full extent can be achieved by several actions, controlled by the `RestoreExtentOn` property: | |
| 761 | 754 | ||
| 762 | 755 | - `zreDragTopLeft`, `zreDragTopRight`, `zreDragBottomLeft`, `zreDragBottomRight` -- dragging in the specified direction, | |
| 763 | 756 | - `zreClick` -- clicking without dragging, | |
| 764 | 757 | - `zreDifferentDrag` -- dragging in a direction different from the one used to zoom in. | |
| 765 | 758 | ||
| 766 | 759 | By default, `RestoreExtentOn = [zreClick, zreDragTopLeft, zreDragTopRight, zreDragBottomLeft]` which means that the full extent is restored either by clicking or by drawing a rectangle in any direction except from top-left to bottom-right. | |
| 767 | 760 | ||
| 768 | 761 | To get a behavior compatible with earlier versions of Delphi's TeeChart, specify `RestoreExtentOn = [zreDragTopLeft, zreDragTopRight, zreDragBottomLeft]`. | |
| 769 | 762 | ||
| 770 | 763 | To get a behavior compatible with newer versions of TeeChart, specify `RestoreExtentOn = [zreDifferentDrag]`. | |
| 771 | 764 | ||
| 772 | 765 | The enumerated property `RatioLimit` (`(zrlNone, zrlProportional, zrlFixedX, zrlFixedY`) lets you restrict zooming to one of the coordinates, or makes the zooming process keep the original proportions. In such a case of restricted zooming the zoom rectangle is drawn in the fixed direction across the entire chart when the property `AdjustSelection` is at its default value `true`; otherwise the zoom rectangle would be drawn between the mouse start and end points, like in the unrestricted case. | |
| 773 | 766 | ||
| 774 | 767 | #### Zoom click tool | |
| 775 | 768 | ||
| 776 | 769 | `TZoomClickTool` allows the user to zoom in or out by clicking on the chart with the mouse. `ZoomFactor` is the scaling multiplier applied by the tool where factors below 1 represent "zoom out", and factors above represent "zoom in". | |
| 777 | 770 | ||
| 778 | 771 | `ZoomRatio` allows to create a non-proportional zooming effect by specifiying the ratio of X to Y scale. In other words, the X zoom factor is given by the property `ZoomFactor`, the Y zoom factor is the product `ZoomFactor*ZoomRatio`. | |
| 779 | 772 | ||
| 780 | 773 | - In particular, to **zoom only horizontally**, the Y zoom factor must be 1, i.e. `ZoomFactor*ZoomRatio = 1` or `ZoomRatio = 1/ZoomFactor`. For example, when your `ZoomFactor` for the X axis is 1.1, then `ZoomRatio` must be 1/1.1 = 0.909. | |
| 781 | 774 | - Similarly, to **zoom only vertically**, the X factor must be 1, i.e. `ZoomFactor = 1`, and you can use `ZoomRatio` alone to determine the Y zoom factor. | |
| 782 | 775 | - And finally, in the normal case, when X and Y should zoom by the same ratio, keep `ZoomRatio` at 1 and determine the overall zoom factor by the `ZoomFactor` alone. | |
| 783 | 776 | ||
| 784 | 777 | If `FixedPoint` is true, the location of the mouse click is used as a fixed point for zooming, otherwise the chart image center is used instead. | |
| 785 | 778 | ||
| 786 | 779 | #### Zoom mouse-wheel tool | |
| 787 | 780 | ||
| 788 | 781 | `TZoomMouseWheelTool` allows the user to zoom in and out with the mouse wheel. Its properties are identical to the zoom click tool. | |
| 789 | 782 | ||
| 790 | 783 | The chart is scaled by `ZoomFactor` when the user scrolls the mouse wheel up, and by `1/ZoomFactor` when the user scrolls the mouse wheel down. | |
| 791 | 784 | ||
| 792 | 785 | #### Pan drag tool | |
| 793 | 786 | ||
| 794 | 787 | `TPanDragTool` allows the user to move the logical extent by dragging the mouse in the directions indicated by the `Directions` property. | |
| 795 | 788 | ||
| 796 | 789 | Use the `MinDragRadius` property to distinguish dragging from clicking. | |
| 797 | 790 | ||
| 798 | 791 | #### Pan click tool | |
| 799 | 792 | ||
| 800 | 793 | `TPanClickTool` allows the user to move the logical extent by clicking inside a range of `Margins` pixels from the corresponding border of the chart image. | |
| 801 | 794 | ||
| 802 | 795 | The panning offset is determined by the distance from the edge of the chart (the nearer to the edge, the greater). Setting `Interval` in milliseconds will allow to continue panning with the given interval until the mouse button is up. | |
| 803 | 796 | ||
| 804 | 797 | #### Pan mouse wheel tool | |
| 805 | 798 | ||
| 806 | 799 | `TPanMouseWheelTool` allows the user to move the logical extent by scrolling the mouse wheel. | |
| 807 | 800 | ||
| 808 | 801 | The extent is moved in `WheelUpDirection` when the wheel is scrolled up and in the opposite direction when the wheel is scrolled down. | |
| 809 | 802 | ||
| 810 | 803 | The movement speed is controlled by `Step` property. | |
| 811 | 804 | ||
| 812 | 805 | ### Data tools | |
| 813 | 806 | ||
| 814 | 807 | Data tools are linked to specific data series via the `AffectedSeries` property, which is a string of comma-separated series indexes. Note that indexes may change if you add or remove series. Having `AffectedSeries` empty means that the tools operate on every series in the chart. | |
| 815 | 808 | ||
| 816 | 809 | When a data tool is activated, it determines the nearest point of the affected series which is located inside of the `GrabRadius` (in pixels). | |
| 817 | 810 | ||
| 818 | 811 | Using the set `Targets: TNearestPointTargets` it can be controlled which part of a complex series must be hit: | |
| 819 | 812 | ||
| 820 | 813 | - `nptPoint`: The tool must hit the data point at (x, y). | |
| 821 | 814 | - `nptXList`: If the series' source has several x values the tool must hit any of the values in the XList. | |
| 822 | 815 | - `nptYList`: If the series' source has several y values the tool must hit any of the values in the YList. | |
| 823 | 816 | - `nptCustom`: Meant for special effects depending on the series. In case of a bar series, for example, the function `GetNearestPoint` is overridden to accept hits inside series bars if this option is set. | |
| 824 | 817 | ||
| 825 | 818 | All options are on by default. For further control, most series have the same set of Targets, named `ToolTargets`. An option must be included in the targets of both tool and series to be active. This way tools can be shared with series reacting differently on each option. See "barseriestools" demo as an example. | |
| 826 | 819 | ||
| 827 | 820 | For large series, the efficiency can be improved by using a sorted source, a small `GrabRadius` and a `DistanceMode<>cdmOnlyY`. | |
| 828 | 821 | ||
| 829 | 822 | #### Data point drag tool | |
| 830 | 823 | ||
| 831 | 824 | `TDataPointDragTool` allows the user to change data values by dragging the data point. Requires the series' data source to be a list source. | |
| 832 | 825 | ||
| 833 | 826 | You can use the `OnDrag` and `OnDragStart` events to limit drag direction or grab area. | |
| 834 | 827 | ||
| 835 | 828 | See "dragdrop" demo for an example. | |
| 836 | 829 | ||
| 837 | 830 | #### Data point click tool | |
| 838 | 831 | ||
| 839 | 832 | `TDataPointClickTool` allows you to assign an `OnPointClick` event handler, which will be called when the user clicks on the data point. | |
| 840 | 833 | ||
| 841 | 834 | #### Data point hint tool | |
| 842 | 835 | ||
| 843 | 836 | `TDataPointHintTool` displays a hint when the user moves the mouse over the data point. The hint is either equal to the data point label (if `UseDefaultHintText=true`) or determined by calling the `OnHint` event handler. In the former case, the `Style` property of the series' `Marks` must be set to something different from `smsNone`. (You can turn off directly displaying all the series marks in the chart by selecting the series' `Marks.Visible = false`). | |
| 844 | 837 | ||
| 845 | 838 | By default, this tool displays a separate hint window, independent from the application hint. To use a single hint window per application, you may set `UseApplicationHint=true`. | |
| 846 | 839 | ||
| 847 | 840 | Note that the application-level hint does not work in combination with modifier keys and mouse buttons, so the hint is displayed only if no buttons are pressed (i.e. `Shift` property must be empty when `UseApplicationHint=true`). | |
| 848 | 841 | ||
| 849 | 842 | #### Data point crosshair tool | |
| 850 | 843 | ||
| 851 | 844 | `TDataPointCrosshairTool` displays a cross-hair centered on the data point. It replaces the "reticule" found in older versions of TAChart. | |
| 852 | 845 | ||
| 853 | 846 | #### Data point distance tool | |
| 854 | 847 | ||
| 855 | 848 | `TDataPointDistanceTool` allows to measure and display a distance between two points on the chart. | |
| 856 | 849 | ||
| 857 | 850 | ### Chart element tools | |
| 858 | 851 | ||
| 859 | 852 | #### Axis click tool | |
| 860 | 853 | ||
| 861 | 854 | This tool fires an event `OnClick` when the user clicks on an axis or its title. The event has the clicked axis and a set of `TAxisHitTest` elements as parameters: | |
| 862 | 855 | ||
| 863 | 856 | - `ahtTitle`: click on the axis title | |
| 864 | 857 | - `ahtLine`: click on the axis line (allowed tolerance defined by the tool's `GrabRadius` or the axis' `TickLength` and `InnerTickLength` whichever is greater). | |
| 865 | 858 | - `ahtLabels`: click into the label area of the axis. It is not distinguished whether a label is clicked or the empty space between the labels. | |
| 866 | 859 | - `ahtAxisStart`: the click on the line or label area occured in the first quarter of the axis length | |
| 867 | 860 | - `ahtAxisCenter`: the click on the line or label area occured in the center part (two quarters) of the axis length | |
| 868 | 861 | - `ahtAxisEnd`: the click on the line or label area occured in the last quarter of the axis length. | |
| 869 | 862 | ||
| 870 | 863 | If you do not want an axis to register clicks on some of these elements you can remove them from the `EnabledHitTests` property of the axis. | |
| 871 | 864 | ||
| 872 | 865 | #### Title/footer click tool | |
| 873 | 866 | ||
| 874 | 867 | An `OnClick` event is created when the user clicks on the title or footer of a chart. The event has the clicked title/footer as parameter. | |
| 875 | 868 | ||
| 876 | 869 | #### Legend click tool | |
| 877 | 870 | ||
| 878 | 871 | Generates an `OnClick` event when a click on the chart's legend has occured. The event has the legend as a parameter. | |
| 879 | 872 | ||
| 880 | 873 | Moreover an `OnSeriesClick` event fires when a legend item is clicked and the item is associated with a series; the series is passed to the event handler as a parameter. The series parameter can be nil when empty space or a non-series item (group header) is clicked. Requires Lazarus version 2.3 or newer. | |
| 881 | 874 | ||
| 882 | 875 | When both events are assigned, only `OnSeriesClick` is fired. | |
| 883 | 876 | ||
| 884 | 877 | #### Datapoint marks click tool | |
| 885 | 878 | ||
| 886 | 879 | Fires the event `OnPointClick` when the user clicks on the marks of a series. It is useful for crowded charts in which a series with marks is covered by others and is to be moved to the top of the z order so that all marks can be read. Requires Lazarus version 2.3 or newer. | |
| 887 | 880 | ||
| 888 | 881 | ### User defined tool | |
| 889 | 882 | ||
| 890 | 883 | To add your own tool, either inherit from `TUserDefinedTool` or use it directly, assigning one or more On{After,Before}{KeyDown,KeyUp,MouseDown,MouseMove,MouseUp,MouseWheelDown,MouseWheelUp} event handlers. | |
| 891 | 884 | ||
| 892 | 885 | Call the `Handled` method of the tool to indicate that no further processing of the event should be done. | |
| 893 | 886 | ||
| 894 | 887 | ## Decorative elements | |
| 895 | 888 | ||
| 896 | 889 | ### Title and footer | |
| 897 | 890 | ||
| 898 | 891 | Chart title and footer are multi-line texts appearing above and below the chart correspondingly. They support various rotations and alignments, as well as the boolean `WordWrap` property to wrap text wider than the chart into multiple lines. | |
| 899 | 892 | ||
| 900 | 893 | Normally the title/footer background tightly encloses the text; it can be expanded to run across the entire width of the chart by setting the `FullWidth` property to `true`. | |
| 901 | 894 | ||
| 902 | 895 | #### HTML | |
| 903 | 896 | ||
| 904 | 897 | If the Lazarus version is 1.8 or newer then html entities and some html tags can be embedded into the title/footer texts for a variety of additional formatting options. This feature is turned on by switching the property `TextFormat` to `tfHTML`. In addition to header/footer texts it is available also for axis captions, axis marks, series marks and legend texts/series titles. | |
| 905 | 898 | ||
| 906 | 899 | - Non-standard charcters can be embedded using the corresponding **html entities**, i.e. as codes beginning with an ampersand (&), a standardized appreviation of the character name (or its hex or decimal unicode value), and ending with a semicolon (;). A list of all html entities can be found at <http://unicode.e-workers.de/entities.php>.\ | |
| 907 | 900 | *Example*: The text `sin 2α = 2 sin α cos α` is displayed as "sin 2α = 2 sin α cos α" | |
| 908 | 901 | - `<sub>...</sub>` displays the enclosed text as **subscript**.\ | |
| 909 | 902 | *Example:* `H<sub>2</sub>O` is shown in the chart as "H<sub>2</sub>O" | |
| 910 | 903 | - `<sup>...</sup>` displays the enclosed text as **superscript**.\ | |
| 911 | 904 | *Example:* `cm<sup>2</sup>` is shown in the chart as "cm<sup>2</sup>" | |
| 912 | - | ||
| 913 | - | ||
| 914 | - | ||
| 905 | + | - `<b>...</b>` displays the enclosed text with **bold** type face. \ | |
| 906 | + | Likewise, the tags \<i\>...\</i\>, \<u\>...\</u\>, \<s\>...;\</s\> can be used to format portions of the text as italic, underlined, and strike-out\ | |
| 907 | + | *Example:* `Plot of <b>x</b> <i>vs.</i> <b>y</b>` is shown in the chart as "Plot of x vs. y" | |
| 915 | 908 | - The `<font>...</font>` tags can be used to modify the font of the enclosed text: | |
| 916 | - | ||
| 909 | + | - **Text color**: The embedded `This text is <font color="red">RED</font>` displays the enclosed text in red color, i.e. like "This text is RED". Specify the color by the most typical color names or by the html hex color codes of rgb values, in the format `#rrggbb` or `#rgb` where r, g, b are hex bytes for the red, green and blue color components. The three-digit codes `#rgb` are equivalent to the six-digit codes `#rrggbb` where both digits of the same component are equal. | |
| 917 | 910 | - The **font name** can be specified by the `name` attribute. | |
| 918 | 911 | - The **font size** is controlled by the `size` attribute. It can take the values "x-small", "small", "medium", "large", "x-large", "xx-large" for font sizes 7, 10, 12, 14, 18, 24pt, respectively. Alternatively, the point or pixel size can be specified directly if "pt" or "px", respectively, is appended. | |
| 919 | 912 | - *Example:* This code adds a two-line footer in which the 2nd line is in blue, 8-pt, underlined Times New Roman: | |
| 920 | 913 | ||
| 921 | 914 | ``` pascal | |
| 922 | 915 | Chart.Foot.Text.Clear; | |
| 923 | 916 | Chart.Foot.Text.Add('Reference:'); | |
| 924 | 917 | Chart.Font.Text.Add('<font name="Times New Roman" size="8pt" color="blue"><u>www.freepascal.org/</u></font>'); | |
| 925 | 918 | ``` | |
| 926 | 919 | ||
| 927 | 920 | > **Warning:** It is not recommended to switch font name and font size within the same line because TAChart drawers cannot exactly align the base line of characters in different fonts and font sizes | |
| 928 | 921 | ||
| 929 | 922 | The demo application in folder *demo/html* of the Lazarus installation heavily makes use of embedded HTML codes. | |
| 930 | 923 | ||
| 931 | 924 | ### Legend | |
| 932 | 925 | ||
| 933 | 926 | Chart legend is a table with each item containing an icon and a text line. Grid lines may be controlled by `GridHorizontal` and `GridVertical` properties. | |
| 934 | 927 | ||
| 935 | 928 | Legend supports various alignments and can be located inside the chart or on the sidebar. Legend can be displayed in two or more columns by setting `ColumnCount` property. Setting `ColumnCount` to a very large value effectively creates "horizontal" legend. | |
| 936 | 929 | ||
| 937 | 930 | Legend items are generated based on chart series which have both `Active` and `ShowInLegend` set to true. Depending on `Legend.Multiplicity` series can produce a single item or one item per point. | |
| 938 | 931 | ||
| 939 | 932 | Legend items can be grouped together under sub-headers. Sub-headers are taken from `GroupNames` property, and each series can use `Legend.GroupIndex` property to indicate its group. | |
| 940 | 933 | ||
| 941 | 934 | Legend items are sorted as following: | |
| 942 | 935 | ||
| 943 | 936 | - By group index, items without group (`GroupIndex=-1`) going first to avoid confusion with the last group. | |
| 944 | 937 | - By `Order` property, items without explicit order (`Order=-1`) going last. | |
| 945 | 938 | - By creation order of series. | |
| 946 | 939 | - For multiple items per series, by generation order (for standard series it is the order of points). | |
| 947 | 940 | ||
| 948 | 941 | Sorted items are then added to the legend table in either by rows or by columns depending on the `ItemFillOrder` property. | |
| 949 | 942 | ||
| 950 | 943 | #### Legend item text | |
| 951 | 944 | ||
| 952 | 945 | The text of a legend item is generated by the corresponding series based on the `Legend.Format` property. This property is used as a first argument for the [`SysUtils.Format`](http://www.freepascal.org/docs-html/rtl/sysutils/format.html) function, with the second argument containing following data items: | |
| 953 | 946 | ||
| 954 | 947 | - For per-series multiplicity: | |
| 955 | 948 | - 0: Series `Title` | |
| 956 | 949 | - 1: Series `Index` | |
| 957 | 950 | - For per-point multiplicity: | |
| 958 | 951 | - Same as mark labels | |
| 959 | 952 | ||
| 960 | 953 | If the property `TextFormat` is switched to `tfHTML` then HTML entities and tags can be embedded for special formatting of legend texts. See HTML for details. | |
| 961 | 954 | ||
| 962 | 955 | #### User-defined legend items | |
| 963 | 956 | ||
| 964 | 957 | Arbitrary legend items can be generated by overriding `OnCreate` and `OnDraw` events of series `Legend` property. | |
| 965 | 958 | ||
| 966 | - | ||
| 959 | + | Note that user-defined item count is controlled solely by \<codettUserItemsCount property and does not depend on `Multiplicity`. Also note that `GroupIndex` and `Order` properties are actually per-item, so you can totally override entire legend from a single (perhaps fictive) series. | |
| 967 | 960 | ||
| 968 | 961 | ### Arrows | |
| 969 | 962 | ||
| 970 | 963 | Arrowheads can be drawn at the end of axis lines, constant lines, mark links, etc. It is controlled by `TChartAxis.Arrow`, `TConstantLine.Arrow`, `TChartMarks.Arrow` correspondingly. | |
| 971 | 964 | ||
| 972 | 965 | Arrowhead shape is determined by `Width`, `Length` and `BaseLength` properties, for example: | |
| 973 | 966 | ||
| 974 | 967 | - Thin wedge: `BaseLength = 0` | |
| 975 | 968 | - Triangle: `BaseLength = Length` | |
| 976 | 969 | - Rhombus: `BaseLength = 2 * Length` | |
| 977 | 970 | - Inverted Triangle: `BaseLength > 0`, `Length = 0` | |
| 978 | 971 | ||
| 979 | 972 | This image shows these arrows created for `Length=10` and `Width=5`.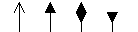\ | |
| 980 | 973 | ||
| 981 | 974 | ### Transparency | |
| 982 | 975 | ||
| 983 | 976 | `Transparency` property of the series represents a level of transparency from 0 (fully opaque) to 255 (fully transparent -- i.e. invisible). | |
| 984 | 977 | ||
| 985 | 978 | **Compatibility note**: FPVectorial and TFPCanvas drawers currently do not support transparency because of limitations of the underlying libraries. Printer and WMF drawers can not support transparency in principle. | |
| 986 | 979 | ||
| 987 | 980 | **Optimization note**: Transparency support in the LCL is rudimentary, so current TCanvas drawer implementation may be slow with many transparent series and large charts. To improve efficiency, it is recommended to use as few different transparency levels as possible and to not interleave series with different transparencies. Alternatively, use BGRABitmap as back-end, since it has faster transparency implementation. | |
| 988 | 981 | ||
| 989 | 982 | ### ChartStyles | |
| 990 | 983 | ||
| 991 | 984 | `TChartStyles` can be employed to control the appearance of the "layers" of area, line, polar, b-spline and bar series with multiple y values. There are properties to define the `Brush`, `Pen`, `Pointer`, `Font` and `Text` for each layer. Boolean `UseBrush`, `UsePen`, `UsePointer` and `UseFont` properties are available to revert to the corresponding series settings (if `false`). `Font` is the font of the series labels in that particular layer. `Text` is used as legend text when the `Legend.Multiplicity` of the associated series has been set to `lmStyle`. The event `OnAddStyleToLegend` is meant to exclude a particular series level from the legend if required (set the event argument `ShowInLegend` to `false`). | |
| 992 | 985 | ||
| 993 | 986 | ChartStyles can also be used to color the regions between axis ticks in a banded way. | |
| 994 | 987 | ||
| 995 | 988 | A special application exists also for `TBarSeries` (which must have a single layer in this case), `TBubbleSeries` and `TPieSeries`: When `Styles` is not `nil` for these series types, the styles define the formatting of individual data points. This way, for example, the fill pattern of pies in a TPieSeries can be varied from slice to slice.\ | |
| 996 | - | ||
| 997 | 989 | ||
| 998 | 990 | ## Marks | |
| 999 | 991 | ||
| 1000 | 992 | Marks annotate certain points of the chart. These points can be defined by a series or an axis. Typically, mark consists of some graphical element (such as an axis tick) and a text label. However, either of these elements can be omitted. | |
| 1001 | 993 | ||
| 1002 | 994 | You can see examples in the "labels" demo. | |
| 1003 | 995 | ||
| 1004 | 996 | ### Mark labels | |
| 1005 | 997 | ||
| 1006 | 998 | The label text can be enclosed in a box, controlled by `LabelBrush` and `Frame` properties. The text itself is created based on the data source items, with the help of `Format` property. This property is used as a first argument for the [`SysUtils.Format`](http://www.freepascal.org/docs-html/rtl/sysutils/format.html) function, with the second argument containing following data items: | |
| 1007 | 999 | ||
| 1008 | 1000 | - 0: Y | |
| 1009 | 1001 | - 1: Y as a percentage of the Y total | |
| 1010 | 1002 | - 2: Text | |
| 1011 | 1003 | - 3: Y total | |
| 1012 | 1004 | - 4: X | |
| 1013 | 1005 | ||
| 1014 | 1006 | Where "Y total" is the sum of all Y values for this source. Note that not all sources supply all the items above. | |
| 1015 | 1007 | ||
| 1016 | 1008 | Some pre-defined formats can be set via the `Style` property. | |
| 1017 | 1009 | ||
| 1018 | 1010 | If the source is mutli-valued, `YIndex` property determines which Y value is used. If `YIndex = -1`, a separate label is displayed for each Y value, which is useful for stacked series. The `Text` element of the source's `TChartDataItem` records can contain indidual texts for each Y value level; they must be separated by the `LabelSeparator` defined by the chart source (by default `'|'`). | |
| 1019 | 1011 | ||
| 1020 | 1012 | The built-in predefined label texts can be overridden by provding a handler for the `OnGetMark`/`OnGetMarkText` events of the series. Note that `OnGetMark` has been deprecated in Laz v3.99 to be replaced by event `OnGetMarkText` which gives access to more parameters. | |
| 1021 | 1013 | ||
| 1022 | 1014 | The text is rendered using the `LabelFont`. Note in particular that TAChart supports arbitrary font `Orientation`. | |
| 1023 | 1015 | ||
| 1024 | 1016 | Mark labels are usually included in margins calculation to guarantee that all labels fit in the viewport. This behavior can be turned off by setting `AutoMargins` property to `false`. | |
| 1025 | 1017 | ||
| 1026 | 1018 | #### Multi-line marks | |
| 1027 | 1019 | ||
| 1028 | 1020 | If the mark text contains [`LineEnding`](http://www.freepascal.org/docs-html/rtl/system/lineending.html) character sequence, it is split into several lines. Lines of different length are aligned according to `Alignment` property. | |
| 1029 | 1021 | ||
| 1030 | 1022 | #### HTML codes in marks | |
| 1031 | 1023 | ||
| 1032 | 1024 | If the property `TextFormat` is switched to `tfHTML` then HTML entities and tags can be embedded for special formatting of marks. See HTML for details. | |
| 1033 | 1025 | ||
| 1034 | 1026 | ### Mark positions and attachment | |
| 1035 | 1027 | ||
| 1036 | 1028 | The mark position relative to the marked point is determined by the marks owner (series or axis). | |
| 1037 | 1029 | ||
| 1038 | 1030 | Common mark properties include `Distance`, which measures the distance from the origin point to the attachment point in image units, and `Attachment`, which controls whether the attachment point is considered to be in the center or at the edge of the label box. | |
| 1039 | 1031 | ||
| 1040 | 1032 | Additionally, basic chart series have a property `MarkPositions` specifying the direction of labels' offsets relative to series data points as following: | |
| 1041 | 1033 | ||
| 1042 | 1034 | - `lmpOutside` -- away from the center of the data points cloud; for TBarSeries and TAreaSeries it has a special meaning: away from the ZeroLevel defined for this series. | |
| 1043 | 1035 | - `lmpPositive` -- positive direction of series' Y axis | |
| 1044 | 1036 | - `lmpNegative` -- negative direction of series' Y axis | |
| 1045 | 1037 | - `lmpInside` -- towards the center of the data points cloud; for TBarSeries and TAreaSeries: towards the ZeroLevel | |
| 1046 | 1038 | ||
| 1047 | 1039 | In Lazarus 2.0+, TBarSeries and TAreaSeries have an additional property `MarkPositionCentered` which allows to center the marks origins between data points and zero level. In order to place marks exactly at the center of the bars of a BarSeries or at the center of the drop line of an AreaSeries, the following properties must be changed additionally: `Marks.Distance = 0`, and `Marks.Attachment = maCenter`. | |
| 1048 | 1040 | ||
| 1049 | 1041 | ### Rotation of marks | |
| 1050 | 1042 | ||
| 1051 | 1043 | Marks can be rotated by any angle in a resolution of 1/10 degree by modifying the `Orientation` of their font; it is specified by the 10-fold value in degrees, i.e. the value 450 refers to an angle of 45°. 0° means horizontal orientation, the angle increases in the counter-clockwise direction. | |
| 1052 | 1044 | ||
| 1053 | 1045 | The rotation normally occurs with respect to the center of the label. Axis and series marks additionally have a property `RotationCenter` to shift the center of rotation to an edge of the text: | |
| 1054 | 1046 | ||
| 1055 | 1047 | - `raCenter` -- default setting, i.e. rotation occurs around the text center | |
| 1056 | 1048 | - `raLeft` -- the rotation center is at the left edge of the label. | |
| 1057 | 1049 | - `raRight` -- the rotation center is at the right edge of the text. | |
| 1058 | 1050 | - `raEdge` -- ignored in case of series marks (will be replaced by raLeft). But in case of axis marks the center of rotation is automatically moved to the text start or end in order to avoid rotation of the label into the chart. | |
| 1059 | 1051 | ||
| 1060 | 1052 | ## Drawers | |
| 1061 | 1053 | ||
| 1062 | 1054 | For low-level drawing routines, TAChart uses special set of classes implementing `IChartDrawer` interface. This allows such features as printing charts and exporting them to SVG format. | |
| 1063 | 1055 | ||
| 1064 | 1056 | These classes are called *drawing back-ends* or *drawers* for short. | |
| 1065 | 1057 | ||
| 1066 | 1058 | ### TCanvas drawer | |
| 1067 | 1059 | ||
| 1068 | 1060 | `TCanvasDrawer` is the default drawer used to display chart on TCanvas. This includes screen and various raster image formats. The image produced by this drawer is used as a reference when developing and debugging other back-ends. | |
| 1069 | 1061 | ||
| 1070 | 1062 | ### TFPCanvas drawer | |
| 1071 | 1063 | ||
| 1072 | 1064 | `TFPCanvasDrawer` is similar to TCanvas drawer, but based on `TFPCanvas` (which is a `TCanvas` analog implemented in the FCL instead of the LCL). | |
| 1073 | 1065 | ||
| 1074 | 1066 | See the "nogui" demo for an example. | |
| 1075 | 1067 | ||
| 1076 | 1068 | Although `TFPCanvas` and, correspondingly, `TFPCanvasDrawer` have a restricted implementation of some TAChart features, their important advantage is the possibility they offer of compiling an application with the nogui widgetset. This is particularly useful for Web applications, which can then generate raster chart images without any further graphic dependency, or a need to install X/Gtk/Qt on the server. | |
| 1077 | 1069 | ||
| 1078 | 1070 | ### SVG drawer | |
| 1079 | 1071 | ||
| 1080 | 1072 | `TSVGDrawer` produces text stream with the image of the chart in [SVG](https://en.wikipedia.org/wiki/SVG) format. Similarly to TFPCanvas drawer, it is independent of LCL and can be used in Web applications to generate vector charts in nogui widgetset. | |
| 1081 | 1073 | ||
| 1082 | 1074 | See "save" demo for an example. | |
| 1083 | 1075 | ||
| 1084 | 1076 | For this drawer, image unit is an SVG canvas unit instead of a pixel. | |
| 1085 | 1077 | ||
| 1086 | 1078 | Note that due to the nature of SVG, there is no way to measure font dimensions, so they are approximated crudely. This may result in problems like label text not fitting in the mark rectangle, especially in browsers like Firefox that do not support `textLength` attribute. | |
| 1087 | 1079 | ||
| 1088 | 1080 | ### OpenGL drawer | |
| 1089 | 1081 | ||
| 1090 | 1082 | `TOpenGLDrawer` draws chart on the current [OpenGL](https://en.wikipedia.org/wiki/OpenGL) context. It is suitable to be used in games and other OpenGL-only applications. | |
| 1091 | 1083 | ||
| 1092 | 1084 | OpenGL drawer expects, but does not set by itself, an orthogonal projection. See "opengl" demo for an example. | |
| 1093 | 1085 | ||
| 1094 | 1086 | Note that, like in OpenGL itself, `TOpenGLDrawer` font support is extremely limited. | |
| 1095 | 1087 | ||
| 1096 | 1088 | ### Printer drawer | |
| 1097 | 1089 | ||
| 1098 | 1090 | `TPrinterDrawer` draws chart on the printer canvas. It does not flush the page. | |
| 1099 | 1091 | ||
| 1100 | 1092 | Although printer canvas is a descendant of `TCanvas`, and so printing can be done using the default drawer, `TPrinterDrawer` does proper re-scaling of image coordinates according to printer vs screen DPI. | |
| 1101 | 1093 | ||
| 1102 | 1094 | You can use this drawer to export chart to PDF format using one of the available PDF writer products. | |
| 1103 | 1095 | ||
| 1104 | 1096 | See "print" demo for an example. | |
| 1105 | 1097 | ||
| 1106 | 1098 | Note that this drawer is located in a separate TAChartPrint package. | |
| 1107 | 1099 | ||
| 1108 | 1100 | ### AggPas drawer | |
| 1109 | 1101 | ||
| 1110 | 1102 | `TAggPasDrawer` draws chart using [AggPas library](http://www.crossgl.com/aggpas). | |
| 1111 | 1103 | ||
| 1112 | 1104 | AggPas offers high-speed antialiased drawing and is included in Lazarus sources. Unfortunately, the library is currently not maintained and there are some limitations in TAChart support. | |
| 1113 | 1105 | ||
| 1114 | 1106 | Note that this drawer is located in a separate TAChartAggPas package. | |
| 1115 | 1107 | ||
| 1116 | 1108 | ### BGRABitmap drawer | |
| 1117 | 1109 | ||
| 1118 | 1110 | `TBGRADrawer` draws chart using [[BGRABitmap]] library. | |
| 1119 | 1111 | ||
| 1120 | 1112 | BGRABitmap is recently created and actively developed graphics library, offering, in particular, anti-aliasing and rich selection of gradients. | |
| 1121 | 1113 | ||
| 1122 | 1114 | Currently BGRABitmap supports all TAChart features, but is somewhat slower then other drawing methods. | |
| 1123 | 1115 | ||
| 1124 | 1116 | Note that this drawer is located in a separate TAChartBGRA package, which depends on external `bgrabitmappack` package. | |
| 1125 | 1117 | ||
| 1126 | 1118 | ### FPVectorial drawer | |
| 1127 | 1119 | ||
| 1128 | 1120 | `TFPVectorialDrawer` draws chart using [[fpvectorial]] library. FPVectorial offers exporting to various vector formats, including SVG, PDF, CorelDraw and even instructions for metal cutting machines. | |
| 1129 | 1121 | ||
| 1130 | 1122 | It currently has some limitations in TAChart support, but is actively developed. | |
| 1131 | 1123 | ||
| 1132 | 1124 | Note that this drawer is located in a separate `TAChartFPVectorial` package, which depends on `fpvectorialpkg` package. | |
| 1133 | 1125 | ||
| 1134 | 1126 | ### WMF drawer | |
| 1135 | 1127 | ||
| 1136 | 1128 | `TWindowsMetafileDrawer` draws chart into a [Windows Metafile](https://en.wikipedia.org/wiki/Windows_Metafile). | |
| 1137 | 1129 | ||
| 1138 | 1130 | It uses WinAPI directly, and so will only work on Windows. WMF support has been added to fpvectorial which provides a cross-platform alternative to this package. | |
| 1139 | 1131 | ||
| 1140 | 1132 | ## Navigation | |
| 1141 | 1133 | ||
| 1142 | 1134 | Chart *navigation* consists of two parts: moving logical extent around without changing zoom factor, and visualizing the logical extent's position and size relative to the full extent. | |
| 1143 | 1135 | ||
| 1144 | 1136 | Moving extent (but not visualizing it) is possible by using panning tools. | |
| 1145 | 1137 | ||
| 1146 | 1138 | You can see examples in the "navigation" demo. | |
| 1147 | 1139 | ||
| 1148 | 1140 | ### Scroll bars | |
| 1149 | 1141 | ||
| 1150 | 1142 | `TChartNavScrollBar` is a `TCustomScrollBar` descendant with additional `Chart` property referencing the chart. `TChartNavScrollBar` synchronizes its position with chart extent in both directions. If the logical extent is equal to or larger than the full extent, navigation scroll bar does nothing. | |
| 1151 | 1143 | ||
| 1152 | 1144 | Setting `AutoPageSize = true` lets `TChartNavScrollBar` pick a page size proportional to the logical extent. | |
| 1153 | 1145 | ||
| 1154 | 1146 | Note that `Min` and `Max` properties are *not* changed automatically. It is recommended to set `Min = 0` and `Max` to some fairly large integer value to avoid rounding issues. Also note that `TChartNavScrollBar` does not automatically align or attach itself to a chart, so it can be arbitrarily positioned on the form. | |
| 1155 | 1147 | ||
| 1156 | 1148 | ### Navigation panel | |
| 1157 | 1149 | ||
| 1158 | 1150 | `TChartNavPanel` component displays logical and full extent of an assigned chart as differently colored rectangles, allowing user to drag the logical extent rectangle if `AllowDragNavigation = true`. | |
| 1159 | 1151 | ||
| 1160 | 1152 | If `MiniMap = true`, the panel additionally displays the chart series. | |
| 1161 | 1153 | ||
| 1162 | 1154 | `TChartNavPanel` can have arbitrary size, but it is recommended to keep height to width proportion the same as in the assigned chart. Setting `Proportional = true` will enforce the same proportions even if the above condition is not met, at the cost of some wasted space on the panel. | |
| 1163 | 1155 | ||
| 1164 | 1156 | ### Live View | |
| 1165 | 1157 | ||
| 1166 | 1158 |  Although not a navigation tool directly, `TChartLiveView` is related to navigation. In the case of a long array of incoming data it provides an easy way to display a viewport with only the most recent data while older data are flowing to the left out of the viewport. | |
| 1167 | 1159 | ||
| 1168 | 1160 | The viewport is updated whenever the full extent of the associated chart changes. However, when property `Active` is set to `false` the viewport is fixed -- this is a setting which allows the user to review older data, or change the extent while still new data are coming at the same time. | |
| 1169 | 1161 | ||
| 1170 | 1162 | Property `ViewportSize` defines the width of the visible viewport, in graph units. If set to 0, the width of the current `LogicalExtent` is used instead. | |
| 1171 | 1163 | ||
| 1172 | 1164 | The enumerated property `ExtentY = (lveAuto, lveFull, lveLogical)`, finally, determines the height of the viewport: | |
| 1173 | 1165 | ||
| 1174 | 1166 | - `lveAuto` adjusts the height to the visible data range automatically. This works also when the chart contains several y axes. When a `Range` is defined for an axis (i.e. by setting `axis.Range.Min`/`axis.Range.UseMin` and/or `axis.Range.Max`/`axis.Range.UseMax`) the component keeps it as long as series values are within this range. | |
| 1175 | 1167 | - `lveFull` freezes the height to the full extent of the chart. | |
| 1176 | 1168 | - `lveLogical` freezes the height to the logical extent of the chart. | |
| 1177 | 1169 | ||
| 1178 | 1170 | The methods `StoreAxisRange` and `RestoreAxisRange` are used for internal purposes because the component may change the `Range` parameters of an axis. Be careful when calling these methods because they may disrupt operation of the live view if not done properly. | |
| 1179 | 1171 | ||
| 1180 | 1172 | ## Additional components | |
| 1181 | 1173 | ||
| 1182 | 1174 | ### Legend panel | |
| 1183 | 1175 | ||
| 1184 | 1176 | `TChartLegendPanel` provides a legend which can be placed anywhere on the form. The legend is taken from the chart with is assigned to the property `Chart` of the LegendPanel. The chart’s own legend should be turned off. | |
| 1185 | 1177 | ||
| 1186 | 1178 | ### Chart listbox | |
| 1187 | 1179 | ||
| 1188 | 1180 | `TChartListbox` is a versatile legend replacement which displays an icon and the series title for each series of the chart attached to the property `Chart` of the listbox. But in addition to the standard legend, it also has checkboxes for each series. Unchecking a checkbox hides the associated series, checking it shows the series again. The listbox listens to changes in the associated chart and updates automatically. | |
| 1189 | 1181 | ||
| 1190 | 1182 | The property `CheckStyle` can be used to switch the listbox from a checkbox-like behavior (`cbsCheckbox`, an arbitrary combination of series can be checked) to a radiobutton-like behavior (`cbsRadioButton`, only a single series can be checked). Depending on `CheckStyle` either a radiobutton or a checkbox state icon is displayed for each series. | |
| 1191 | 1183 | ||
| 1192 | 1184 | Events are fired when the checkbox/radiobutton or the series title are clicked (`OnCheckboxClick` or `OnItemClick`, respectively), or when the series icon is double-clicked (`OnSeriesIconDblClick`). The latter event is thought to open a dialog for changing the series color, pointer style, series title etc. | |
| 1193 | 1185 | ||
| 1194 | 1186 | The listbox items are collected in a different way than for a conventional legend. The populating process ignores the series property `Legend.Visible` which controls whether the series is to be shown in the legend or not. Instead of it, there is an event `OnAddSeries` in which the `var` parameter `Skip` should be set to `true` if the series passed as another argument should be excluded from the listbox. Every series is listed only with a single item, i.e. the series’ `Multiplicity` is ignored as well. Moveover, grouping of items is not supported either. | |
| 1195 | 1187 | ||
| 1196 | 1188 | The order of listbox items is normally given by the order of series items in the chart's legend and thus depend on the chart's `Legend.Inverted` and the series' `Legend.Order` parameters. Moreover, items can be rearranged independently of the legend by calling the `ExchangeSeries(AIndex1, AIndex2)` method with the listbox indices as parameters. There is also a method `Sort` to sort the listbox by series titles (the sort order can be inverted by setting its optional `Descending` parameter, or `Chart.Legend.Inverted` to `true`. Note that the `Sort` method works only on the series having the default `Legend.Order` (-1). | |
| 1197 | 1189 | ||
| 1198 | 1190 | ### Chart image list | |
| 1199 | 1191 | ||
| 1200 | 1192 | `TChartImageList` collects the icons displayed for each series in the legend and can be used for imagelist-aware controls, such as treeviews, listviews or menus to show icons for each series. The icons are extracted from the chart which is assigned to the `Chart` property of the component. The image list is notified of changes in the chart and updates its images automatically whenever something changes with a series. The event `OnPopulate` is fired if the image list is rebuilt. | |
| 1201 | 1193 | ||
| 1202 | 1194 | Note that this kind of image list is *volatile*, i.e. its images are not stored in the form's lfm file. Nevertheless, at runtime, it can be used as a standard image list with other images. Just add these non-series images **before** assigning the chart to the image list. Use the property `FirstSeriesIndex` to get the image index of the first series contained in the image list. Alternatively, find the image index of a specific series by calling the function `ImageIndexOfSeries(series)`. | |
| 1203 | 1195 | ||
| 1204 | 1196 | In Laz 2.1+ the `TChartImageList` can be used also at designtime. It stores only those images not assigned to a series. | |
| 1205 | 1197 | ||
| 1206 | 1198 | ### Chart combobox | |
| 1207 | 1199 | ||
| 1208 | 1200 | The `TChartCombobox` is an extended combobox. Depending on the property `Mode` (`ccmPointerStyle`, `ccmPenStyle`, `ccmPenWidth`, `ccmBrushStyle`) it is populated with names and corresponding icons for pointer style, pen style, pen width or brush style selection. Therefore, it is useful for gui elements in which the user can modify the appearance of series and other chart objects. | |
| 1209 | 1201 | ||
| 1210 | 1202 | The combobox is not linked to a particular chart. Use the `OnChange` event to transfer the modified property to the series. | |
| 1211 | 1203 | ||
| 1212 | 1204 | ## TeeChart compatibility | |
| 1213 | 1205 | ||
| 1214 | 1206 | TeeChart is a standard set of charting components used by Delphi. Although TAChart does not have a goal to to be compatible with TeeChart, basic feature set and names are very similar, so simple examples may work in both libraries equivalently. | |
| 1215 | 1207 | ||
| 1216 | 1208 | More complex features -- in particular, multi-value series, series sources, multiple axes -- are implemented differently from TeeChart. This is by design and will not change. See [[Comparing TAChart with Delphi&|comparison page]] for more detailed info. | |
| 1217 | 1209 | ||
| 1218 | 1210 | To assist porting of TeeChart code to the TAChart, you can use `TAChartTeeChart` unit. It contains class helpers adding or emulating some TeeChart-specific properties and methods. | |
| 1219 | 1211 | ||
| 1220 | 1212 | Note that it is NOT recommended to use this unit for normal development, since the emulation is only intended to simulate the subset of features implemented in TeeChart, and may not be reliable when used in conjunction with the full set of TAChart features. | |
| 1221 | 1213 | ||
| 1222 | 1214 | ## Technical details | |
| 1223 | 1215 | ||
| 1224 | 1216 | ### Drawing order | |
| 1225 | 1217 | ||
| 1226 | 1218 | Chart drawing consists of three stages: | |
| 1227 | 1219 | ||
| 1228 | 1220 | 1. *Preparation*: At this stage, various internal data structures are initialized. | |
| 1229 | 1221 | 2. *Measurement*: At this stage, the chart calculates the sizes of all elements, and optimizes them for best presentation. Optimization may require several iterations, so the measurement stage is often the heaviest one both in terms of implementation complexity and running time. | |
| 1230 | 1222 | 3. *Drawing*: At this stage, the actual chart image is displayed. | |
| 1231 | 1223 | ||
| 1232 | 1224 | There also exists an ordering among various chart elements: | |
| 1233 | 1225 | ||
| 1234 | 1226 | 1. Background (using `TChart.Color` property). | |
| 1235 | 1227 | 2. Back-wall (using `TChart.BackColor` property). | |
| 1236 | 1228 | 3. Series and axes according to `ZPosition` property. For each series and axis, graphic elements are drawn before marks. Note that this protects marks against hiding by the axis/series they belong to, but not by other axes/series. | |
| 1237 | 1229 | 4. Legend. | |
| 1238 | 1230 | 5. Tools. | |
| 1239 | 1231 | ||
| 1240 | 1232 | Note that `ZPosition` works for both 2-D and 3-D charts, so you can overlay series and axes in arbitrary order. | |
| 1241 | 1233 | ||
| 1242 | 1234 | ### Coding style | |
| 1243 | 1235 | ||
| 1244 | 1236 | Historically FPC, Lazarus and LCL sources contain a mix of coding styles, with the general rule being "be consistent with the surrounding code". | |
| 1245 | 1237 | ||
| 1246 | 1238 | However, since TAChart has many fewer contributors, it is feasible to adopt and maintain a consistent style across all TAChart code. If you want to contribute to TAChart, please format your code accordingly. Also remember that any coding style may be violated in certain situations when the reason is good enough, but please explain that reason if you do so. | |
| 1247 | 1239 | ||
| 1248 | 1240 | #### Spaces | |
| 1249 | 1241 | ||
| 1250 | 1242 | - No double spaces anywhere. | |
| 1251 | 1243 | - Spaces after: operations, comma, semicolon, assignment, closing parenthesis in expressions (not in function calls). | |
| 1252 | 1244 | - Spaces before: operations, assignment, opening parenthesis in expressions (not in function calls). | |
| 1253 | 1245 | ||
| 1254 | 1246 | #### Lines | |
| 1255 | 1247 | ||
| 1256 | 1248 | - No double empty lines anywhere. | |
| 1257 | 1249 | - Empty lines between procedures, classes, unit sections. Rare empty lines inside procedure bodies to separate logical blocks. | |
| 1258 | 1250 | - Line length below 80 characters, with rare exceptions. | |
| 1259 | 1251 | - Single statement per line, except *if* ... *then* {*exit*\|*break*\|*continue*} and some rare cases of mass assignment. | |
| 1260 | 1252 | - If the line is too long, line breaks may be inserted after at the following symbols, in order of decreasing priority: keywords, opening parenthesis, opening square bracket, semicolon, comma, operation. | |
| 1261 | 1253 | ||
| 1262 | 1254 | #### Indentation and blocks | |
| 1263 | 1255 | ||
| 1264 | 1256 | - Always two spaces, both for blocks and continuation lines. | |
| 1265 | 1257 | - *begin* on the same line as the control statement, *end* aligned with the control statement. | |
| 1266 | 1258 | - *end* always alone on the line. In particular, write *end else begin* on two lines. | |
| 1267 | 1259 | - Put *then* or *do* on a separate line to separate a complex condition from the statement body: | |
| 1268 | 1260 | ||
| 1269 | 1261 | ` `**`while`**\ | |
| 1270 | 1262 | ` long condition or`\ | |
| 1271 | 1263 | ` another long condition`\ | |
| 1272 | 1264 | ` `**`do`**\ | |
| 1273 | 1265 | ` loop body` | |
| 1274 | 1266 | ||
| 1275 | 1267 | - Use *begin*/*end* only when necessary (i. e. not for single statements). | |
| 1276 | 1268 | ||
| 1277 | 1269 | #### Comments | |
| 1278 | 1270 | ||
| 1279 | 1271 | - Put a license header at the beginning of every file. | |
| 1280 | 1272 | - Single-line comments everywhere except the license header and auto-generated class headers in implementation section. | |
| 1281 | 1273 | - Use only full sentences in comments, starting with a capital letter and ending with a full stop. | |
| 1282 | 1274 | - Comments should be placed before commented code, except in rare cases where a comment fits at the end of the same line. | |
| 1283 | 1275 | - Comments should only include information not evident from the source. In particular, choose meaningful procedure and argument names in preference to adding comments describing their usage. | |
| 1284 | 1276 | ||
| 1285 | 1277 | #### Names | |
| 1286 | 1278 | ||
| 1287 | 1279 | - Constants use ALL_CAPS_WITH_UNDERSCORE, everything else use CamelCase. | |
| 1288 | 1280 | - Local variables start with a lower-case letter, everything else starts with an upper-case letter, even when FPC library disagrees (e.g. \`\`Math\`\`, not \`\`math\`\`). | |
| 1289 | 1281 | - Class fields start with 'F', arguments start with 'A', types start with 'T', TAChart units start with 'TA'. | |
| 1290 | 1282 | ||
| 1291 | 1283 | #### Variable declarations | |
| 1292 | 1284 | ||
| 1293 | 1285 | - Initialize when possible. | |
| 1294 | 1286 | - Local variables after nested procedures unless used by them. | |
| 1295 | 1287 | - Group variables by type. | |
| 1296 | 1288 | ||
| 1297 | 1289 | #### Classes and methods | |
| 1298 | 1290 | ||
| 1299 | 1291 | - Methods are grouped per-class, methods inside class are sorted alphabetically both in interface and implementation. There should be zero Code Observer warnings about 'Unsorted members'. | |
| 1300 | 1292 | - If there is a need to group methods by topic, use visibility specifiers as topic separators. In particular, group overridden methods separately from the newly introduced ones. | |
| 1301 | 1293 | - Use *strict private*/*strict protected* visibility where possible. | |
| 1302 | 1294 | ||
| 1303 | 1295 | #### Hints and warnings | |
| 1304 | 1296 | ||
| 1305 | 1297 | - Code should compile with zero hints and warnings. | |
| 1306 | 1298 | - Silence any "unused parameter" warning with the \`\`Unused\`\` procedure from the TAChartUtils unit, or use the {%H-} Lazarus IDE directive. | |
| 1307 | 1299 | ||
| 1308 | 1300 | #### Control flow | |
| 1309 | 1301 | ||
| 1310 | 1302 | - Use *exit* or *raise* to abort method execution in case of a violated pre-condition. | |
| 1311 | 1303 | - Use enumerators where possible. | |
| 1312 | 1304 | - Use *with* carefully, and only where its use significantly saves code size and in the minimal possible range. | |
| 1313 | 1305 | - Limit all procedures to 50-60 lines, and use nested procedures liberally. | |
| 1314 | 1306 | ||
| 1315 | 1307 | --- | |
| 1316 | 1308 | *From the Free Pascal wiki, page "TAChart documentation", as it stood on 2024-04-26 after a change by Wp, out of the wiki's dump of 2024-05-26. Copyright stays with the author who wrote it, according to the old wiki's [[Licensing]] page. If you have concerns about this material, [message the admin](/wiki-contact).* |