

TAChart Tutorial: Userdefined ChartSource: what changed
Revision 0 to 1. Removed lines have a minus sign; added lines have a plus sign.
Title: TAChart Tutorial: Userdefined ChartSource
| Old | New | Line | |
|---|---|---|---|
| 1 | + | ## Introduction | |
| 2 | + | ||
| 3 | + | 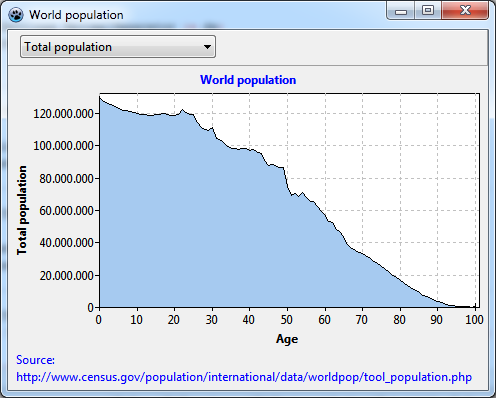 | |
| 4 | + | ||
| 5 | + | In this tutorial we use [[TAChart]] to plot the **age distribution of world population**. In doing this, you will learn | |
| 6 | + | ||
| 7 | + | - how to work with an [[TAChart documentation|area series]] | |
| 8 | + | - and, most of all, how to apply a [[TAChart documentation|user-defined chart source]] | |
| 9 | + | ||
| 10 | + | As usual, we assume that you are familiar with Lazarus and the [[Object Pascal]] language and have some basic knowledge of the TAChart package that you would acquire by working through the [[TAChart Tutorial: Getting started|Getting Started]] tutorial. | |
| 11 | + | ||
| 12 | + | ## Preparation | |
| 13 | + | ||
| 14 | + | ### Data | |
| 15 | + | ||
| 16 | + | The site [www.census.gov](http://www.census.gov) contains a wealth of demographic data. This [link](http://www.census.gov/population/international/data/worldpop/tool_population.php) leads you directly to the data that we want to plot: world population as a function of age and gender. | |
| 17 | + | ||
| 18 | + | Go to that page, select a year and click *"submit"*. In the lower part of the window, you will see a table with the columns *"Age"*, *"Both Sexes Population"*, *"Male population"*, *"Female population"*, and *"Sex ratio"*. Use the mouse to select the data in the table (including header) and copy them to the clipboard. Paste the data into a text editor and save as *"population.txt"*. | |
| 19 | + | ||
| 20 | + | Open Lazarus and create a new project. At first we have to load the data to make them available for plotting. | |
| 21 | + | ||
| 22 | + | We define a `TPopulationRecord` and an [[Array|array]] of type `TPopulationArray` to hold the data of the population table: | |
| 23 | + | ||
| 24 | + | ``` pascal | |
| 25 | + | type | |
| 26 | + | TPopulationRecord = record | |
| 27 | + | Age: Integer; | |
| 28 | + | Total: Double; | |
| 29 | + | Male: Double; | |
| 30 | + | Female: Double; | |
| 31 | + | Ratio: Double; | |
| 32 | + | end; | |
| 33 | + | ||
| 34 | + | TPopulationArray = array of TPopulationRecord; | |
| 35 | + | ``` | |
| 36 | + | ||
| 37 | + | Now let's read the file. Have a look at the [[Unit|unit]] `population.pas` in the [[TAChart Tutorial: Userdefined ChartSource|Source Code]] section of this tutorial. You will find there a | |
| 38 | + | ||
| 39 | + | ``` pascal | |
| 40 | + | procedure LoadPopulationData(const AFilename:string; var Data:TPopulationArray) | |
| 41 | + | ``` | |
| 42 | + | ||
| 43 | + | which does the file reading and stores the data in a `TPopulationArray`. | |
| 44 | + | ||
| 45 | + | Just include the unit `population` in your [[Uses|uses]] list to get access to this [[Procedure|procedure]]. Add a [[Variable|variable]] `PopulationData` of type `TPopulationArray` to the [[Private|private]] section of the main form. Now we have everything ready to call `LoadPopulationData` from the form's OnCreate event handler. This will read our data file into the array `PopulationData`. | |
| 46 | + | ||
| 47 | + | ``` pascal | |
| 48 | + | uses | |
| 49 | + | ..., population; | |
| 50 | + | ||
| 51 | + | type | |
| 52 | + | TForm1 = class(TForm) | |
| 53 | + | // ... | |
| 54 | + | private | |
| 55 | + | PopulationData : TPopulationArray; | |
| 56 | + | // ... | |
| 57 | + | end; | |
| 58 | + | ||
| 59 | + | const | |
| 60 | + | POPULATION_FILE = 'population.txt'; | |
| 61 | + | ||
| 62 | + | procedure TForm1.FormCreate(Sender: TObject); | |
| 63 | + | begin | |
| 64 | + | LoadPopulationData(POPULATION_FILE, PopulationData); | |
| 65 | + | end; | |
| 66 | + | ``` | |
| 67 | + | ||
| 68 | + | Compile to check for obvious errors. You may get a [[runtime error]] on that the data file cannot be found. This is because our data file is assumed to reside in the same directory as the exe file. To fix this, either change the [[Constant|constant]] `POPULATION_FILE` to the correct storage location, or copy *"population.txt"* to the exe folder. Now the program should run fine, you will see an unspectacularly empty form, though. | |
| 69 | + | ||
| 70 | + | ### Combobox as category selector | |
| 71 | + | ||
| 72 | + | The file contains various categories: total, male, and femal population, as well as male-to-female ratio. Why not display these data in our chart? | |
| 73 | + | ||
| 74 | + | To prepare for this, | |
| 75 | + | ||
| 76 | + | - add a **[[TPanel|panel]]** to the form, align it to `alTop`, and delete its caption. | |
| 77 | + | - Add a **[[TComboBox|combobox]]** to this panel, set its `Style` to `csDropdownList`, add the strings "Total population", "Male population", "Female population", and "Ratio male/female (%)" to the `Items` [[Property|property]], and set `ItemIndex` to 0. | |
| 78 | + | ||
| 79 | + | ### Preparing TChart | |
| 80 | + | ||
| 81 | + | Now we are finished with preparations, and it's time for charting... | |
| 82 | + | ||
| 83 | + | - Add a `TChart` component to the form, align it to `alClient`. | |
| 84 | + | - Set the chart's `BackColor` to `clWhite` and the `Grid.Color` of each axis to `clSilver`. | |
| 85 | + | - Get axis titles shown by setting `LeftAxis.Visible` and `BottomAxis.Visible` to `true`. | |
| 86 | + | - Set the caption of the bottom axis to "Age", and that of the left axis to "Total population" (or leave it empty - we will later replace it at [[runtime]] by the selected item of the combobox). | |
| 87 | + | - Use the text "World population" as the chart's title. | |
| 88 | + | - Set these font styles to `fsBold`. | |
| 89 | + | - Maybe it is a good idea to display our data reference in the [[TAChart documentation|footer]] - the chart property `Foot` can be used for that. Note that the property editor of `Foot.Text` (as well as that of `Title.Text`) allows to enter linefeeds for multi-lined titles. | |
| 90 | + | ||
| 91 | + | 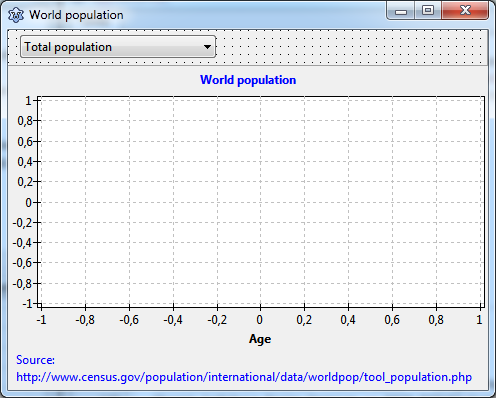 | |
| 92 | + | ||
| 93 | + | ## Creating an area series | |
| 94 | + | ||
| 95 | + | This time, we want to display our data as an [area series](https://en.wikipedia.org/wiki/Area_chart). This type of series connects the data points as in a line series, but also fills the area underneath by a given color. It is very common to display demographic data, like a [population pyramid](https://en.wikipedia.org/wiki/Population_pyramid), in this way. | |
| 96 | + | ||
| 97 | + | So, add a [[TAChart documentation|TAreaSeries]] to the chart. As usual, you don't see it at this time because it does not yet have any data. But we can prepare some properties: | |
| 98 | + | ||
| 99 | + | - Set its `SeriesColor` to `clSkyBlue`. This is the fill color of the area series. | |
| 100 | + | - Hide the vertical connecting lines by setting the `AreaLinesPen` to `psClear`. | |
| 101 | + | - If you want you can also change `ConnectType` to `ctStepXY` or `ctStepYX` to get a step effect. | |
| 102 | + | ||
| 103 | + | Later, when the series has data, you should play around with these and other properties to see what they do. | |
| 104 | + | ||
| 105 | + | ## User-defined chart source | |
| 106 | + | ||
| 107 | + | Now, how do we get our data to the area series? | |
| 108 | + | ||
| 109 | + | The first idea might be iterate through our `PopulationData` array and copy the data to the series by means of `AddXY` calls, like this: | |
| 110 | + | ||
| 111 | + | ``` pascal | |
| 112 | + | var | |
| 113 | + | i: Integer; | |
| 114 | + | begin | |
| 115 | + | for i:=0 to High(PopulationData) do | |
| 116 | + | Chart1AreaSeries1.AddXY(PopulationData[i].Age, PopulationData[i].Total); | |
| 117 | + | end; | |
| 118 | + | ``` | |
| 119 | + | ||
| 120 | + | The disadvantage of this approach is that we would have the data in memory twice: in the `PopulationData` array and in the series - not so good: we would be wasting memory, and we would have to synchronize both storages when data points are added, deleted or edited. | |
| 121 | + | ||
| 122 | + |  To avoid this, we add a [[TAChart documentation|TUserDefinedChartSource]] to the form, it is the third or fourth icon from the left in the [[Chart tab|Chart component palette]]. This chart source is made to interface to any kind of data storage, the source itself does not store any data. You just have to write an event handler for `OnGetChartDataItem` in order to transfer the data. For this purpose, the event takes a [[Variable parameter|var parameter]] `AItem` of type `TChartDataItem` that is defined as follows (with elements omitted that are not needed here): | |
| 123 | + | ||
| 124 | + | ``` pascal | |
| 125 | + | type | |
| 126 | + | TChartDataItem = object | |
| 127 | + | X, Y: Double; | |
| 128 | + | // ... | |
| 129 | + | end; | |
| 130 | + | ``` | |
| 131 | + | ||
| 132 | + | The fields `X` and `Y` are the coordinates of the data point. | |
| 133 | + | ||
| 134 | + | Now we write the event handler for `OnGetChartDataItem`: | |
| 135 | + | ||
| 136 | + | ``` pascal | |
| 137 | + | procedure TForm1.UserDefinedChartSource1GetChartDataItem( | |
| 138 | + | ASource: TUserDefinedChartSource; AIndex: Integer; var AItem: TChartDataItem); | |
| 139 | + | begin | |
| 140 | + | AItem.X := PopulationData[AIndex].Age; | |
| 141 | + | case Combobox1.ItemIndex of | |
| 142 | + | 0: AItem.Y := PopulationData[AIndex].Total; | |
| 143 | + | 1: AItem.Y := PopulationData[AIndex].Male; | |
| 144 | + | 2: AItem.Y := PopulationData[AIndex].Female; | |
| 145 | + | 3: AItem.Y := PopulationData[AIndex].Ratio; | |
| 146 | + | end; | |
| 147 | + | end; | |
| 148 | + | ``` | |
| 149 | + | ||
| 150 | + | `AIndex` is the index of the datapoint which is queried. Since both chart source and our `PopulationData` array begin at index 0 we just look into our data array at this index and copy the data to the corresponding elements of the `AItem`. Note that we pick the y coordinate according to what is selected in the combobox. In this way, the UserDefinedChartSource can provide a multitude of data. | |
| 151 | + | ||
| 152 | + | There are still some important things to do: | |
| 153 | + | ||
| 154 | + | - Tell the series to use the UserDefinedChartSource instead of the built-in source. For this purpose, we point the series' property `Source` to `UserDefinedChartSource1`. | |
| 155 | + | - Tell the UserDefinedChartSource how many data points the external data array contains. We have to enter this number in the property `PointsNumber` of the UserDefinedChartSource. The data count is known after our procedure `LoadPopulationData` has finished. So we add a line which sets `PointsNumber` correctly to the `FormCreate` method after `LoadPopulationData` is called. | |
| 156 | + | - Since the UserDefinedChartSource does not know anything about the structure of the external data we have to notify it whenever data are available or have been changed. We do this by calling `UserDefinedChartSource1.Reset` at an appropriate place. Sometimes you are lucky that some other method may have done this already. But keep in mind that whenever a chart with a UserDefinedChartSource does not behave as you expect there is a chance that you may have forgotten to call `Reset`. To see what happens let's "forget" to call `Reset` for the moment. | |
| 157 | + | ||
| 158 | + | ## Fine-tuning | |
| 159 | + | ||
| 160 | + | 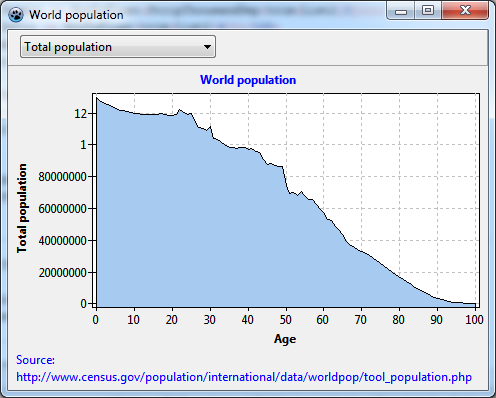 | |
| 161 | + | ||
| 162 | + | Compile the project in this stage. Not too bad, some flaws, though. | |
| 163 | + | ||
| 164 | + | - The labels of the y axis are strange. Why do they jump from 80000000 to 1, and then to 12? This seems to be due to a bug of the `Format` function for large numbers in some FPC versions. If you have that issue as well, simply change the property `LeftAxis.Marks.Format`. This string is passed to the `Format` function to convert numbers to strings. The format specifier "%.0n" for example avoids that conversion error and, additionally, adds nice thousand separators to the labels which makes them much more readable. However, be aware that the "0" cuts off any decimals. Therefore, you should use this format specifier only for large numbers. | |
| 165 | + | - There is a small gap between the y axis and the filled area series. Similarly, the filled area reaches a bit below the x axis. This is caused by the property `Margins` of the chart. This property is usually quite helpful to create an empty area near the plot axes, free from overlapping symbols and marks labels. But here, it is unfavorable. So just set `Chart.Margins.Left` and `Chart.Margins.Bottom` to 0. | |
| 166 | + | - Ah, and the combobox is not working yet. We need to assign a handler for its `OnSelect` event. What does it have to do? Well, when another combobox item has been selected the UserDefinedChartSource reports a different y value to the series - that's what we want. But how we get the `OnGetChartDataItem` being called? Just by redrawing the chart! When the series is redrawn it always has to query the data from the chart source, so it will get the updated data automatically. OK - let's call `Chart1.Invalidate`: | |
| 167 | + | ||
| 168 | + | ``` pascal | |
| 169 | + | procedure TForm1.ComboBox1Select(Sender: TObject); | |
| 170 | + | begin | |
| 171 | + | Chart1.Invalidate; | |
| 172 | + | end; | |
| 173 | + | ``` | |
| 174 | + | ||
| 175 | + | When you compile and select another combobox item you will find that the series does nicely update to the selected category. But the axis is frozen, it should rescale automatically. Is this a bug? | |
| 176 | + | ||
| 177 | + | No. A few lines above, it was said that whenever a chart with a UserDefinedChartSource does not behave as expected there is a chance that you may have forgotten to call `UserDefinedChartSource.Reset`. That's it: we replace the `Invalidate` by the `Reset`. | |
| 178 | + | ||
| 179 | + | And we can fix another issue: the caption of the y axis should change whenever a different category is selected. For this, we copy the text of the selected combobox item to the chart's `LeftAxis.Title.Caption`. We add a corresponding line the the combobox OnSelect event handler: | |
| 180 | + | ||
| 181 | + | ``` pascal | |
| 182 | + | procedure TForm1.ComboBox1Select(Sender: TObject); | |
| 183 | + | begin | |
| 184 | + | Chart1.LeftAxis.Title.Caption := Combobox1.Items[Combobox1.ItemIndex]; | |
| 185 | + | UserDefinedChartSource1.Reset; | |
| 186 | + | end; | |
| 187 | + | ``` | |
| 188 | + | ||
| 189 | + | Now switching of data categories by the combobox is working fine. | |
| 190 | + | ||
| 191 | + | A minor flaw left: Since our y data do not contain a 0 the y axis does not begin at 0 due to the automatic axis scaling. But it would be nice if there were a zero. For this, we must partially turn off automatic axis scaling. The `Chart.Extent` defines a rectangle for the minimum and maximum x and y values. When we set `Chart.Extent.UseYMin` to `true`, the y axis minimum is taken from the value of `Chart.Extent.YMin`, and this is 0 by default. Therefore, we have our zero back. | |
| 192 | + | ||
| 193 | + | 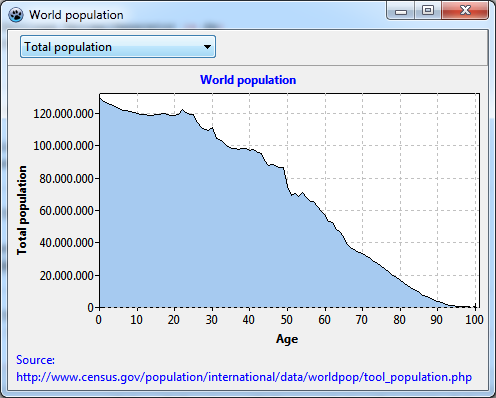 | |
| 194 | + | ||
| 195 | + | But there is another small problem now: the lowest grid line is drawn on top of the x axis. First of all, the black lines that we see as axes are not the axes themselves, but belong to the frame drawn around the plotting area by default. You can test this by setting `Chart1.Frame.Visible` temporarily to `false`. For the axes, there is a property `AxisPen` where the "true" axis line can be turned on by `AxisPen.Visible = true`. After after doing this, the x axis is still a dashed line. This is caused by the drawing sequence. By default, the y axis, along with its grid, is drawn *after* the x axis. If you want to have the x axis drawn first you go to the object tree and drag the x axis above the y axis. | |
| 196 | + | ||
| 197 | + | When you compile the chart is perfect. | |
| 198 | + | ||
| 199 | + |  | |
| 200 | + | ||
| 201 | + | 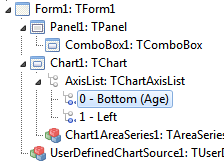 | |
| 202 | + | ||
| 203 | + | ## Source code | |
| 204 | + | ||
| 205 | + | For Lazarus v2.1+ you can find the [[Source code|source code]] of this tutorial project in folder **components/tachart/tutorials/population1** of your Lazarus installation. For older versions, copy and paste the following code to the corresponding files. | |
| 206 | + | ||
| 207 | + | ### Project file | |
| 208 | + | ||
| 209 | + | ``` pascal | |
| 210 | + | program project1; | |
| 211 | + | ||
| 212 | + | {$mode objfpc}{$H+} | |
| 213 | + | ||
| 214 | + | uses | |
| 215 | + | {$IFDEF UNIX}{$IFDEF UseCThreads} | |
| 216 | + | cthreads, | |
| 217 | + | {$ENDIF}{$ENDIF} | |
| 218 | + | Interfaces, // this includes the LCL widgetset | |
| 219 | + | Forms, Unit1, tachartlazaruspkg, population | |
| 220 | + | { you can add units after this }; | |
| 221 | + | ||
| 222 | + | {$R *.res} | |
| 223 | + | ||
| 224 | + | begin | |
| 225 | + | RequireDerivedFormResource := True; | |
| 226 | + | Application.Initialize; | |
| 227 | + | Application.CreateForm(TForm1, Form1); | |
| 228 | + | Application.Run; | |
| 229 | + | end. | |
| 230 | + | ``` | |
| 231 | + | ||
| 232 | + | ### population.pas | |
| 233 | + | ||
| 234 | + | ``` pascal | |
| 235 | + | unit population; | |
| 236 | + | ||
| 237 | + | {$mode objfpc}{$H+} | |
| 238 | + | ||
| 239 | + | interface | |
| 240 | + | ||
| 241 | + | uses | |
| 242 | + | Classes, SysUtils; | |
| 243 | + | ||
| 244 | + | type | |
| 245 | + | TPopulationRecord = record | |
| 246 | + | Age: Integer; | |
| 247 | + | Total: Double; | |
| 248 | + | Male: Double; | |
| 249 | + | Female: Double; | |
| 250 | + | Ratio: Double; | |
| 251 | + | end; | |
| 252 | + | ||
| 253 | + | type | |
| 254 | + | TPopulationArray = array of TPopulationRecord; | |
| 255 | + | ||
| 256 | + | procedure LoadPopulationData(const AFileName: String; var Data: TPopulationArray); | |
| 257 | + | ||
| 258 | + | implementation | |
| 259 | + | ||
| 260 | + | procedure LoadPopulationData(const AFileName: String; var Data: TPopulationArray); | |
| 261 | + | ||
| 262 | + | function StripThousandSep(const s: String): String; | |
| 263 | + | var | |
| 264 | + | i: Integer; | |
| 265 | + | begin | |
| 266 | + | Result := s; | |
| 267 | + | for i:=Length(Result) downto 1 do | |
| 268 | + | if Result[i] = ',' then | |
| 269 | + | Delete(Result, i, 1); | |
| 270 | + | end; | |
| 271 | + | ||
| 272 | + | var | |
| 273 | + | List1, List2: TStringList; | |
| 274 | + | i, j, n: Integer; | |
| 275 | + | s: String; | |
| 276 | + | ds: char; | |
| 277 | + | begin | |
| 278 | + | ds := FormatSettings.DecimalSeparator; | |
| 279 | + | List1 := TStringList.Create; | |
| 280 | + | try | |
| 281 | + | List1.LoadFromFile(AFileName); | |
| 282 | + | n := List1.Count; | |
| 283 | + | SetLength(Data, n-2); | |
| 284 | + | FormatSettings.DecimalSeparator := '.'; | |
| 285 | + | List2 := TStringList.Create; | |
| 286 | + | try | |
| 287 | + | List2.Delimiter := #9; | |
| 288 | + | List2.StrictDelimiter := true; | |
| 289 | + | j := 0; | |
| 290 | + | for i:=2 to n-1 do begin | |
| 291 | + | List2.DelimitedText := List1[i]; | |
| 292 | + | s := List1[i]; | |
| 293 | + | with Data[j] do begin | |
| 294 | + | if i < n-1 then | |
| 295 | + | Age := StrToInt(trim(List2[0])) | |
| 296 | + | else | |
| 297 | + | Age := 100; | |
| 298 | + | Total := StrToFloat(StripThousandSep(trim(List2[1]))); | |
| 299 | + | Male := StrToFloat(StripThousandSep(trim(List2[2]))); | |
| 300 | + | Female := StrToFloat(StripThousandSep(trim(List2[3]))); | |
| 301 | + | Ratio := StrToFloat(trim(List2[4])); | |
| 302 | + | end; | |
| 303 | + | inc(j); | |
| 304 | + | end; | |
| 305 | + | finally | |
| 306 | + | List2.Free; | |
| 307 | + | end; | |
| 308 | + | finally | |
| 309 | + | FormatSettings.DecimalSeparator := ds; | |
| 310 | + | List1.Free; | |
| 311 | + | end; | |
| 312 | + | end; | |
| 313 | + | ||
| 314 | + | end. | |
| 315 | + | ``` | |
| 316 | + | ||
| 317 | + | ### Unit1.pas | |
| 318 | + | ||
| 319 | + | ``` pascal | |
| 320 | + | unit Unit1; | |
| 321 | + | ||
| 322 | + | {$mode objfpc}{$H+} | |
| 323 | + | ||
| 324 | + | interface | |
| 325 | + | ||
| 326 | + | uses | |
| 327 | + | Classes, SysUtils, FileUtil, TAGraph, TASources, TASeries, Forms, Controls, | |
| 328 | + | Graphics, Dialogs, ExtCtrls, StdCtrls, population, TACustomSource; | |
| 329 | + | ||
| 330 | + | type | |
| 331 | + | ||
| 332 | + | { TForm1 } | |
| 333 | + | ||
| 334 | + | TForm1 = class(TForm) | |
| 335 | + | Chart1: TChart; | |
| 336 | + | Chart1AreaSeries1: TAreaSeries; | |
| 337 | + | ComboBox1: TComboBox; | |
| 338 | + | Panel1: TPanel; | |
| 339 | + | UserDefinedChartSource1: TUserDefinedChartSource; | |
| 340 | + | procedure ComboBox1Select(Sender: TObject); | |
| 341 | + | procedure FormCreate(Sender: TObject); | |
| 342 | + | procedure UserDefinedChartSource1GetChartDataItem( | |
| 343 | + | ASource: TUserDefinedChartSource; AIndex: Integer; | |
| 344 | + | var AItem: TChartDataItem); | |
| 345 | + | private | |
| 346 | + | { private declarations } | |
| 347 | + | PopulationData: TPopulationArray; | |
| 348 | + | public | |
| 349 | + | { public declarations } | |
| 350 | + | end; | |
| 351 | + | ||
| 352 | + | var | |
| 353 | + | Form1: TForm1; | |
| 354 | + | ||
| 355 | + | implementation | |
| 356 | + | ||
| 357 | + | {$R *.lfm} | |
| 358 | + | ||
| 359 | + | const | |
| 360 | + | POPULATION_FILE = 'population.txt'; | |
| 361 | + | ||
| 362 | + | { TForm1 } | |
| 363 | + | ||
| 364 | + | procedure TForm1.FormCreate(Sender: TObject); | |
| 365 | + | begin | |
| 366 | + | LoadPopulationData(POPULATION_FILE, PopulationData); | |
| 367 | + | UserDefinedChartSource1.PointsNumber := Length(PopulationData); | |
| 368 | + | Chart1.LeftAxis.Title.Caption := Combobox1.Items[Combobox1.ItemIndex]; | |
| 369 | + | end; | |
| 370 | + | ||
| 371 | + | procedure TForm1.ComboBox1Select(Sender: TObject); | |
| 372 | + | begin | |
| 373 | + | Chart1.LeftAxis.Title.Caption := Combobox1.Items[Combobox1.ItemIndex]; | |
| 374 | + | UserDefinedChartSource1.Reset; | |
| 375 | + | end; | |
| 376 | + | ||
| 377 | + | procedure TForm1.UserDefinedChartSource1GetChartDataItem( | |
| 378 | + | ASource: TUserDefinedChartSource; AIndex: Integer; var AItem: TChartDataItem); | |
| 379 | + | begin | |
| 380 | + | AItem.X := PopulationData[AIndex].Age; | |
| 381 | + | case Combobox1.ItemIndex of | |
| 382 | + | 0: AItem.Y := PopulationData[AIndex].Total; | |
| 383 | + | 1: AItem.Y := PopulationData[AIndex].Male; | |
| 384 | + | 2: AItem.Y := PopulationData[AIndex].Female; | |
| 385 | + | 3: AItem.Y := PopulationData[AIndex].Ratio; | |
| 386 | + | end; | |
| 387 | + | end; | |
| 388 | + | ||
| 389 | + | end. | |
| 390 | + | ``` | |
| 391 | + | ||
| 392 | + | ### Unit1.lfm | |
| 393 | + | ||
| 394 | + | ``` pascal | |
| 395 | + | object Form1: TForm1 | |
| 396 | + | Left = 342 | |
| 397 | + | Height = 360 | |
| 398 | + | Top = 128 | |
| 399 | + | Width = 480 | |
| 400 | + | Caption = 'World population' | |
| 401 | + | ClientHeight = 360 | |
| 402 | + | ClientWidth = 480 | |
| 403 | + | OnCreate = FormCreate | |
| 404 | + | Position = poScreenCenter | |
| 405 | + | LCLVersion = '1.1' | |
| 406 | + | object Panel1: TPanel | |
| 407 | + | Left = 0 | |
| 408 | + | Height = 36 | |
| 409 | + | Top = 0 | |
| 410 | + | Width = 480 | |
| 411 | + | Align = alTop | |
| 412 | + | ClientHeight = 36 | |
| 413 | + | ClientWidth = 480 | |
| 414 | + | TabOrder = 0 | |
| 415 | + | object ComboBox1: TComboBox | |
| 416 | + | Left = 12 | |
| 417 | + | Height = 23 | |
| 418 | + | Top = 5 | |
| 419 | + | Width = 196 | |
| 420 | + | ItemHeight = 15 | |
| 421 | + | ItemIndex = 0 | |
| 422 | + | Items.Strings = ( | |
| 423 | + | 'Total population' | |
| 424 | + | 'Male population' | |
| 425 | + | 'Female population' | |
| 426 | + | 'Ratio male/female (%)' | |
| 427 | + | ) | |
| 428 | + | OnSelect = ComboBox1Select | |
| 429 | + | Style = csDropDownList | |
| 430 | + | TabOrder = 0 | |
| 431 | + | Text = 'Total population' | |
| 432 | + | end | |
| 433 | + | end | |
| 434 | + | object Chart1: TChart | |
| 435 | + | Left = 0 | |
| 436 | + | Height = 324 | |
| 437 | + | Top = 36 | |
| 438 | + | Width = 480 | |
| 439 | + | AxisList = < | |
| 440 | + | item | |
| 441 | + | Grid.Visible = False | |
| 442 | + | Alignment = calRight | |
| 443 | + | AxisPen.Visible = True | |
| 444 | + | Marks.Visible = False | |
| 445 | + | Minors = <> | |
| 446 | + | end | |
| 447 | + | item | |
| 448 | + | Grid.Color = clSilver | |
| 449 | + | Alignment = calBottom | |
| 450 | + | AxisPen.Visible = True | |
| 451 | + | Minors = <> | |
| 452 | + | Title.LabelFont.Style = [fsBold] | |
| 453 | + | Title.Visible = True | |
| 454 | + | Title.Caption = 'Age' | |
| 455 | + | end | |
| 456 | + | item | |
| 457 | + | Grid.Color = clSilver | |
| 458 | + | AxisPen.Visible = True | |
| 459 | + | Marks.Format = '%.0n' | |
| 460 | + | Marks.Style = smsCustom | |
| 461 | + | Minors = <> | |
| 462 | + | Title.LabelFont.Orientation = 900 | |
| 463 | + | Title.LabelFont.Style = [fsBold] | |
| 464 | + | Title.Visible = True | |
| 465 | + | end> | |
| 466 | + | BackColor = clWhite | |
| 467 | + | Extent.UseYMin = True | |
| 468 | + | Foot.Alignment = taLeftJustify | |
| 469 | + | Foot.Brush.Color = clBtnFace | |
| 470 | + | Foot.Font.Color = clBlue | |
| 471 | + | Foot.Text.Strings = ( | |
| 472 | + | 'Source:' | |
| 473 | + | 'http://www.census.gov/population/international/data/worldpop/tool_population.php' | |
| 474 | + | ) | |
| 475 | + | Foot.Visible = True | |
| 476 | + | Margins.Left = 0 | |
| 477 | + | Margins.Right = 0 | |
| 478 | + | Margins.Bottom = 0 | |
| 479 | + | Title.Brush.Color = clBtnFace | |
| 480 | + | Title.Font.Color = clBlue | |
| 481 | + | Title.Font.Style = [fsBold] | |
| 482 | + | Title.Text.Strings = ( | |
| 483 | + | 'World population' | |
| 484 | + | ) | |
| 485 | + | Title.Visible = True | |
| 486 | + | Align = alClient | |
| 487 | + | ParentColor = False | |
| 488 | + | object Chart1AreaSeries1: TAreaSeries | |
| 489 | + | AreaBrush.Color = clSkyBlue | |
| 490 | + | AreaLinesPen.Style = psClear | |
| 491 | + | Source = UserDefinedChartSource1 | |
| 492 | + | end | |
| 493 | + | end | |
| 494 | + | object UserDefinedChartSource1: TUserDefinedChartSource | |
| 495 | + | OnGetChartDataItem = UserDefinedChartSource1GetChartDataItem | |
| 496 | + | left = 552 | |
| 497 | + | top = 152 | |
| 498 | + | end | |
| 499 | + | end | |
| 500 | + | ``` | |
| 501 | + | ||
| 502 | + | --- | |
| 503 | + | *From the Free Pascal wiki, page "TAChart Tutorial: Userdefined ChartSource", as it stood on 2019-11-16 after a change by Djzepi, out of the wiki's dump of 2024-05-26. Copyright stays with the author who wrote it, according to the old wiki's [[Licensing]] page. If you have concerns about this material, [message the admin](/wiki-contact).* |