

TAChart Tutorial: Stacked BarSeries: what changed
Revision 0 to 1. Removed lines have a minus sign; added lines have a plus sign.
Title: TAChart Tutorial: Stacked BarSeries
| Old | New | Line | |
|---|---|---|---|
| 1 | + | ## Introduction | |
| 2 | + | ||
| 3 | + | 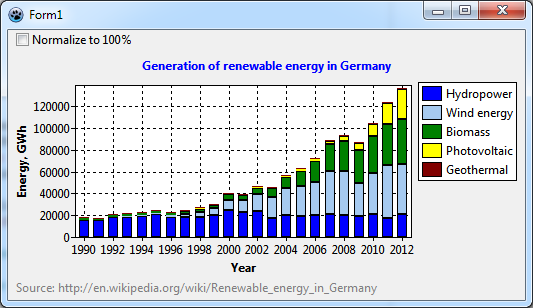 | |
| 4 | + | ||
| 5 | + | In the [[TAChart Tutorial: BarSeries|BarSeries tutorial]] we had demonstrated how to create a chart with bar series arranged in a side-by-side manner. Stacked bars are another popular variant of bar charts where the grouped data are stacked onto each other. In this way, the individual contributions and their sum can be shown within the same plot. There is also a variant in which the total bar heights are normalized to 100% to emphasize the relative contributions [1](http://blog.visual.ly/how-groups-stack-up-when-to-use-grouped-vs-stacked-column-charts/). | |
| 6 | + | ||
| 7 | + | We'll apply this technique in the current tutorial to plot the progress in generation of renewable energies in Germany between 1990 and 2012; the data are taken from [wikipedia](http://en.wikipedia.org/wiki/Renewable_energy_in_Germany) and cover hydropower, wind energy, energy from bio mass, photovoltaics, and geothermal energy. | |
| 8 | + | ||
| 9 | + | Besides [[TAChart documentation|TBarSeries]] you'll meet [[TAChart documentation|TRandomChartSource]], [[TAChart documentation|TCalculatedChartSource]], and `TChartStyles` in this tutorial unit. | |
| 10 | + | ||
| 11 | + | As usual, you must have some basic knowledge of Lazarus, Object Pascal, and the key concepts of TAChart to follow the tutorial. If you have never worked with bar charts it is a good idea to look at the related tutorial explaining the [[TAChart Tutorial: BarSeries|side-by-side arrangement of bars]]. For additional reading we recommend the [[TAChart documentation]]. | |
| 12 | + | ||
| 13 | + | ## Designing the chart with random data | |
| 14 | + | ||
| 15 | + | ### Preparations | |
| 16 | + | ||
| 17 | + | Create a new project. Add a `TAChart` component, and align it to `alClient` to completely fill the form. Maybe you should increase the size of the form a bit, but you can do this later when you see the data. | |
| 18 | + | ||
| 19 | + | Before using the "real data" we'll arrange and format the chart to our liking. For this purpose it is advantageous to get a quick response to the changes made in the object inspector. Therefore, we propose to use a [[TAChart documentation|TRandomChartSource]] linked to the BarSeries. A RandomChartSource just produces random data, but is a great helper to to optimize the appearence of the chart without having to recompile the project again and again. Of course, at the end, we will remove the RandomChartSource and replace it with the data of interest. | |
| 20 | + | ||
| 21 | + | So, let's start: Add a `TBarSeries` and a `TRandomChartSource` to the form, and link the RandomChartSource to the `Source` property of the BarSeries. (If you need more details have a look at the [[TAChart Tutorial: BarSeries|other BarSeries tutorial]]). Select the RandomChartSource, and set `XMin` to 1990 and `XMax` to 2012 (which is the range of our original data in the [wikipedia article](http://en.wikipedia.org/wiki/Renewable_energy_in_Germany)). In total, these are 23 years, so you set `PointsNumber` to 23 in order to get a bar for each year. Finally, set `YMax` to `1` (or any other numbers that you prefer). Now a bar series pops into the chart: | |
| 22 | + | ||
| 23 | + | 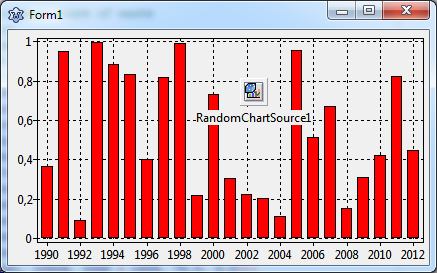 | |
| 24 | + | ||
| 25 | + | ### Multiple y values | |
| 26 | + | ||
| 27 | + | If you had read the other [[TAChart Tutorial: BarSeries|BarSeries tutorial]] you may be surprised now: In that tutorial, we had used a single series for each group of bars. In our final renewable energy plot there will be several types of bars, one for each energy kind. So, shouldn't we add some more series? | |
| 28 | + | ||
| 29 | + | No. We only need one since we cannot follow the strategy of the side-by-side series here. This is because `TAChart` cannot stack the bars of different series onto each other. Each bar is drawn from a common "zero level" up (or down) to the data value - no way to shift the next bar up to the end of the previous bar. | |
| 30 | + | ||
| 31 | + | What to do? | |
| 32 | + | ||
| 33 | + | For stacking of series, `TAChart` offers the special concept of multiple y values per series data point. If you look into unit `TACustomSource` you'll find the record | |
| 34 | + | ||
| 35 | + | ``` pascal | |
| 36 | + | type | |
| 37 | + | TChartDataItem = packed record | |
| 38 | + | public | |
| 39 | + | X, Y: Double; | |
| 40 | + | Color: TChartColor; | |
| 41 | + | Text: String; | |
| 42 | + | YList: TDoubleDynArray; | |
| 43 | + | ... | |
| 44 | + | end; | |
| 45 | + | ``` | |
| 46 | + | ||
| 47 | + | This is the internal structure of the data plotted in a series. Besides the usual `x` and `y` coordinates that you know from other plot types and tutorials, there is also a data field `YList` which reserves storage for additional y values. The chart source provides the property `YCount` to define the length of the array `YList` - select the RandomChartSource and have a look at the Object Inspector. But you should know that `YCount` includes also the standard y value, the length of the `YList` array for the other y values, therefore, is `YCount-1`. | |
| 48 | + | ||
| 49 | + | Our final plot will contain five column types ("hydro power", "wind energy", "bio mass", "photo-voltaics", and "geothermal"). Therefore, enter `5` for `YCount`. This creates stacks of five bars. | |
| 50 | + | ||
| 51 | + | 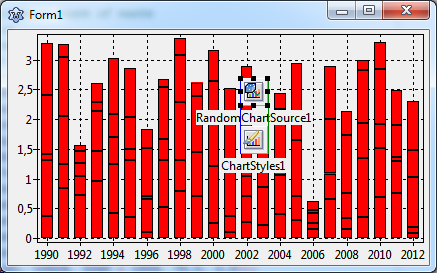 | |
| 52 | + | ||
| 53 | + | ### Using ChartStyles | |
| 54 | + | ||
| 55 | + | Unfortunately, all bars are in the same color. How can we modify the color of each bar level? | |
| 56 | + | ||
| 57 | + | We need another component to address this: **ChartStyles**. This is a collection of `TChartStyle` components which allow to modify the appearance ("style") of each set of bars. | |
| 58 | + | ||
| 59 | + | Go to the component palette, find the 9th icon (the one with the brush in front of the colored bars), and add the component to the form. | |
| 60 | + | ||
| 61 | + |  | |
| 62 | + | ||
| 63 | + | At first you have to link the BarSeries to the ChartStyles component. The series has a corresponding property `Styles` for this purpose. | |
| 64 | + | ||
| 65 | + | Then, select the component, and go to its `Styles` property in the object inspector. Click on the ellipsis button "..." to open the ChartStyles editor. Here you can add a style for each group of bars by clicking on the "+" button five times. Alternatively you can right-click on the "Styles" node in the object tree of `ChartStyles1` and select "Add item". | |
| 66 | + | ||
| 67 | + | 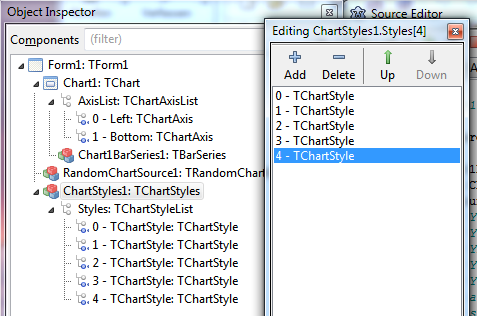 | |
| 68 | + | ||
| 69 | + | 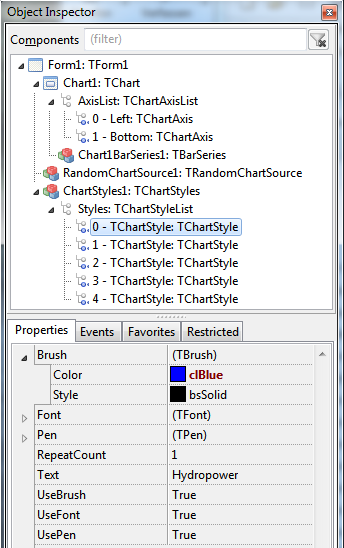 | |
| 70 | + | ||
| 71 | + | In the the ChartStyle editor you can select each style and you'll see the style's properties in the object inspector. The `TChartStyle` item with the index 0 belongs to the bottom-most bar, index 1 belongs to the next bar, etc. For changing the color of the bars, modify the `Brush.Color` of the style. The chart immediately updates and displays the corresponding bar in the new color. Repeat this with the other styles. Have a look at the other properties of the `TChartStyle` to learn what else can be adapted. | |
| 72 | + | ||
| 73 | + | ### Showing ChartStyles in the legend | |
| 74 | + | ||
| 75 | + | Using the `ChartStyle` property `Text` you can assign a legend item for each bar level. Set `Text` to "Hydropower", "Wind energy", "Bio mass", "Photovoltaic", and "Geothermal" for the styles, starting with index 0. | |
| 76 | + | ||
| 77 | + | In order to show the legend you know that you have to set the chart's `Legend.Visible` property to `true`; it is `false` by default. The legend, however, displays only a single entry, a red box corresponding to the bar series without usage of `ChartStyles`. In order to correct that, select the BarSeries, and open the node `Legend` in the object inspector. The property `Legend.Multiplicity` is still at `lmSingle` which produces only a single legend item per series. Change it to `lmStyle` instead. This is the correct setting when the series uses styles. Now the chart reads the `Text` values of each style and adds them to the legend. | |
| 78 | + | ||
| 79 | + | 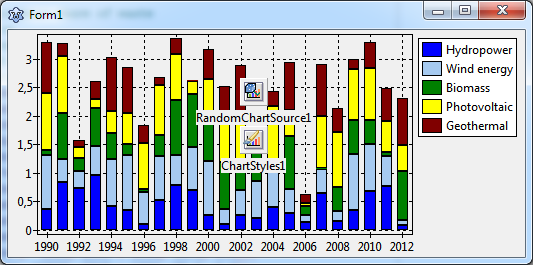 | |
| 80 | + | ||
| 81 | + | ### Normalizing bar stacks to 100% | |
| 82 | + | ||
| 83 | + | In order to emphasize the evolution of the relative contributions of the individual bar groups stacked bar charts are often normalized to 100%, i.e. each bar value is replaced by its percentage of the total stack heights. | |
| 84 | + | ||
| 85 | + | `TAChart` can do this with a little modification of the current program. The key ingredient is usage of a `TCalculatedChartSource` which picks up the data from the currently used chart source and calculates the relative contributions. | |
| 86 | + | ||
| 87 | + | Add a `TCalculatedChartSource` to the form. Set its property `Origin` to point to our RandomChartSource. This means that the CalculatedChartSource will perform its calculations based on the data of our chart. It is important that you leave `AccumulationMethod` at its default, `camNone`, which means that the input data are passed to the output unchanged. The other options would combine input data values to new values: `camAverage`, for example, would cause calculation of the average of the data points within the `AccumulationRange`. But how do we get the percentage calculation if `camNone` does not change anything? Simple - there is a `Percentage` property! The normalization is applied after the accumulation calculations. Set `Percentage` to `true`. | |
| 88 | + | ||
| 89 | + | We don't see a change in the chart yet, because the series still gets its data from the RandomChartSource. Go to the BarSeries and select the CalculatedChartSource as `Source`. | |
| 90 | + | ||
| 91 | + | Here we are! | |
| 92 | + | ||
| 93 | + | 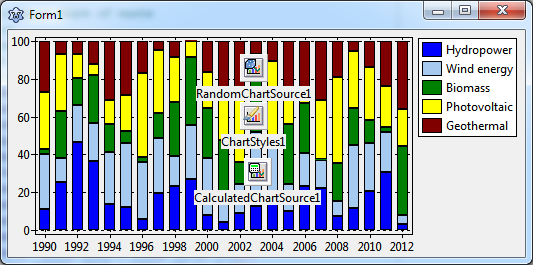 | |
| 94 | + | ||
| 95 | + | ## Plotting real data | |
| 96 | + | ||
| 97 | + | Now that the chart is practically finished it's getting time to remove the random data and replace them with the "real data". As noted in the introduction, we want to plot the evolution of renewable energy generation during various years. The data can be found at the end of the [wikipedia article](http://en.wikipedia.org/wiki/Renewable_energy_in_Germany). | |
| 98 | + | ||
| 99 | + | At first, do the bravery test: delete the RandomChartSource, we don't need it any more - all the previous data are gone, and the chart becomes empty... | |
| 100 | + | ||
| 101 | + | How do we get the new data to the series? | |
| 102 | + | ||
| 103 | + | ### Providing real data to the bar series | |
| 104 | + | ||
| 105 | + | Add a `TListChartSource` to the form. It will house the data. Please remember that every data point consists of five y values in our project. Therefore, you must set the `YCount` property of this chart source to `5` again. To put the multiple y data into the list source it has a method `AddXYList` where you can specify all y values at once. | |
| 106 | + | ||
| 107 | + | ``` pascal | |
| 108 | + | function TListChartSource.AddXYList( | |
| 109 | + | AX: Double; const AY: array of Double; | |
| 110 | + | const ALabel: String = ''; | |
| 111 | + | AColor: TChartColor = clTAColor): Integer; | |
| 112 | + | ``` | |
| 113 | + | ||
| 114 | + | But don't forget that the count of `Double` array elements must match the `YCount` specified. | |
| 115 | + | ||
| 116 | + | For simplicity we type the data from the wikipedia page and call `AddXYList` in the `OnCreate` event of the form: | |
| 117 | + | ||
| 118 | + | ``` pascal | |
| 119 | + | procedure TForm1.FormCreate(Sender: TObject); | |
| 120 | + | begin | |
| 121 | + | with ListChartSource1 do begin | |
| 122 | + | // Y0 = Hydropower | |
| 123 | + | // Y1 = Wind energy (off-shore + on-shore) | |
| 124 | + | // Y2 = Biomass + biogenic share of waste | |
| 125 | + | // Y3 = Photovoltaics | |
| 126 | + | // Y4 = Geothermal energy | |
| 127 | + | // all values in GWh | |
| 128 | + | // source: http://en.wikipedia.org/wiki/Renewable_energy_in_Germany | |
| 129 | + | AddXYList(1990, [15580, 71, 221+1213, 0.6, 0]); | |
| 130 | + | AddXYList(1991, [15402, 100, 260+1211, 1.6, 0]); | |
| 131 | + | AddXYList(1992, [18091, 275, 296+1262, 3.2, 0]); | |
| 132 | + | AddXYList(1993, [18526, 600, 433+1203, 5.8, 0]); | |
| 133 | + | AddXYList(1994, [19501, 909, 569+1306, 8, 0]); | |
| 134 | + | AddXYList(1995, [20747, 1500, 665+1348, 11, 0]); | |
| 135 | + | AddXYList(1996, [18340, 2032, 759+1343, 16, 0]); | |
| 136 | + | AddXYList(1997, [18453, 2955, 880+1397, 26, 0]); | |
| 137 | + | AddXYList(1998, [18452, 4489, 1642+1618, 32, 0]); | |
| 138 | + | AddXYList(1999, [20686, 5528, 1849+1740, 42, 0]); | |
| 139 | + | AddXYList(2000, [24867, 9513, 2893+1844, 64, 0]); | |
| 140 | + | AddXYList(2001, [23241, 10509, 3348+1859, 75, 0]); | |
| 141 | + | AddXYList(2002, [23662, 15786, 4089+1949, 162, 0]); | |
| 142 | + | AddXYList(2003, [17722, 18713, 6086+2161, 313, 0]); | |
| 143 | + | AddXYList(2004, [19910, 25509, 7960+2117, 556, 0.2]); | |
| 144 | + | AddXYList(2005, [19576, 27229, 10978+3047, 1282, 0.2]); | |
| 145 | + | AddXYList(2006, [20042, 30710, 14841+3844, 2220, 0.4]); | |
| 146 | + | AddXYList(2007, [21169, 39713, 19760+4521, 3075, 0.4]); | |
| 147 | + | AddXYList(2008, [20446, 40574, 22872+4659, 4420, 17.6]); | |
| 148 | + | AddXYList(2009, [19036, 30602+38, 25989+4352, 6583, 18.8]); | |
| 149 | + | AddXYList(2010, [20956, 37619+174, 29085+4781, 11683, 27.7]); | |
| 150 | + | AddXYList(2011, [17674, 48315+568, 31920+5000, 19340, 18.8]); | |
| 151 | + | AddXYList(2012, [21200, 45325+675, 35950+4900, 28000, 25.4]); | |
| 152 | + | end; | |
| 153 | + | end; | |
| 154 | + | ``` | |
| 155 | + | ||
| 156 | + | Don't forget to link the ListChartSource it to the `Origin` of the CalculatedChartsource. Then compile. Here is the output when `CalculatedChartSource.Percentage = true`: | |
| 157 | + | ||
| 158 | + | 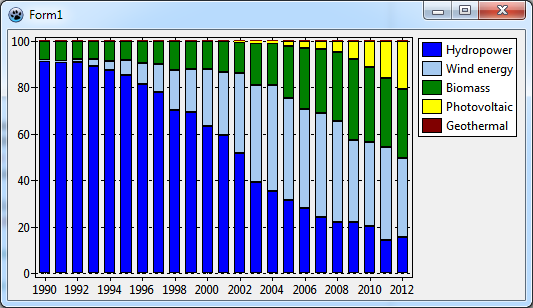 | |
| 159 | + | ||
| 160 | + | ### Refinements | |
| 161 | + | ||
| 162 | + | To complete the chart add a title to the axes ("Year" for the horizontal axis, "Energy, GWh" for the vertical axis. In addition, it would be fine to show a title above the chart ("Generation of renewable energy in Germany"), and a footer with the wikipedia reference. | |
| 163 | + | ||
| 164 | + | Change to `BackColor` of the chart to `clWhite`. Reduce the `Margins.Bottom` to `0` in order to remove the gap between bars and `x` axis. | |
| 165 | + | ||
| 166 | + | Finally you could add a panel with a checkbox to toggle between "normal" and "percentage" view of the stacked bar chart. Let's leave the code to be assigned to the `OnClick` event of the checkbox as a home work... | |
| 167 | + | ||
| 168 | + |  | |
| 169 | + | ||
| 170 | + | ## Summary | |
| 171 | + | ||
| 172 | + | These are the steps to create a stacked bar chart: | |
| 173 | + | ||
| 174 | + | - You need only one series, but it must contain multiple y values | |
| 175 | + | - In the chartsource, set `YCount` to the number of stack levels required. | |
| 176 | + | - Add data to the chartsource by calling `AddXYList`. Be aware that the number of values passed to the array parameter matches the `YCount` specified. | |
| 177 | + | - Add a `TChartStyles` component to the form and link it to the propery `Style` of the BarSeries | |
| 178 | + | - For each stack level, add a `TChartStyle`. | |
| 179 | + | - Select the color of the stacked bar by means of the corresponding ChartStyle. Moreover, enter the legend text in the field `Text` of the ChartStyle. | |
| 180 | + | - To show the ChartStyle text entries in the legend use the value `lmStyle` for the `Legend.Multiplicity` of the series. | |
| 181 | + | - For creating a normalized stacked bar chart, add a `TCalculatedChartSource` to the form. Link its `Origin` property to the chartsource providing the data for plotting. Use the CalculatedChartSource as `Source` of the series. Set the CalculatedChartSource's `Percentage` to `true` in order to activate normalization to 100%. | |
| 182 | + | - The same methodology can be applied to create stacked area and line series. | |
| 183 | + | - Not mentioned in the text, but the BarSeries of Lazarus v2.0+ exposes a property `Stacked` which switches between stacked and side-by-side arrangement of the y values. This simplifies the creation of side-by-side bar charts. | |
| 184 | + | ||
| 185 | + | ## Source code | |
| 186 | + | ||
| 187 | + | ### Project file | |
| 188 | + | ||
| 189 | + | ``` pascal | |
| 190 | + | program project1; | |
| 191 | + | ||
| 192 | + | {$mode objfpc}{$H+} | |
| 193 | + | ||
| 194 | + | uses | |
| 195 | + | {$IFDEF UNIX}{$IFDEF UseCThreads} | |
| 196 | + | cthreads, | |
| 197 | + | {$ENDIF}{$ENDIF} | |
| 198 | + | Interfaces, // this includes the LCL widgetset | |
| 199 | + | Forms, Unit1, tachartlazaruspkg | |
| 200 | + | { you can add units after this }; | |
| 201 | + | ||
| 202 | + | {$R *.res} | |
| 203 | + | ||
| 204 | + | begin | |
| 205 | + | RequireDerivedFormResource := True; | |
| 206 | + | Application.Initialize; | |
| 207 | + | Application.CreateForm(TForm1, Form1); | |
| 208 | + | Application.Run; | |
| 209 | + | end. | |
| 210 | + | ``` | |
| 211 | + | ||
| 212 | + | ### Unit1.pas | |
| 213 | + | ||
| 214 | + | ``` pascal | |
| 215 | + | unit Unit1; | |
| 216 | + | ||
| 217 | + | {$mode objfpc}{$H+} | |
| 218 | + | ||
| 219 | + | interface | |
| 220 | + | ||
| 221 | + | uses | |
| 222 | + | Classes, SysUtils, FileUtil, TAGraph, TASeries, TASources, TAStyles, | |
| 223 | + | Forms, Controls, Graphics, Dialogs, ExtCtrls, StdCtrls; | |
| 224 | + | ||
| 225 | + | type | |
| 226 | + | ||
| 227 | + | { TForm1 } | |
| 228 | + | ||
| 229 | + | TForm1 = class(TForm) | |
| 230 | + | CalculatedChartSource1: TCalculatedChartSource; | |
| 231 | + | Chart1: TChart; | |
| 232 | + | Chart1BarSeries1: TBarSeries; | |
| 233 | + | ChartStyles1: TChartStyles; | |
| 234 | + | CheckBox1: TCheckBox; | |
| 235 | + | ListChartSource1: TListChartSource; | |
| 236 | + | Panel1: TPanel; | |
| 237 | + | procedure CheckBox1Click(Sender: TObject); | |
| 238 | + | procedure FormCreate(Sender: TObject); | |
| 239 | + | private | |
| 240 | + | { private declarations } | |
| 241 | + | public | |
| 242 | + | { public declarations } | |
| 243 | + | end; | |
| 244 | + | ||
| 245 | + | var | |
| 246 | + | Form1: TForm1; | |
| 247 | + | ||
| 248 | + | implementation | |
| 249 | + | ||
| 250 | + | {$R *.lfm} | |
| 251 | + | ||
| 252 | + | { TForm1 } | |
| 253 | + | ||
| 254 | + | procedure TForm1.FormCreate(Sender: TObject); | |
| 255 | + | begin | |
| 256 | + | with ListChartSource1 do begin | |
| 257 | + | // Y0 = Hydropower | |
| 258 | + | // Y1 = Wind energy (off-shore + on-shore) | |
| 259 | + | // Y2 = Biomass + biogenic share of waste | |
| 260 | + | // Y3 = Photovoltaics | |
| 261 | + | // Y4 = Geothermal energy | |
| 262 | + | // all values in GWh | |
| 263 | + | // source: http://en.wikipedia.org/wiki/Renewable_energy_in_Germany | |
| 264 | + | AddXYList(1990, [15580, 71, 221+1213, 0.6, 0]); | |
| 265 | + | AddXYList(1991, [15402, 100, 260+1211, 1.6, 0]); | |
| 266 | + | AddXYList(1992, [18091, 275, 296+1262, 3.2, 0]); | |
| 267 | + | AddXYList(1993, [18526, 600, 433+1203, 5.8, 0]); | |
| 268 | + | AddXYList(1994, [19501, 909, 569+1306, 8, 0]); | |
| 269 | + | AddXYList(1995, [20747, 1500, 665+1348, 11, 0]); | |
| 270 | + | AddXYList(1996, [18340, 2032, 759+1343, 16, 0]); | |
| 271 | + | AddXYList(1997, [18453, 2955, 880+1397, 26, 0]); | |
| 272 | + | AddXYList(1998, [18452, 4489, 1642+1618, 32, 0]); | |
| 273 | + | AddXYList(1999, [20686, 5528, 1849+1740, 42, 0]); | |
| 274 | + | AddXYList(2000, [24867, 9513, 2893+1844, 64, 0]); | |
| 275 | + | AddXYList(2001, [23241, 10509, 3348+1859, 75, 0]); | |
| 276 | + | AddXYList(2002, [23662, 15786, 4089+1949, 162, 0]); | |
| 277 | + | AddXYList(2003, [17722, 18713, 6086+2161, 313, 0]); | |
| 278 | + | AddXYList(2004, [19910, 25509, 7960+2117, 556, 0.2]); | |
| 279 | + | AddXYList(2005, [19576, 27229, 10978+3047, 1282, 0.2]); | |
| 280 | + | AddXYList(2006, [20042, 30710, 14841+3844, 2220, 0.4]); | |
| 281 | + | AddXYList(2007, [21169, 39713, 19760+4521, 3075, 0.4]); | |
| 282 | + | AddXYList(2008, [20446, 40574, 22872+4659, 4420, 17.6]); | |
| 283 | + | AddXYList(2009, [19036, 30602+38, 25989+4352, 6583, 18.8]); | |
| 284 | + | AddXYList(2010, [20956, 37619+174, 29085+4781, 11683, 27.7]); | |
| 285 | + | AddXYList(2011, [17674, 48315+568, 31920+5000, 19340, 18.8]); | |
| 286 | + | AddXYList(2012, [21200, 45325+675, 35950+4900, 28000, 25.4]); | |
| 287 | + | end; | |
| 288 | + | end; | |
| 289 | + | ||
| 290 | + | procedure TForm1.CheckBox1Click(Sender: TObject); | |
| 291 | + | begin | |
| 292 | + | CalculatedChartSource1.Percentage := Checkbox1.Checked; | |
| 293 | + | if Checkbox1.Checked then | |
| 294 | + | Chart1.LeftAxis.Title.Caption := 'Contribution, %' | |
| 295 | + | else | |
| 296 | + | Chart1.LeftAxis.Title.Caption := 'Energy, GWh'; | |
| 297 | + | end; | |
| 298 | + | ||
| 299 | + | end. | |
| 300 | + | ``` | |
| 301 | + | ||
| 302 | + | ### Unit1.lfm | |
| 303 | + | ||
| 304 | + | ``` pascal | |
| 305 | + | object Form1: TForm1 | |
| 306 | + | Left = 596 | |
| 307 | + | Height = 270 | |
| 308 | + | Top = 353 | |
| 309 | + | Width = 517 | |
| 310 | + | Caption = 'Form1' | |
| 311 | + | ClientHeight = 270 | |
| 312 | + | ClientWidth = 517 | |
| 313 | + | OnCreate = FormCreate | |
| 314 | + | LCLVersion = '1.3' | |
| 315 | + | object Chart1: TChart | |
| 316 | + | Left = 0 | |
| 317 | + | Height = 248 | |
| 318 | + | Top = 22 | |
| 319 | + | Width = 517 | |
| 320 | + | AxisList = < | |
| 321 | + | item | |
| 322 | + | Minors = <> | |
| 323 | + | Title.LabelFont.Orientation = 900 | |
| 324 | + | Title.LabelFont.Style = [fsBold] | |
| 325 | + | Title.Visible = True | |
| 326 | + | Title.Caption = 'Energy, GWh' | |
| 327 | + | end | |
| 328 | + | item | |
| 329 | + | Alignment = calBottom | |
| 330 | + | Minors = <> | |
| 331 | + | Title.LabelFont.Style = [fsBold] | |
| 332 | + | Title.Visible = True | |
| 333 | + | Title.Caption = 'Year' | |
| 334 | + | end> | |
| 335 | + | BackColor = clWhite | |
| 336 | + | Foot.Alignment = taLeftJustify | |
| 337 | + | Foot.Brush.Color = clBtnFace | |
| 338 | + | Foot.Font.Color = clGray | |
| 339 | + | Foot.Text.Strings = ( | |
| 340 | + | 'Source: http://en.wikipedia.org/wiki/Renewable_energy_in_Germany' | |
| 341 | + | ) | |
| 342 | + | Foot.Visible = True | |
| 343 | + | Legend.Visible = True | |
| 344 | + | Margins.Bottom = 0 | |
| 345 | + | Title.Brush.Color = clBtnFace | |
| 346 | + | Title.Font.Color = clBlue | |
| 347 | + | Title.Font.Style = [fsBold] | |
| 348 | + | Title.Text.Strings = ( | |
| 349 | + | 'Generation of renewable energy in Germany' | |
| 350 | + | ) | |
| 351 | + | Title.Visible = True | |
| 352 | + | Align = alClient | |
| 353 | + | ParentColor = False | |
| 354 | + | object Chart1BarSeries1: TBarSeries | |
| 355 | + | Legend.Multiplicity = lmStyle | |
| 356 | + | BarBrush.Color = clRed | |
| 357 | + | Source = CalculatedChartSource1 | |
| 358 | + | Styles = ChartStyles1 | |
| 359 | + | end | |
| 360 | + | end | |
| 361 | + | object Panel1: TPanel | |
| 362 | + | Left = 0 | |
| 363 | + | Height = 22 | |
| 364 | + | Top = 0 | |
| 365 | + | Width = 517 | |
| 366 | + | Align = alTop | |
| 367 | + | BevelOuter = bvNone | |
| 368 | + | ClientHeight = 22 | |
| 369 | + | ClientWidth = 517 | |
| 370 | + | TabOrder = 1 | |
| 371 | + | object CheckBox1: TCheckBox | |
| 372 | + | Left = 8 | |
| 373 | + | Height = 19 | |
| 374 | + | Top = 0 | |
| 375 | + | Width = 119 | |
| 376 | + | Caption = 'Normalize to 100%' | |
| 377 | + | OnClick = CheckBox1Click | |
| 378 | + | TabOrder = 0 | |
| 379 | + | end | |
| 380 | + | end | |
| 381 | + | object ChartStyles1: TChartStyles | |
| 382 | + | Styles = < | |
| 383 | + | item | |
| 384 | + | Brush.Color = clBlue | |
| 385 | + | Text = 'Hydropower' | |
| 386 | + | end | |
| 387 | + | item | |
| 388 | + | Brush.Color = clSkyBlue | |
| 389 | + | Text = 'Wind energy' | |
| 390 | + | end | |
| 391 | + | item | |
| 392 | + | Brush.Color = clGreen | |
| 393 | + | Text = 'Biomass' | |
| 394 | + | end | |
| 395 | + | item | |
| 396 | + | Brush.Color = clYellow | |
| 397 | + | Text = 'Photovoltaic' | |
| 398 | + | end | |
| 399 | + | item | |
| 400 | + | Brush.Color = clMaroon | |
| 401 | + | Text = 'Geothermal' | |
| 402 | + | end> | |
| 403 | + | left = 336 | |
| 404 | + | top = 96 | |
| 405 | + | end | |
| 406 | + | object CalculatedChartSource1: TCalculatedChartSource | |
| 407 | + | Origin = ListChartSource1 | |
| 408 | + | left = 104 | |
| 409 | + | top = 96 | |
| 410 | + | end | |
| 411 | + | object ListChartSource1: TListChartSource | |
| 412 | + | YCount = 5 | |
| 413 | + | left = 232 | |
| 414 | + | top = 96 | |
| 415 | + | end | |
| 416 | + | end | |
| 417 | + | ``` | |
| 418 | + | ||
| 419 | + | --- | |
| 420 | + | *From the Free Pascal wiki, page "TAChart Tutorial: Stacked BarSeries", as it stood on 2020-02-29 after a change by Trev, out of the wiki's dump of 2024-05-26. Copyright stays with the author who wrote it, according to the old wiki's [[Licensing]] page. If you have concerns about this material, [message the admin](/wiki-contact).* |