

TAChart Tutorial: Multiple Panes in one Chart: what changed
Revision 1 to 2. Removed lines have a minus sign; added lines have a plus sign.
| Old | New | Line | |
|---|---|---|---|
| 1 | 1 | ## Introduction | |
| 2 | 2 | ||
| 3 | 3 | This tutorial shows how to create a chart with multiple series in their own panes and with their own left axes and one common bottom axis. It was created while checking out the nice "Panes demo" which you can find in the folder `components/tachart/demo/panes` of your Lazarus installation. Since a second topic is included in this sample project it may be a bit difficult to catch the basic idea. So here we explain how you can do this from scratch. | |
| 4 | 4 | ||
| 5 | 5 | The setup of charts, axes, series and panes in TAChart is not done from a single dialog window. Instead you add components and change their settings in the object inspector to get the wanted behaviour. | |
| 6 | 6 | ||
| 7 | 7 | Three types of components will be needed for the demo: | |
| 8 | 8 | ||
| 9 | 9 | - TChart | |
| 10 | 10 | - TChartAxisTransformation, and | |
| 11 | 11 | - TRandomChartSource. | |
| 12 | 12 | ||
| 13 | 13 | At designtime a series is added to the chart using the Series Editor. The chart component has a property called `AxisList` where additional axes can be added. This one is important. | |
| 14 | 14 | ||
| 15 | 15 | So lets start! | |
| 16 | 16 | ||
| 17 | 17 | ## Step by step | |
| 18 | 18 | ||
| 19 | 19 | ### Add chart and series | |
| 20 | 20 | ||
| 21 | 21 | Start a new project and save it. Drop a `TChart` on the main form and align it to client. Right-click the chart to access the Series Editor. Add three LineSeries from the Series Editor. Set the `SeriesColor` of the three series to `clRed`, `clBlue`, and `clLime`, respectively. | |
| 22 | 22 | ||
| 23 | 23 | ### Add random data to the series | |
| 24 | 24 | ||
| 25 | 25 | Add three `TRandomChartSource` components to the form and set their values using the Object Inspector: | |
| 26 | 26 | ||
| 27 | 27 | - `PointsNumber` 100 (100 random values will be added to the linked series. ) | |
| 28 | 28 | - `XMax` 50 (For the bottom axis) | |
| 29 | 29 | - `XMin` 0 (For the bottom axis) | |
| 30 | 30 | - `YCount` 1 | |
| 31 | 31 | - `YMax` 50 (For left axes) | |
| 32 | 32 | - `YMin` 0 (For left axes) | |
| 33 | 33 | ||
| 34 | 34 | Then proceed with: | |
| 35 | 35 | ||
| 36 | 36 | - Go to `Chart1LineSeries1` "Source" property and set it to `RandomChartSource1` | |
| 37 | 37 | - Go to `Chart1LineSeries2` "Source" property and set it to `RandomChartSource2` | |
| 38 | 38 | - Go to `Chart1LineSeries3` "Source" property and set it to `RandomChartSource3` | |
| 39 | 39 | ||
| 40 | 40 | Now you will have visible graphs on the charts. But the chart is very crowded because all series still share the same axis. | |
| 41 | 41 | ||
| 42 | 42 | ### Add more axes | |
| 43 | 43 | ||
| 44 | 44 | Now we are going to create the separate axes. Click the chart, go to the Object Inspector and find the charts AxisList property. Bring up the AxisList Editor and add two more axes of the "Left axis" type. The new axes will have the indices 2 and 3. (The old, original y axis has the index 0 and the x axis has index 1). | |
| 45 | 45 | ||
| 46 | 46 | ### Link series to axes | |
| 47 | 47 | ||
| 48 | 48 | Go to the Series Editor again and: | |
| 49 | 49 | ||
| 50 | 50 | - For `Chart1LineSeries1` set the property `AxisIndexY` to 0 | |
| 51 | 51 | - For `LineSeries2` set the property `AxisIndexY` to 2 | |
| 52 | 52 | - For `LineSeries3` set the property `AxisIndexY` to 3 | |
| 53 | 53 | ||
| 54 | 54 | ### Group the axes | |
| 55 | 55 | ||
| 56 | 56 | An axis has a property named `Group`. By setting all left axes to the same group, the values are put together in a vertical line. For each Left Axis in this example, set the Group property to 1 and leave the Bottom Axis at 0. | |
| 57 | 57 | ||
| 58 | 58 | ### Set the axis range | |
| 59 | 59 | ||
| 60 | 60 | Go to the AxisList property of the Chart and bring up the AxisList Editor. Edit the `Marks.Range` of each y axis so that they look like this: | |
| 61 | 61 | ||
| 62 | 62 | - `Marks.Range.Max`: 50 | |
| 63 | 63 | - `Marks.Range.Min`: 0 | |
| 64 | 64 | - `Marks.Range.UseMax`: True | |
| 65 | 65 | - `Marks.Range.UseMin`: True | |
| 66 | 66 | ||
| 67 | 67 | This step separates the axis labels of each pane. Otherwise, the labels of one pane would overlap those from the other panes. | |
| 68 | 68 | ||
| 69 | 69 | (Accordingly, you can also set the `Range` properties of each y axis (without the "Marks"!) in order to achieve a consistent scaling of the three axes). | |
| 70 | 70 | ||
| 71 | 71 | ### Use chart axis transformations | |
| 72 | 72 | ||
| 73 | 73 | In order to split the three series into separate panes we need to transform the axis coordinate system such that each axis is drawn only in its own region. This is done by means of [[TAChart documentation|ChartAxisTransformations]]. | |
| 74 | 74 | ||
| 75 | 75 | TAChart employs three coordinate systems in the transition from "real world" data to the pixels on the screen: | |
| 76 | 76 | ||
| 77 | 77 | - [[TAChart documentation|Axis coordinates]] are the coordinates in which the data come in, or, in other words, which are labeled along the axes. In our project, these are numbers ranging between 0 and 50 as setup for the RandomChartSources. | |
| 78 | 78 | - [[TAChart documentation|Graph coordinates]] are obtained after applying transformations. For our particular purpose there is an [[TAChart documentation|AutoScaleAxisTransform]] which maps the data range of the "real world" data onto a given graph coordinate range of the axis. | |
| 79 | 79 | - [[TAChart documentation|Image coordinates]] belong to the pixels on the screen calculated from the graph coordinates. | |
| 80 | 80 | ||
| 81 | 81 | We can setup the graph coordinates in any convenient way. Suppose, the graph coordinates range from 0 to 6 (we could use any other numbers, but these are easy to calculate with). Then we can have the effect of three separate panes by assigning the first y axis to the lower third, the second y axis to the middle third, and the third y axis to the upper third of the entire range. Therefore, the first series will be plotted in the lower third of the chart since it is linked to the first y axis, etc. | |
| 82 | 82 | ||
| 83 | 83 | In practice, add three `ChartAxisTransformations` to the form. Double-click on each (or find the property `List` in the Object Inspector of the `ChartAxisTransform`) and bring up the "Axis Transformations Editor". Click "Add" to create a Transformation and choose "Autoscale"). This adds an `AutoScaleAxisTransform` to each `ChartAxisTransformations` component. Select each `AutoScaleAxisTransform` and enter the following numbers for the properties `MaxValue` and `MinValue` which define the range for the axis transform: | |
| 84 | 84 | ||
| 85 | 85 | `ChartAxisTransformations1AutoScaleAxisTransform1`: `MaxValue` 1.85 and `MinValue` 0.15 `ChartAxisTransformations1AutoScaleAxisTransform2`: `MaxValue` 3.85 and `MinValue` 2.15 `ChartAxisTransformations1AutoScaleAxisTransform3`: `MaxValue` 5.85 and `MinValue` 4.15 | |
| 86 | 86 | ||
| 87 | 87 | Note that these numbers are offset by 0.15 from the thirds discussed above (0 to 2, 2 to 4, and 4 to 6). This produces a little gap between the panes and makes the chart more pleasant. | |
| 88 | 88 | ||
| 89 | 89 | The entire mapping procedure is sketched in the next diagram: | |
| 90 | 90 | ||
| 91 | 91 | 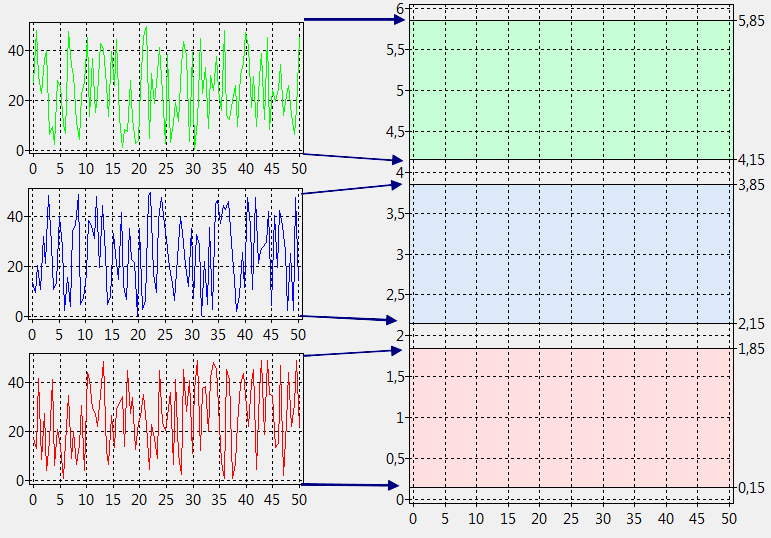 | |
| 92 | 92 | ||
| 93 | 93 | Bring up the Object Inspector for the chart, choose the `AxisList` property to get the AxisList Editor and connect each left axis to the corresponding transformation. This is done by editing the "transformations" property of each y axis: | |
| 94 | 94 | ||
| 95 | 95 | - 0 - Left: `Transformations = 'ChartAxisTransformations1'` | |
| 96 | 96 | - 2 - Left: `Transformations = 'ChartAxisTransformations2'` | |
| 97 | 97 | - 3 - Left: `Transformations = 'ChartAxisTransformations3'` | |
| 98 | 98 | ||
| 99 | 99 | To get the correct spacing at the top and at the bottom of the chart we must let the y axis extends match our chosen graph coordinates range of 0 to 6. Go to the Chart properties and edit the these extent settings: | |
| 100 | 100 | ||
| 101 | 101 | - `Extent.YMax`: 6 | |
| 102 | 102 | - `Extent.YMin`: 0 | |
| 103 | 103 | - `Extent.UseYMax`: true | |
| 104 | 104 | - `Extent.UseYMin`: true | |
| 105 | 105 | ||
| 106 | 106 | ### Adding axis titles | |
| 107 | 107 | ||
| 108 | 108 | Finally we add titles to the axis. In the Object Inspector set the following properties of each axis: | |
| 109 | 109 | ||
| 110 | 110 | - 0 - Left: `Title.Caption = 'bottom y axis'` | |
| 111 | 111 | - 1 - Bottom: `Title.Caption = 'x axis'` | |
| 112 | 112 | - 2 - Left: `Title.Caption = 'center y axis'` | |
| 113 | 113 | - 3 - Left: `Title.Caption = 'top y axis'` | |
| 114 | 114 | ||
| 115 | 115 | Set the property `Visible` of each axis title to true to show the titles. However, you'll notice two issues: | |
| 116 | 116 | ||
| 117 | 117 | 1. The titles of the manually created y axes are not rotated by 90 degress. To fix this, go to the `Font.Orientation` property of the `Title` properties of these axes and enter the value `900`. This is the rotation angle in tenths of degrees. | |
| 118 | 118 | 2. All y axes are drawn in the center of the vertical chart extent and, therefore, overlap. It would be better if each title would be drawn within the range of the corresponding axis. To fix this set the property `PositionOnMarks` of the `Title` of each axis to true. | |
| 119 | 119 | ||
| 120 | 120 | ## Result | |
| 121 | 121 | ||
| 122 | 122 | Now your application should look like this: | |
| 123 | 123 | ||
| 124 | 124 | 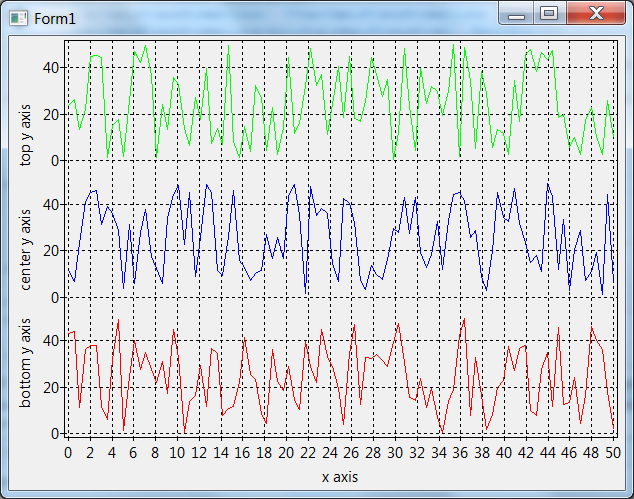 | |
| 125 | 125 | ||
| 126 | 126 | ## Source code | |
| 127 | 127 | ||
| 128 | 128 | ### Project file | |
| 129 | 129 | ||
| 130 | 130 | ``` pascal | |
| 131 | 131 | program panes_demo; | |
| 132 | 132 | ||
| 133 | 133 | {$mode objfpc}{$H+} | |
| 134 | 134 | ||
| 135 | 135 | uses | |
| 136 | 136 | {$IFDEF UNIX}{$IFDEF UseCThreads} | |
| 137 | 137 | cthreads, | |
| 138 | 138 | {$ENDIF}{$ENDIF} | |
| 139 | 139 | Interfaces, // this includes the LCL widgetset | |
| 140 | 140 | Forms, Unit1, tachartlazaruspkg | |
| 141 | 141 | { you can add units after this }; | |
| 142 | 142 | ||
| 143 | 143 | {$R *.res} | |
| 144 | 144 | ||
| 145 | 145 | begin | |
| 146 | 146 | Application.Title := 'TAChart panes demo'; | |
| 147 | 147 | RequireDerivedFormResource := True; | |
| 148 | 148 | Application.Initialize; | |
| 149 | 149 | Application.CreateForm(TForm1, Form1); | |
| 150 | 150 | Application.Run; | |
| 151 | 151 | end. | |
| 152 | 152 | ``` | |
| 153 | 153 | ||
| 154 | 154 | ### Unit1.pas | |
| 155 | 155 | ||
| 156 | 156 | ``` pascal | |
| 157 | 157 | unit Unit1; | |
| 158 | 158 | ||
| 159 | 159 | {$mode objfpc}{$H+} | |
| 160 | 160 | ||
| 161 | 161 | interface | |
| 162 | 162 | ||
| 163 | 163 | uses | |
| 164 | 164 | Classes, SysUtils, Forms, Controls, Graphics, Dialogs, | |
| 165 | 165 | TAGraph, TASeries, TASources, TATransformations; | |
| 166 | 166 | ||
| 167 | 167 | type | |
| 168 | 168 | ||
| 169 | 169 | { TForm1 } | |
| 170 | 170 | ||
| 171 | 171 | TForm1 = class(TForm) | |
| 172 | 172 | Chart1: TChart; | |
| 173 | 173 | Chart1LineSeries1: TLineSeries; | |
| 174 | 174 | Chart1LineSeries2: TLineSeries; | |
| 175 | 175 | Chart1LineSeries3: TLineSeries; | |
| 176 | 176 | ChartAxisTransformations1: TChartAxisTransformations; | |
| 177 | 177 | ChartAxisTransformations1AutoScaleAxisTransform1: TAutoScaleAxisTransform; | |
| 178 | 178 | ChartAxisTransformations2: TChartAxisTransformations; | |
| 179 | 179 | ChartAxisTransformations2AutoScaleAxisTransform1: TAutoScaleAxisTransform; | |
| 180 | 180 | ChartAxisTransformations3: TChartAxisTransformations; | |
| 181 | 181 | ChartAxisTransformations3AutoScaleAxisTransform1: TAutoScaleAxisTransform; | |
| 182 | 182 | RandomChartSource1: TRandomChartSource; | |
| 183 | 183 | RandomChartSource2: TRandomChartSource; | |
| 184 | 184 | RandomChartSource3: TRandomChartSource; | |
| 185 | 185 | end; | |
| 186 | 186 | ||
| 187 | 187 | var | |
| 188 | 188 | Form1: TForm1; | |
| 189 | 189 | ||
| 190 | 190 | implementation | |
| 191 | 191 | ||
| 192 | 192 | {$R *.lfm} | |
| 193 | 193 | ||
| 194 | 194 | end. | |
| 195 | 195 | ``` | |
| 196 | 196 | ||
| 197 | 197 | ### Unit1.lfm | |
| 198 | 198 | ||
| 199 | - | ||
| 199 | + | ``` lfm | |
| 200 | 200 | object Form1: TForm1 | |
| 201 | 201 | Left = 425 | |
| 202 | 202 | Height = 454 | |
| 203 | 203 | Top = 249 | |
| 204 | 204 | Width = 616 | |
| 205 | 205 | Caption = 'Form1' | |
| 206 | 206 | ClientHeight = 454 | |
| 207 | 207 | ClientWidth = 616 | |
| 208 | 208 | LCLVersion = '1.1' | |
| 209 | 209 | object Chart1: TChart | |
| 210 | 210 | Left = 0 | |
| 211 | 211 | Height = 454 | |
| 212 | 212 | Top = 0 | |
| 213 | 213 | Width = 616 | |
| 214 | 214 | AxisList = < | |
| 215 | 215 | item | |
| 216 | 216 | Group = 1 | |
| 217 | 217 | Marks.Range.Max = 50 | |
| 218 | 218 | Marks.Range.UseMax = True | |
| 219 | 219 | Marks.Range.UseMin = True | |
| 220 | 220 | Minors = <> | |
| 221 | 221 | Range.Max = 50 | |
| 222 | 222 | Range.UseMax = True | |
| 223 | 223 | Range.UseMin = True | |
| 224 | 224 | Title.LabelFont.Orientation = 900 | |
| 225 | 225 | Title.Visible = True | |
| 226 | 226 | Title.Caption = 'bottom y axis' | |
| 227 | 227 | Title.PositionOnMarks = True | |
| 228 | 228 | Transformations = ChartAxisTransformations1 | |
| 229 | 229 | end | |
| 230 | 230 | item | |
| 231 | 231 | Alignment = calBottom | |
| 232 | 232 | Minors = <> | |
| 233 | 233 | Title.Visible = True | |
| 234 | 234 | Title.Caption = 'x axis' | |
| 235 | 235 | end | |
| 236 | 236 | item | |
| 237 | 237 | Group = 1 | |
| 238 | 238 | Marks.Range.Max = 50 | |
| 239 | 239 | Marks.Range.UseMax = True | |
| 240 | 240 | Marks.Range.UseMin = True | |
| 241 | 241 | Minors = <> | |
| 242 | 242 | Range.Max = 50 | |
| 243 | 243 | Range.UseMax = True | |
| 244 | 244 | Range.UseMin = True | |
| 245 | 245 | Title.LabelFont.Orientation = 900 | |
| 246 | 246 | Title.Visible = True | |
| 247 | 247 | Title.Caption = 'center y axis' | |
| 248 | 248 | Title.PositionOnMarks = True | |
| 249 | 249 | Transformations = ChartAxisTransformations2 | |
| 250 | 250 | end | |
| 251 | 251 | item | |
| 252 | 252 | Group = 1 | |
| 253 | 253 | Marks.Range.Max = 50 | |
| 254 | 254 | Marks.Range.UseMax = True | |
| 255 | 255 | Marks.Range.UseMin = True | |
| 256 | 256 | Minors = <> | |
| 257 | 257 | Range.Max = 50 | |
| 258 | 258 | Range.UseMax = True | |
| 259 | 259 | Range.UseMin = True | |
| 260 | 260 | Title.Margins.Bottom = 4 | |
| 261 | 261 | Title.LabelFont.Orientation = 900 | |
| 262 | 262 | Title.Visible = True | |
| 263 | 263 | Title.Caption = 'top y axis' | |
| 264 | 264 | Title.PositionOnMarks = True | |
| 265 | 265 | Transformations = ChartAxisTransformations3 | |
| 266 | 266 | end> | |
| 267 | 267 | Extent.UseYMax = True | |
| 268 | 268 | Extent.UseYMin = True | |
| 269 | 269 | Extent.YMax = 6 | |
| 270 | 270 | Foot.Brush.Color = clBtnFace | |
| 271 | 271 | Foot.Font.Color = clBlue | |
| 272 | 272 | Title.Brush.Color = clBtnFace | |
| 273 | 273 | Title.Font.Color = clBlue | |
| 274 | 274 | Title.Text.Strings = ( | |
| 275 | 275 | 'TAChart' | |
| 276 | 276 | ) | |
| 277 | 277 | Align = alClient | |
| 278 | 278 | ParentColor = False | |
| 279 | 279 | object Chart1LineSeries1: TLineSeries | |
| 280 | 280 | AxisIndexY = 0 | |
| 281 | 281 | LinePen.Color = clRed | |
| 282 | 282 | Source = RandomChartSource1 | |
| 283 | 283 | end | |
| 284 | 284 | object Chart1LineSeries2: TLineSeries | |
| 285 | 285 | AxisIndexY = 2 | |
| 286 | 286 | LinePen.Color = clBlue | |
| 287 | 287 | Source = RandomChartSource2 | |
| 288 | 288 | end | |
| 289 | 289 | object Chart1LineSeries3: TLineSeries | |
| 290 | 290 | AxisIndexY = 3 | |
| 291 | 291 | LinePen.Color = clLime | |
| 292 | 292 | Source = RandomChartSource3 | |
| 293 | 293 | end | |
| 294 | 294 | end | |
| 295 | 295 | object RandomChartSource1: TRandomChartSource | |
| 296 | 296 | PointsNumber = 100 | |
| 297 | 297 | RandSeed = 1497444274 | |
| 298 | 298 | XMax = 50 | |
| 299 | 299 | XMin = 0 | |
| 300 | 300 | YMax = 50 | |
| 301 | 301 | YMin = 0 | |
| 302 | 302 | left = 122 | |
| 303 | 303 | top = 46 | |
| 304 | 304 | end | |
| 305 | 305 | object RandomChartSource2: TRandomChartSource | |
| 306 | 306 | PointsNumber = 100 | |
| 307 | 307 | RandSeed = 1497485782 | |
| 308 | 308 | XMax = 50 | |
| 309 | 309 | XMin = 0 | |
| 310 | 310 | YMax = 50 | |
| 311 | 311 | YMin = 0 | |
| 312 | 312 | left = 123 | |
| 313 | 313 | top = 123 | |
| 314 | 314 | end | |
| 315 | 315 | object RandomChartSource3: TRandomChartSource | |
| 316 | 316 | PointsNumber = 100 | |
| 317 | 317 | RandSeed = 1497547025 | |
| 318 | 318 | XMax = 50 | |
| 319 | 319 | XMin = 0 | |
| 320 | 320 | YMax = 50 | |
| 321 | 321 | YMin = 0 | |
| 322 | 322 | left = 122 | |
| 323 | 323 | top = 208 | |
| 324 | 324 | end | |
| 325 | 325 | object ChartAxisTransformations1: TChartAxisTransformations | |
| 326 | 326 | left = 369 | |
| 327 | 327 | top = 46 | |
| 328 | 328 | object ChartAxisTransformations1AutoScaleAxisTransform1: TAutoScaleAxisTransform | |
| 329 | 329 | MaxValue = 1.85 | |
| 330 | 330 | MinValue = 0.15 | |
| 331 | 331 | end | |
| 332 | 332 | end | |
| 333 | 333 | object ChartAxisTransformations2: TChartAxisTransformations | |
| 334 | 334 | left = 370 | |
| 335 | 335 | top = 123 | |
| 336 | 336 | object ChartAxisTransformations2AutoScaleAxisTransform1: TAutoScaleAxisTransform | |
| 337 | 337 | MaxValue = 3.85 | |
| 338 | 338 | MinValue = 2.15 | |
| 339 | 339 | end | |
| 340 | 340 | end | |
| 341 | 341 | object ChartAxisTransformations3: TChartAxisTransformations | |
| 342 | 342 | left = 365 | |
| 343 | 343 | top = 208 | |
| 344 | 344 | object ChartAxisTransformations3AutoScaleAxisTransform1: TAutoScaleAxisTransform | |
| 345 | 345 | MaxValue = 5.85 | |
| 346 | 346 | MinValue = 4.15 | |
| 347 | 347 | end | |
| 348 | 348 | end | |
| 349 | 349 | end | |
| 350 | 350 | ``` | |
| 351 | 351 | ||
| 352 | 352 | --- | |
| 353 | 353 | *From the Free Pascal wiki, page "TAChart Tutorial: Multiple Panes in one Chart", as it stood on 2022-09-06 after a change by Andries, out of the wiki's dump of 2024-05-26. Copyright stays with the author who wrote it, according to the old wiki's [[Licensing]] page. If you have concerns about this material, [message the admin](/wiki-contact).* | |
| 354 | 354 | Category: Components | |
| 355 | 355 | Category: Graphics | |
| 356 | 356 | Category: Lazarus | |
| 357 | 357 | Category: TAChart | |
| 358 | 358 | Category: Tutorials |