

TAChart Tutorial: ListChartSource, Logarithmic Axis, Fitting/fi: what changed
Revision 1 to 2. Removed lines have a minus sign; added lines have a plus sign.
| Old | New | Line | |
|---|---|---|---|
| 1 | 1 | ## Johdanto | |
| 2 | 2 | ||
| 3 | 3 | 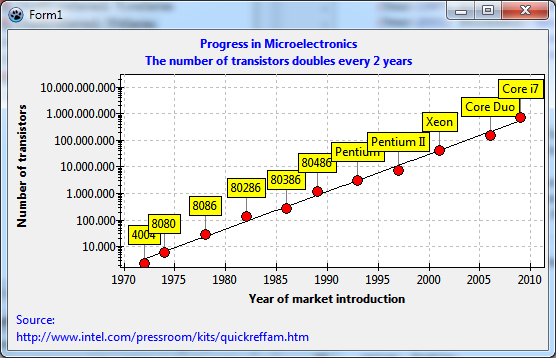 | |
| 4 | 4 | ||
| 5 | 5 | Tiedätkö mikä on [Mooren laki](http://fi.wikipedia.org/wiki/Mooren_laki)? Siihen tutustutaan tässä esimerkissä. | |
| 6 | 6 | ||
| 7 | 7 | Lukiessasi tätä olet todennäköisesti pöytätietokoneen, kannettavan tai älypuhelimen ääressä. Valtava edistyminen mikrotietokoneteknologiassa on tapahtunut viimeisten vuosikymmenten aikana ja on edelleen käynnissä. Tämä pienentäminen elektronissa laitteissa mahdollistaa pakata yhä enemmän toimintoja yhdelle piisirulle. Ja mitä Mooren laki on: transistoreiden määrä sirulla on kaksinkertaistunut noin kahden vuoden välein. | |
| 8 | 8 | ||
| 9 | 9 | Tässä opetusohjelmassa otamme datan mikroprosessorien valmistajan julkaistuista tiedoista ja käytetään TAChart piirtämään transistoreihen määrää piirillä eri vuosina markkinoille tulleista tuotteista. Näiden tietojen avulla yritämme vahvistaa Mooren lain. | |
| 10 | 10 | ||
| 11 | 11 | Tässä käytettävä data löytyy sivustolta [www.intel.com/pressroom/kits/quickreffam.htm](http://www.intel.com/pressroom/kits/quickreffam.htm) joka sisältää luettelon mikroprosessoreista, ajankohdista niiden tuomisista markkinoille ja niiden sisältämä transistorin määrä per piiri. | |
| 12 | 12 | ||
| 13 | 13 | Tässä esimerkissä opitaan | |
| 14 | 14 | ||
| 15 | 15 | - miten syötetään dataa suunnitteluaikana | |
| 16 | 16 | - miten luodaan pistekuvaaja jossa nimiteksti kullakin datapisteellä | |
| 17 | 17 | - miten luodaan logaritminen akseli | |
| 18 | 18 | - miten sovittaa yhtälö tietoihin. | |
| 19 | 19 | ||
| 20 | 20 | Sinulla pitäisi olla joitakin perustietoja miten työskennellä TAChart-komponentin kanssa jos ei ole niin katso [[TAChart Tutorial: Getting started/fi|TAChart:n aloitusopas]]. Tietenkin, sinun on tunnettava [[Lazarus]] ja [[Object Pascal]] . Eikä myöskään saisi pelätä matematiikkaa (käytössä logaritmit ja eksponenttifunktio). | |
| 21 | 21 | ||
| 22 | 22 | ## Valmistautuminen | |
| 23 | 23 | ||
| 24 | 24 | ### Kaavion tekeminen | |
| 25 | 25 | ||
| 26 | 26 | - Luo uusi projekti. | |
| 27 | 27 | - Koska laitamme joitakin pitkiä otsikoita akselille niin kasvata lomakkeen kokoa vähintään 540 x 320 pikseliin. | |
| 28 | 28 | - Lisää `TChart` komponentti, laita komponenttimuokkaimessa sen align arvoon `alClient`, Aseta sen `BackColor` arvoksi `clWhite` ja `Grid.Color` molemmille akselille arvoon `clSilver`. | |
| 29 | 29 | - Lisää otsikoksi x-akselille "Year of market introduction" (tai suomenkielisenä "Markkinoilletulo vuosi") ja y-akselille "Number of transistors" (Transistorien määrä). | |
| 30 | 30 | - Lisää teksti "Progress in Microelectronics" (tai "Mikroelektroniikan edistys") koko kaavion otsikoksi. | |
| 31 | 31 | - Aseta näiden fontin tyyliksi `fsBold`. | |
| 32 | 32 | - Näytä viitteenä datan lähde alatunnisteessa. Käytä kaavion ominaisuutta [[TAChart documentation|Foot]] siinä. Huomaa, että omaisuus `Foot.Text` (samoin kuin `Title.Text` ) voi syöttää usean rivin otsikon. | |
| 33 | 33 | ||
| 34 | 34 | 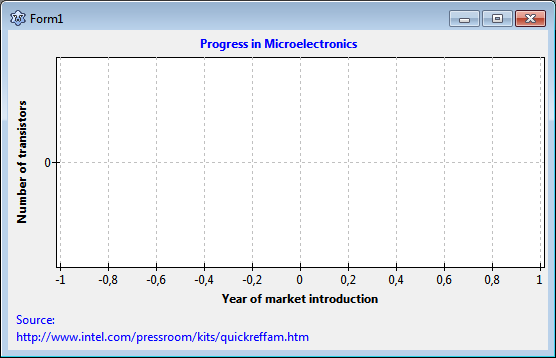 | |
| 35 | 35 | ||
| 36 | 36 | ### Luodaan pistekuvaaja | |
| 37 | 37 | ||
| 38 | 38 | Kun halutaan piirtää kullekin datatietueelle yksi piste - tätä usein kutsutaan pistekuvaajaksi muissa kaavio-ohjelmissa. TAChart kuvajaajissa ei ole tälläistä kuvaajaa koska [[TAChart documentation|TLineSeries]] voi tehdä tämän yhtähyvin. Laittamalla sen ominaisuus `ShowPoints` arvoon `true` ja poistamalla yhdistävät viivat (`LineType` = `ltNone`). Näytettävat datapisteet kuvataan ominaisuudessa `Pointer`. | |
| 39 | 39 | ||
| 40 | 40 | Niin lisätään viivakuvaaja (LineSeries) ja asetetaan sen ominaisuudet niin että siitä tulee pistekuvaaja. Lisäksi asetetaan `Pointer.Brush.Color` arvoon `clRed` ja `Pointer.Style` arvoon `psCircle` tämä asettaa näyttämään kunkin datapisteen punaiselta ympyrältä. | |
| 41 | 41 | ||
| 42 | 42 | ## Syötetään data | |
| 43 | 43 | ||
| 44 | 44 | ### ListChartSource | |
| 45 | 45 | ||
| 46 | 46 | On monia tapoja, joilla tietoja voidaan syöttää kaavioon. Nyt tässä käytetään [[TAChart documentation|ListChartSource]]:a. Yleensä tiedot ladataan tähän dynaamisesti ajon aikana, esimerkiksi lukemalla tiedot tiedostosta. Tässä projektissa kuitenkin data syötetään suunnitteluaikana käyttämällä datapisteen päätoimittaja ListChartSource. Tämän suurin etu on että kaikki muutokset, jotka tehdään kaavioon näytetään heti, ei tarvitse edes kääntää projektia. Kuten , on kuitenkin olemassa joitakin haittoja samoin. | |
| 47 | 47 | ||
| 48 | 48 | ListChartSource tallentaa piirrettävän datan luetteloon - siitähän sen englanninkielinen nimi tulee. Luettelossa olevia kohteita kutsutaan `TChartDataItem` :ksi. Se sisältää datapisteen tietoja: | |
| 49 | 49 | ||
| 50 | 50 | - `x` ja `y` koordinaatit, | |
| 51 | 51 | - `Text` jota käytetään datan merkintään | |
| 52 | 52 | - `Color` eli väri-tieto joka ylikirjoittaa kuvaajan oletusvärin (SeriesColor) | |
| 53 | 53 | - `YList` joka sisältää lisää y:n arvoja joita tarvitaan joissakin erikoistapauksissa. | |
| 54 | 54 | ||
| 55 | 55 | ListChartSource on samantyyppinen kaavion lähde, joka on käytössä monien kuvaajien luokkien sisällä. Kun se on erillinen komponentti on siitä kuitenkin etua, että samaa kaavion lähdettä voidaan käyttää uudelleen muissa kuvaajissa - tarvitsemme tätä ominaisuutta myöhemmin sovellettaessa FitSeries. | |
| 56 | 56 | ||
| 57 | 57 |  Lisäämällä TListChartSource lomakkeelle. Tämä löytyy toisena kuvakeena chart-komponenttipaletilta. Kytke kuvaaja osoittamaan tähän lähteeseen asettamalla ominaisuus `Source` uuteen arvoon `ListChartSource1`. | |
| 58 | 58 | ||
| 59 | 59 | ### ListChartSource datapisteiden muokkain | |
| 60 | 60 | ||
| 61 | 61 | 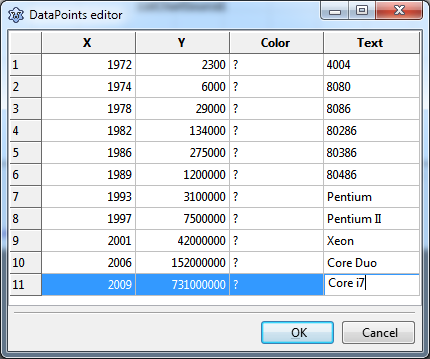 | |
| 62 | 62 | ||
| 63 | 63 | Klikkaamalla kolmeapistepainiketta ominaisuudessa `DataPoints` avautuu datapisteiden muokkain. Tämä on ruudukko, johon syötetään tiedot. Kirjoita tiedot yllä olevasta kuvasta. Ne ovat otettu verkkosivuilta joka mainitaan johdannossa. Tämä sivusto näyttää markkinoille tulon ajan vuosittain ja kuukausittain - yksinkertaisuuden vuoksi ohitetaan kuukausi ja pyöristetään se lähimpään kalenterivuoteen. Anna vuosi sarakkeeseen **X**. Sarake **Y** saa transistorien määrä per piiri. Jokaisen mikroprosessorin nimi siirtyy sarakkeeseen **Teksti**. Koska ei anneta yksittäisen datapisteen väriä ohitetaan sarake **Väri** - mutta tietenkin sitä ominaisuutta voi kokeilla muuttaa. | |
| 64 | 64 | ||
| 65 | 65 | Kun datapisteiden muokkain suljetaan niin sarja päivitetään automaattisesti ja näkyvissä on päivitetty tietojoukko. Vau! | |
| 66 | 66 | ||
| 67 | 67 | ### Näytetään datapisteen nimi | |
| 68 | 68 | ||
| 69 | 69 | Miksi emme näe prosessorien nimiä jotka asetettiin ruudukossa? [[TAChart documentation|Datapisteen nimi]] on oletuksena pois päältä. Valitse kuvaaja ja siirry kohtaan `Marks` . Katso aliominaisuutta `Style` , se on `smsNone` joka tarkoittaa "off" eli poispäältä. Avaa kyseisen kohdan pudotusvalikko. Näet erilaisia vaihtoehtoja kuinka datapisteiden nimi voidaan merkitä. Testaa eri asetuksia. Jo suunnitteluaikana nähdään mitä ne tarkoittavat. Ota lopuksi käyttöön `smsLabel` joka näyttää tekstin. | |
| 70 | 70 | ||
| 71 | 71 | On myös yhdistävä viiva nimen ja datapisteen välillä. Sen väri on oletuksena valkoinen, siksi sitä ei nähdä valkoisella taustalla. Tämän viivan ominaisuuksia muutetaan `LinkPen` kohdan alla. Aseta `LinkPen.Color` arvoon `clGray` . | |
| 72 | 72 | ||
| 73 | 73 | Näiden nimien paikkaa pystyy jossain määrin muuttamaan [[TAChart documentation|MarkPositions]] ominaisuudessa. | |
| 74 | 74 | ||
| 75 | 75 | 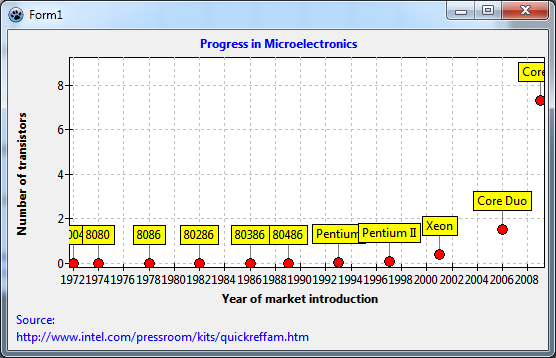 | |
| 76 | 76 | ||
| 77 | 77 | Jos ohjelma käännetään nyt niin mitään uutta ei tule verrattuna suunnitteluaikaiseen näkymään. Tämä on suuri etu kun työskentelee ListChartSource:n datapisteiden muokkaimella. | |
| 78 | 78 | ||
| 79 | 79 | On kaksi asiaa, joita voidaan parantaa tässä vaiheessa: | |
| 80 | 80 | ||
| 81 | 81 | - Kaavion reunoilla datapisteiden nimet leikkautuvat pois. Sitä ei voi korjata lisäämällä kaavion `Margin.Left` ja `Margin.Right` arvoksi 24. Koska [[TAChart documentation|Margin]] määrittää ympäröivän tilan sisemmällä alueella pitää sen vapaana datapisteistä. On myös ominaisuus [[TAChart documentation|MarginExternal]] joka ympäröi kaavion ulompaa aluetta ja sillä voidaan muuttaa etäisyyttä naapurikontrolleihin. | |
| 82 | 82 | - Koska lähes kaikki datapisteet ovat kaavion alareunassa niin se ei ole kovin mielekästä. Tämän vuoksi tarvitsemme logaritmistä akselia. | |
| 83 | 83 | ||
| 84 | 84 | ## Otetaan logaritminen akseli käyttöön | |
| 85 | 85 | ||
| 86 | 86 | Datan näyttäminen logaritmisella akselilla tarkoittaa, että logaritmit data-arvot on piirretty, ei arvoja suoraan. Kaaviossa Y: n arvot vaihtelevat välillä 2300 ja 731 miljoonaa. Kun lasketaan ([decadic](https://en.wikipedia.org/wiki/Common_logarithm)/log<sub>10</sub>) logaritmit, alue on vain noin 3,3 ja 7,1 - tällaisessa kaaviossa tämä data voidaan erottaa paljon helpommin toisistaan. | |
| 87 | 87 | ||
| 88 | 88 | ### TChartTransformations and LogarithmicAxisTransform | |
| 89 | 89 | ||
| 90 | 90 |  Calculating the logarithm can be done by TAChart automatically. The main advantage is that the original data units are drawn on the axis while the logarithms are used for plotting. | |
| 91 | 91 | ||
| 92 | 92 | In fact, there is an entire group of components for axis transformations: [[TAChart documentation|TChartAxisTransformations]]. An axis transformation is a function which maps "real world" data in units as displayed on the axis (*"axis coordinates"*) to internal units that are common to all series in the same chart (*"graph coordinates"*). The axis coordinate of the transistor count of the 4004 processor, for example, is 2300, the graph coordinate is the logarithm of that number, i.e. log<sub>10</sub>(2300) = 3.36. | |
| 93 | 93 | ||
| 94 | 94 | TAChart provides a variety of transforms. In addition to the logarithm transform, there is a [[TAChart documentation|linear transform]] which allows to multiply the data by a factor and to add an offset. The [[TAChart documentation|auto-scaling transform]] is useful when several independently scaled series have to be drawn on the same axis. The [[TAChart documentation|user-defined transform]] allows to apply any arbitrary transformation. | |
| 95 | 95 | ||
| 96 | 96 | 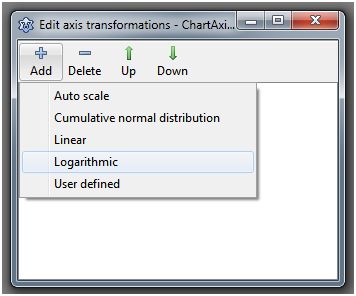 | |
| 97 | 97 | ||
| 98 | 98 | Add a `TAChartTransformations` component to the form, double-click on it (or right-click on it in the object tree and select "Edit axis transformations"), click on "Add" and select "Logarithmic". This will create a `ChartAxisTransformations1LogarithmAxisTransform1` component - what a name! Anyway, there's a high chance that you will not have to type it... | |
| 99 | 99 | ||
| 100 | 100 | In the object inspector, you will see only a few properties - the most important one is `Base`. This is the base of the logarithm to be calculated. Change it to 10, since we want to calculate the [decadic logarithms](https://en.wikipedia.org/wiki/Common_logarithm) - this case comprises 99% of all logarithmic charts. | |
| 101 | 101 | ||
| 102 | 102 | A side-note: it is very important that you **save the project at this time**. Why? You will see in a minute... | |
| 103 | 103 | ||
| 104 | 104 | Now we must identify the axis which is to be transformed. For this purpose each axis has a property `Transformations`. In our case, the huge numbers are plotted on the y axis. So, go to the left axis and set its property `Transformations` to `ChartAxisTransformations1`. | |
| 105 | 105 | ||
| 106 | 106 | 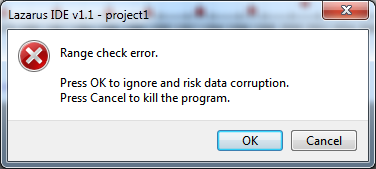 | |
| 107 | 107 | ||
| 108 | 108 | Oh - what's that? An error message pops up reporting a range check error. Hopefully you had saved the project. If you click on Cancel Lazarus will shut down, everything will be lost. If you click on OK suddenly the chart is gone, it reappears when you click somewhere, but the faulty axis is hidden ... | |
| 109 | 109 | ||
| 110 | 110 | Are you getting desperate? | |
| 111 | 111 | ||
| 112 | 112 | This is the main disadvantage of working at design-time. If something goes wrong, there is no debugger, no indication of what caused the trouble. Since components are compiled into Lazarus you would have to debug the IDE. Sounds complicated... | |
| 113 | 113 | ||
| 114 | 114 | Let's sit down and think what we did. We assigned the logarithmic transform to the y axis. The transform does not yet have any connection to the data, therefore the data are still in "real" units, their maximum is 731 million. But the transform "thinks" that the data are already in graph units (logarithms). When it calculates the axis labels in axis units it takes hundreds of millions to the power of 10! That's what causes the range check error. However, the situation is not always so dramatic; the least thing that could happen is that the data are not transformed, but the axis is. | |
| 115 | 115 | ||
| 116 | 116 | What can we do against that? Each series has properties `AxisIndexX` and `AxisIndexY`. The transform can use this information to calculate the logarithms of the correct coordinates before the axis labels are updated. This solves our problem. | |
| 117 | 117 | ||
| 118 | 118 | So, click on Cancel to shutdown Lazarus. Restart and reload the project. In the saved state, the transformation is not yet connected to the axis. | |
| 119 | 119 | ||
| 120 | 120 | Now have a look at the object tree above the object inspector and you will see that the left axis has index 0. So set the series' `AxisIndexY` to this value. Although not necessary it may be a good idea to disarm also the x axis by assigning its index 1 to the `AxisIndexX` of the series - who can guarantee that we won't transform the x axis in the future? | |
| 121 | 121 | ||
| 122 | 122 | After this is done you can set the `LeftAxis.Transformation` to `ChartTransformations1` without the range check error. | |
| 123 | 123 | ||
| 124 | 124 | With the logarithm transform activated the data points spread nicely across the y axis range now. But what's wrong with the y axis labels? And the years on the x axis are too close and partly overlap. | |
| 125 | 125 | ||
| 126 | 126 | 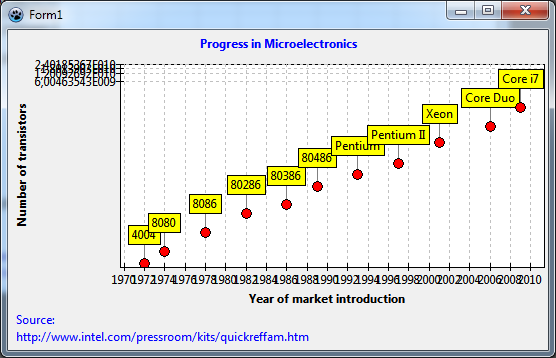 | |
| 127 | 127 | ||
| 128 | 128 | Finding axis labels is a non-trivial task, in particular when transformations are active that heavily distort the axis intervals. Unfortunately, logarithmic axes belong to that group. Basically, there are two ways to control label positioning, an **automatic** and a **manual** way. | |
| 129 | 129 | ||
| 130 | 130 | ### Automatic finding of axis labels | |
| 131 | 131 | ||
| 132 | 132 | For automatic label positioning, each axis has a property [[TAChart documentation|Intervals]] which gives access to several, partly mutually excluding parameters - please see [[TAChart documentation]] for an explanation. In case of the logarithmic axis the issue is usually caused by the fact that the option `aipGraphCoordinates` is not set. This option, if set, enforces calculation of the tick intervals for the transformed data ("graph coordinates"), not the "real world" data ("axis coordinates"). So, set `aipGraphCoordinates` in the `LeftAxis.Intervals.Options`. The labels jump to more evenly distributed locations. | |
| 133 | 133 | ||
| 134 | 134 | 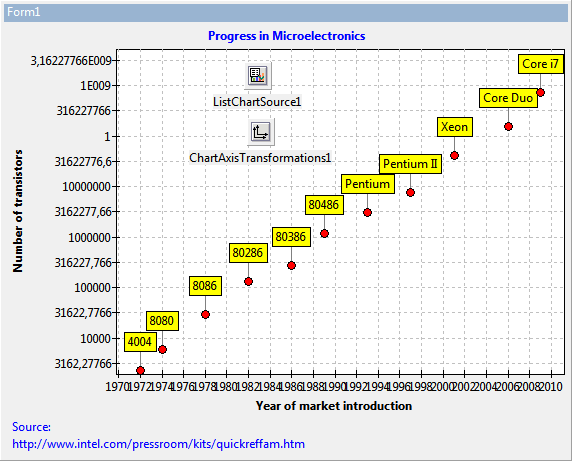 | |
| 135 | 135 | ||
| 136 | 136 | Depending on the size of your form you may get quite nice, or not so good labels. If you resize the form you will see some "crooked" labels jump in. | |
| 137 | 137 | ||
| 138 | 138 | You can improve the quality of label presentation in the following way: | |
| 139 | 139 | ||
| 140 | 140 | - Moderately increase the `Intervals.Tolerance` to something like 5. | |
| 141 | 141 | - Adjust the range in which the label distance can vary. This is defined by the properties `Intervals.MaxLength` and `Intervals.MinLength`. The optimum value depends on the size of the chart and on the range of the data. In our example project, good labels are obtained by setting these properties to 100 and 50, respectively. | |
| 142 | 142 | ||
| 143 | 143 | In the same way, the overlapping year labels of the x axis can be addressed. Just increase the `BottomAxis.Intervals.MaxLength` to 70. | |
| 144 | 144 | ||
| 145 | 145 | What is left now is the "1" that appears at the y axis between "10000000" and "1E009". This is due to a bug in some FPC versions. If you have that as well, simply change the property `LeftAxis.Marks.Format`. This string is passed to the `Format` function to convert the numbers to strings. The format specifier "%0.0n" for example avoids that conversion error and, additionally, adds nice thousand separators to the labels which makes them much more readable. | |
| 146 | 146 | ||
| 147 | 147 | 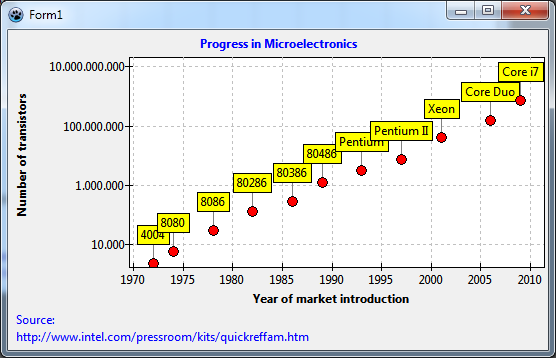 | |
| 148 | 148 | ||
| 149 | 149 | ### Manual finding of axis labels | |
| 150 | 150 | ||
| 151 | 151 | This is the best we can do with automatic label positioning. It is not perfect because when we increase the height of the window, or zoom in, the half-decade values may appear, or the label interval may be two decades as in above figure. | |
| 152 | 152 | ||
| 153 | 153 | If you are not happy with that you have to use **manual axis label selection**. For this purpose, each axis has a property `Source` which can be linked to a ListChartSource containing only the allowed axes labels. So when this chart source contains only full-decade labels there is no risk of half-decade labels or omitting every other label. On the other hand, when you zoom into the chart you may come to a point where no labels are visible any more. | |
| 154 | 154 | ||
| 155 | 155 | Add a second ListChartSource to the form. You can use the DataPoints editor again to enter the full-decade numbers. This has the advantage that you can complete most of this project without writing a single line of code! | |
| 156 | 156 | ||
| 157 | 157 | But you could also populate the listsource easily in the `FormCreate` event: | |
| 158 | 158 | ||
| 159 | 159 | ``` pascal | |
| 160 | 160 | procedure TForm1.FormCreate(Sender: TObject); | |
| 161 | 161 | const | |
| 162 | 162 | MIN = 0; | |
| 163 | 163 | MAX = 12; | |
| 164 | 164 | var | |
| 165 | 165 | i: Integer; | |
| 166 | 166 | value: double; | |
| 167 | 167 | begin | |
| 168 | 168 | for i:=MIN to MAX do begin | |
| 169 | 169 | value := Power(10, i); | |
| 170 | 170 | ListChartSource2.Add(value, value); | |
| 171 | 171 | end; | |
| 172 | 172 | end; | |
| 173 | 173 | ``` | |
| 174 | 174 | ||
| 175 | 175 | This procedure adds powers of 10 in a wide enough range to the ListChartSource by means of its method `Add`. | |
| 176 | 176 | ||
| 177 | 177 | Connect `ListChartSource1` to `LeftAxis.Marks.Source` to activate the manual labels of the ListChartSource. You should also remove all flags from the `Options` property. Otherwise automatic tick finding will still be active to some degree. If you did not use the DataPoints editor you must compile to see the effect. | |
| 178 | 178 | ||
| 179 | 179 | 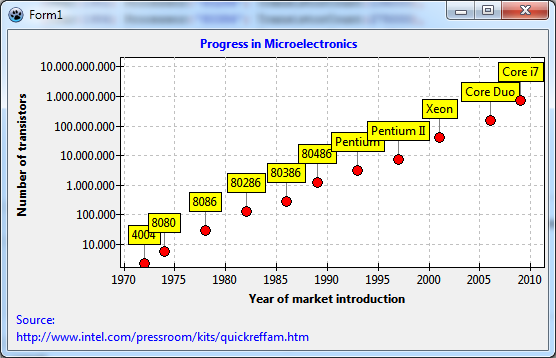 | |
| 180 | 180 | ||
| 181 | 181 | ### Minor tick marks | |
| 182 | 182 | ||
| 183 | 183 | Very often minor tick marks are placed between the major tick marks. TAChart allows to add several sets of minor ticks to each axis. We only need one here. Go to `LeftAxis` and click on the ellipsis button next to the property `Minors`. This opens the editor for `Chart1.AxisList[0].Minors`. Click on "Add" and on the "M" in the list below. Now you can adjust the parameters in the object inspector to get "good" minor ticks. If the major ticks on a logarithmic axis are at full decades then the minor ticks usually are at 2, 3, 4,..., 8, 9, and, of course, powers of 10. This can be achieved easily by turning off all `Intervals.Options` except for `aipUseCount` and setting `Intervals.Count = 9`. Of course, this makes sense only when the major labels are fixed at full decades like in the manual approach above. | |
| 184 | 184 | ||
| 185 | 185 | Usually the plot gets too crowded by the minor grid which appears now, you should set the minor's `Grid.Visible` to `false`. | |
| 186 | 186 | ||
| 187 | 187 | 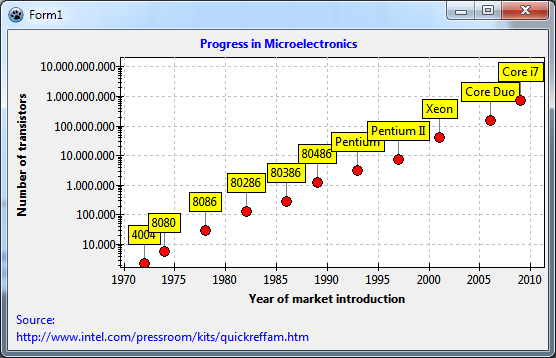 | |
| 188 | 188 | ||
| 189 | 189 | ## Fitting | |
| 190 | 190 | ||
| 191 | 191 | Now let's look for a relation between the data, i.e. we want to find a mathematical formula which describes the dependence of transistor count on market introduction year. This is called "fitting": we select a formula with parameters and adjust the parameters such that the deviation to the data is as small as possible. | |
| 192 | 192 | ||
| 193 | 193 | TAChart does not contain a full-fledged fitting engine. It uses the fitting routines from the FPC numerical library [[numlib]]. Therefore, TAChart cannot address all variants of fitting, but it covers the most important case, fitting of a [polynomial](https://en.wikipedia.org/wiki/Polynomial) by means of the [linear least squares technique](https://en.wikipedia.org/wiki/Least_squares). This is about the level available to Excel users when they add a "trend line" to their chart. | |
| 194 | 194 | ||
| 195 | 195 | ### TFitSeries | |
| 196 | 196 | ||
| 197 | 197 | TAChart provides a specialized [[TAChart documentation|TFitSeries]] for fitting. This series has a property `FitEquation` which defines the formula that is used: | |
| 198 | 198 | ||
| 199 | 199 | - `fePolynomial`: y = b<sub>0</sub> + b<sub>1</sub>x + b<sub>2</sub>x<sup>2</sup> + … + b<sub>n</sub>x<sup>n</sup>. Specify the number of fitting parameters a<sub>i</sub> by the property `ParamCount` = n + 1. | |
| 200 | 200 | - `feLinear`: y = a + bx -- this is a special case of the general polynomial with n = 1 and fitting parameters a and b. It is made available as a separate item because straight lines define the most important fitting conditions. | |
| 201 | 201 | - `feExp`: y = a * e<sup>bx</sup> -- This equation can also be reduced to the polynomial case although this is not straightforward to see. But take the (natural) logarithm of this equation, and you get to ln(y) = a + bx. Now when we fit ln(y) instead of y we have the linear case again. | |
| 202 | 202 | - `fePower`: y = a * x<sup>b</sup>. Again, this can be reduced to a linear equation by a logarithmic transformation. | |
| 203 | 203 | ||
| 204 | 204 | 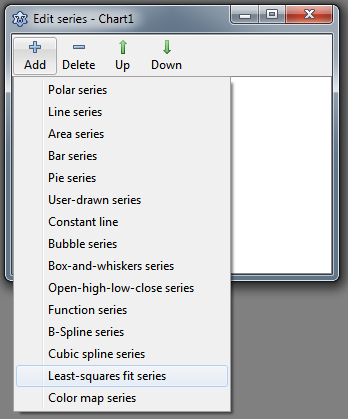 | |
| 205 | 205 | ||
| 206 | 206 | Enough of theory. Let's add a FitSeries to the chart: double-click on the chart, and in the series editor click on "Add" and select the entry "Least squares fit series" from the dropdown list. | |
| 207 | 207 | ||
| 208 | 208 | At first, we need to tell the fit series where it finds its data. For this purpose, we connect the series' `Source` with `ListChartSource1` as we had done with the line series. You see: the same chart source can be used for several series. | |
| 209 | 209 | ||
| 210 | 210 | You hopefully remember the disaster above with the AxisIndex. So, set the `AxisIndexY` to the index of the left axis as we did with the line series. | |
| 211 | 211 | ||
| 212 | 212 | Which one of the four `FitEquation` possibilities do we select? Well, the data look like lying on a straight line. So let's select `feLinear`. | |
| 213 | 213 | ||
| 214 | 214 | 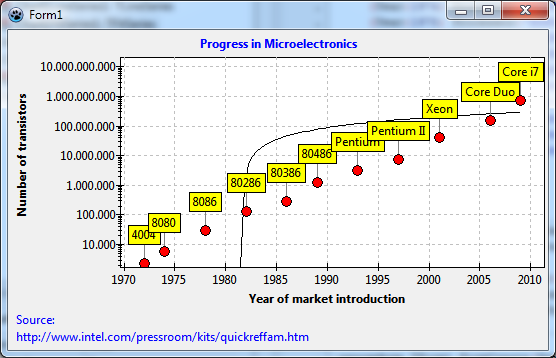 | |
| 215 | 215 | ||
| 216 | 216 | Oops... We see the black fitted curve, but it does not "fit" at all. And we wanted a straight line, but we get a twisted curve. How can this be? | |
| 217 | 217 | ||
| 218 | 218 | The reason is the logarithmic transform that we applied to the y data. Therefore, our plot shows the logarithms, but the fit takes the "raw" data. We are effectively fitting the straight line to the data in the screenshot in the section Displaying datapoint marks where the log transform had not yet been introduced - it is clear that the line would not "fit" there. And when the fitted function is drawn the log transform distorts the straight line to the twisted curve that we see. | |
| 219 | 219 | ||
| 220 | 220 | On the other hand, if the **log data** follow a straight line our fitting law is not linear, but exponential. Let's set `FitEquation` to `feExp` and try again. | |
| 221 | 221 | ||
| 222 | 222 | 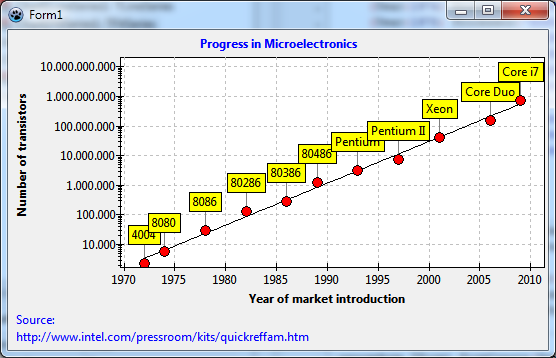 | |
| 223 | 223 | ||
| 224 | 224 | Ah - much better! | |
| 225 | 225 | ||
| 226 | 226 | Now we know that the exponential law, y = a * x<sup>b</sup>, is a good description of our data. But how do we get the fitting parameters a and b? | |
| 227 | 227 | ||
| 228 | 228 | ### Fit results | |
| 229 | 229 | ||
| 230 | 230 | The fit series has a public array property `Param` which contains the fitting parameters. `a` is in `Params[0]`, and `b` is in `Params[1]`. Of course, these values are correct only when a valid fit has been performed. How do we know that? Well, the fit series provides an event `OnFitComplete` that is generated when the fit complete successfully. That's where we can evaluate the obtained fit parameters. As an example, let's display the fit results in a message along with the fit equation: | |
| 231 | 231 | ||
| 232 | 232 | ``` pascal | |
| 233 | 233 | procedure TForm1.Chart1FitSeries1FitComplete(Sender: TObject); | |
| 234 | 234 | begin | |
| 235 | 235 | with Chart1FitSeries1 do | |
| 236 | 236 | ShowMessage(Format( | |
| 237 | 237 | 'Fit result: a = %g, b = %g', [ | |
| 238 | 238 | Param[0], Param[1] | |
| 239 | 239 | ])); | |
| 240 | 240 | end; | |
| 241 | 241 | ``` | |
| 242 | 242 | ||
| 243 | 243 | And that's what we get: | |
| 244 | 244 | ||
| 245 | 245 | 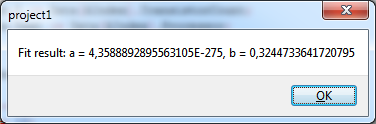 | |
| 246 | 246 | ||
| 247 | 247 | Now we want to calculate the time T until the number of transistors on a chip is doubled. As an exercise try to show that | |
| 248 | 248 | ||
| 249 | - | ||
| 249 | + | ```text | |
| 250 | + | T = ln(2) / b | |
| 251 | + | ``` | |
| 250 | 252 | ||
| 251 | 253 | It would be nice to show the doubling time as an additional line of the chart title. For this, we modify the `OnFitComplete` event handler as follows: | |
| 252 | 254 | ||
| 253 | 255 | ``` pascal | |
| 254 | 256 | procedure TForm1.Chart1FitSeries1FitComplete(Sender: TObject); | |
| 255 | 257 | begin | |
| 256 | 258 | Chart1.Title.Text.Add(Format( | |
| 257 | 259 | 'The number of transistors doubles every %.0f years', | |
| 258 | 260 | [ln(2) / Chart1FitSeries1.Param[1]] | |
| 259 | 261 | )); | |
| 260 | 262 | end; | |
| 261 | 263 | ``` | |
| 262 | 264 | ||
| 263 | 265 |  | |
| 264 | 266 | ||
| 265 | 267 | Vau! Tämä on Mooren laki: "Transistoreiden määrä per siru kaksinkertaistuu kahden vuoden välein" ... | |
| 266 | 268 | ||
| 267 | 269 | ## Lähdekoodi | |
| 268 | 270 | ||
| 269 | 271 | ### Project file | |
| 270 | 272 | ||
| 271 | 273 | ``` pascal | |
| 272 | 274 | program project1; | |
| 273 | 275 | ||
| 274 | 276 | {$mode objfpc}{$H+} | |
| 275 | 277 | ||
| 276 | 278 | uses | |
| 277 | 279 | {$IFDEF UNIX}{$IFDEF UseCThreads} | |
| 278 | 280 | cthreads, | |
| 279 | 281 | {$ENDIF}{$ENDIF} | |
| 280 | 282 | Interfaces, // this includes the LCL widgetset | |
| 281 | 283 | Forms, Unit1, tachartlazaruspkg | |
| 282 | 284 | { you can add units after this }; | |
| 283 | 285 | ||
| 284 | 286 | {$R *.res} | |
| 285 | 287 | ||
| 286 | 288 | begin | |
| 287 | 289 | //RequireDerivedFormResource := True; | |
| 288 | 290 | Application.Initialize; | |
| 289 | 291 | Application.CreateForm(TForm1, Form1); | |
| 290 | 292 | Application.Run; | |
| 291 | 293 | end. | |
| 292 | 294 | ``` | |
| 293 | 295 | ||
| 294 | 296 | ### Unit1.pas | |
| 295 | 297 | ||
| 296 | 298 | ``` pascal | |
| 297 | 299 | unit Unit1; | |
| 298 | 300 | ||
| 299 | 301 | {$mode objfpc}{$H+} | |
| 300 | 302 | ||
| 301 | 303 | interface | |
| 302 | 304 | ||
| 303 | 305 | uses | |
| 304 | 306 | Classes, SysUtils, FileUtil, TAGraph, TASeries, TASources, Forms, Controls, | |
| 305 | 307 | Graphics, Dialogs, TACustomSource, TATransformations, TAFuncSeries; | |
| 306 | 308 | ||
| 307 | 309 | type | |
| 308 | 310 | ||
| 309 | 311 | { TForm1 } | |
| 310 | 312 | ||
| 311 | 313 | TForm1 = class(TForm) | |
| 312 | 314 | Chart1: TChart; | |
| 313 | 315 | Chart1FitSeries1: TFitSeries; | |
| 314 | 316 | Chart1LineSeries1: TLineSeries; | |
| 315 | 317 | ChartAxisTransformations1: TChartAxisTransformations; | |
| 316 | 318 | ChartAxisTransformations1LogarithmAxisTransform1: TLogarithmAxisTransform; | |
| 317 | 319 | ListChartSource1: TListChartSource; | |
| 318 | 320 | ListChartSource2: TListChartSource; | |
| 319 | 321 | procedure Chart1FitSeries1FitComplete(Sender: TObject); | |
| 320 | 322 | procedure FormCreate(Sender: TObject); | |
| 321 | 323 | private | |
| 322 | 324 | { private declarations } | |
| 323 | 325 | public | |
| 324 | 326 | { public declarations } | |
| 325 | 327 | end; | |
| 326 | 328 | ||
| 327 | 329 | var | |
| 328 | 330 | Form1: TForm1; | |
| 329 | 331 | ||
| 330 | 332 | implementation | |
| 331 | 333 | ||
| 332 | 334 | {$R *.lfm} | |
| 333 | 335 | ||
| 334 | 336 | uses | |
| 335 | 337 | math; | |
| 336 | 338 | ||
| 337 | 339 | { TForm1 } | |
| 338 | 340 | ||
| 339 | 341 | procedure TForm1.FormCreate(Sender: TObject); | |
| 340 | 342 | const | |
| 341 | 343 | MIN = 0; | |
| 342 | 344 | MAX = 12; | |
| 343 | 345 | var | |
| 344 | 346 | i: Integer; | |
| 345 | 347 | value: double; | |
| 346 | 348 | begin | |
| 347 | 349 | for i:=MIN to MAX do begin | |
| 348 | 350 | value := IntPower(10, i); | |
| 349 | 351 | ListChartSource2.Add(value, value); | |
| 350 | 352 | end; | |
| 351 | 353 | Chart1FitSeries1.ExecFit; | |
| 352 | 354 | end; | |
| 353 | 355 | ||
| 354 | 356 | procedure TForm1.Chart1FitSeries1FitComplete(Sender: TObject); | |
| 355 | 357 | begin | |
| 356 | 358 | { | |
| 357 | 359 | with Chart1FitSeries1 do | |
| 358 | 360 | ShowMessage(Format( | |
| 359 | 361 | 'Fit result: a = %g, b = %g', [ | |
| 360 | 362 | Param[0], Param[1] | |
| 361 | 363 | ])); | |
| 362 | 364 | } | |
| 363 | 365 | Chart1.Title.Text.Add(Format( | |
| 364 | 366 | 'The number of transistors doubles every %.0f years', | |
| 365 | 367 | [ln(2) / Chart1FitSeries1.Param[1]] | |
| 366 | 368 | )); | |
| 367 | 369 | end; | |
| 368 | 370 | ||
| 369 | 371 | end. | |
| 370 | 372 | ``` | |
| 371 | 373 | ||
| 372 | 374 | ### Unit1.lfm | |
| 373 | 375 | ||
| 374 | - | ||
| 376 | + | ``` lfm | |
| 375 | 377 | object Form1: TForm1 | |
| 376 | 378 | Left = 244 | |
| 377 | 379 | Height = 356 | |
| 378 | 380 | Top = 193 | |
| 379 | 381 | Width = 552 | |
| 380 | 382 | Caption = 'Form1' | |
| 381 | 383 | ClientHeight = 356 | |
| 382 | 384 | ClientWidth = 552 | |
| 383 | 385 | OnCreate = FormCreate | |
| 384 | 386 | LCLVersion = '1.1' | |
| 385 | 387 | object Chart1: TChart | |
| 386 | 388 | Left = 0 | |
| 387 | 389 | Height = 356 | |
| 388 | 390 | Top = 0 | |
| 389 | 391 | Width = 552 | |
| 390 | 392 | AxisList = < | |
| 391 | 393 | item | |
| 392 | 394 | Grid.Color = clSilver | |
| 393 | 395 | Marks.Format = '%0:.0n' | |
| 394 | 396 | Marks.Source = ListChartSource2 | |
| 395 | 397 | Marks.Style = smsCustom | |
| 396 | 398 | Minors = < | |
| 397 | 399 | item | |
| 398 | 400 | Grid.Visible = False | |
| 399 | 401 | Intervals.Count = 9 | |
| 400 | 402 | Intervals.MinLength = 5 | |
| 401 | 403 | Intervals.Options = [aipUseCount] | |
| 402 | 404 | end> | |
| 403 | 405 | Title.LabelFont.Orientation = 900 | |
| 404 | 406 | Title.LabelFont.Style = [fsBold] | |
| 405 | 407 | Title.Visible = True | |
| 406 | 408 | Title.Caption = 'Number of transistors' | |
| 407 | 409 | Transformations = ChartAxisTransformations1 | |
| 408 | 410 | end | |
| 409 | 411 | item | |
| 410 | 412 | Grid.Color = clSilver | |
| 411 | 413 | Intervals.MaxLength = 60 | |
| 412 | 414 | Alignment = calBottom | |
| 413 | 415 | Minors = <> | |
| 414 | 416 | Title.LabelFont.Style = [fsBold] | |
| 415 | 417 | Title.Visible = True | |
| 416 | 418 | Title.Caption = 'Year of market introduction' | |
| 417 | 419 | end> | |
| 418 | 420 | BackColor = clWhite | |
| 419 | 421 | Foot.Alignment = taLeftJustify | |
| 420 | 422 | Foot.Brush.Color = clBtnFace | |
| 421 | 423 | Foot.Font.Color = clBlue | |
| 422 | 424 | Foot.Text.Strings = ( | |
| 423 | 425 | 'Source:' | |
| 424 | 426 | 'http://www.intel.com/pressroom/kits/quickreffam.htm' | |
| 425 | 427 | ) | |
| 426 | 428 | Foot.Visible = True | |
| 427 | 429 | Margins.Left = 24 | |
| 428 | 430 | Margins.Right = 24 | |
| 429 | 431 | Title.Brush.Color = clBtnFace | |
| 430 | 432 | Title.Font.Color = clBlue | |
| 431 | 433 | Title.Font.Style = [fsBold] | |
| 432 | 434 | Title.Text.Strings = ( | |
| 433 | 435 | 'Progress in Microelectronics' | |
| 434 | 436 | ) | |
| 435 | 437 | Title.Visible = True | |
| 436 | 438 | Align = alClient | |
| 437 | 439 | ParentColor = False | |
| 438 | 440 | object Chart1LineSeries1: TLineSeries | |
| 439 | 441 | Marks.Format = '%2:s' | |
| 440 | 442 | Marks.LinkPen.Color = clGray | |
| 441 | 443 | Marks.Style = smsLabel | |
| 442 | 444 | AxisIndexY = 0 | |
| 443 | 445 | LineType = ltNone | |
| 444 | 446 | Pointer.Brush.Color = clRed | |
| 445 | 447 | Pointer.Style = psCircle | |
| 446 | 448 | ShowPoints = True | |
| 447 | 449 | Source = ListChartSource1 | |
| 448 | 450 | end | |
| 449 | 451 | object Chart1FitSeries1: TFitSeries | |
| 450 | 452 | AxisIndexX = 1 | |
| 451 | 453 | AxisIndexY = 0 | |
| 452 | 454 | FitEquation = feExp | |
| 453 | 455 | OnFitComplete = Chart1FitSeries1FitComplete | |
| 454 | 456 | ParamCount = 2 | |
| 455 | 457 | Source = ListChartSource1 | |
| 456 | 458 | end | |
| 457 | 459 | end | |
| 458 | 460 | object ListChartSource1: TListChartSource | |
| 459 | 461 | DataPoints.Strings = ( | |
| 460 | 462 | '1972|2300|?|4004' | |
| 461 | 463 | '1974|6000|?|8080' | |
| 462 | 464 | '1978|29000|?|8086' | |
| 463 | 465 | '1982|134000|?|80286' | |
| 464 | 466 | '1986|275000|?|80386' | |
| 465 | 467 | '1989|1200000|?|80486' | |
| 466 | 468 | '1993|3100000|?|Pentium' | |
| 467 | 469 | '1997|7500000|?|Pentium II' | |
| 468 | 470 | '2001|42000000|?|Xeon' | |
| 469 | 471 | '2006|152000000|?|Core Duo' | |
| 470 | 472 | '2009|731000000|?|Core i7' | |
| 471 | 473 | ) | |
| 472 | 474 | left = 240 | |
| 473 | 475 | top = 40 | |
| 474 | 476 | end | |
| 475 | 477 | object ChartAxisTransformations1: TChartAxisTransformations | |
| 476 | 478 | left = 243 | |
| 477 | 479 | top = 96 | |
| 478 | 480 | object ChartAxisTransformations1LogarithmAxisTransform1: TLogarithmAxisTransform | |
| 479 | 481 | Base = 10 | |
| 480 | 482 | end | |
| 481 | 483 | end | |
| 482 | 484 | object ListChartSource2: TListChartSource | |
| 483 | 485 | left = 243 | |
| 484 | 486 | top = 176 | |
| 485 | 487 | end | |
| 486 | 488 | end | |
| 487 | 489 | ``` | |
| 488 | 490 | ||
| 489 | 491 | --- | |
| 490 | 492 | *From the Free Pascal wiki, page "TAChart Tutorial: ListChartSource, Logarithmic Axis, Fitting/fi", as it stood on 2020-02-29 after a change by Trev, out of the wiki's dump of 2024-05-26. Copyright stays with the author who wrote it, according to the old wiki's [[Licensing]] page. If you have concerns about this material, [message the admin](/wiki-contact).* |