

TAChart Tutorial: Getting started: what changed
Revision 0 to 1. Removed lines have a minus sign; added lines have a plus sign.
Title: TAChart Tutorial: Getting started
| Old | New | Line | |
|---|---|---|---|
| 1 | + | ## Introduction | |
| 2 | + | ||
| 3 | + | 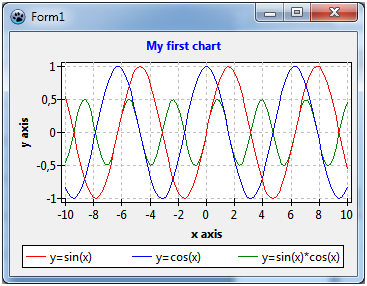 | |
| 4 | + | ||
| 5 | + | If you want to add a plot or a chart to your Lazarus form you should have a look at [[TAChart]]. This is the standard Lazarus package for drawing plots and charts. | |
| 6 | + | ||
| 7 | + | In this tutorial we will draw some elemental mathematical functions by TAChart. We will create a chart with three line series for the functions | |
| 8 | + | ||
| 9 | + | - y=cos(x), | |
| 10 | + | - y=sin(x), and | |
| 11 | + | - y=cos(x)*sin(x). | |
| 12 | + | ||
| 13 | + | Maybe it is necessary to expain the words "series" and "chart" here: the entire diagram is the "chart", and each of the functions will be displayed as a curve called "series". We will connect the data points by line sections, therefore, we will use the "line series". TAChart, of course, allows to use many other types of series, for example bar series, area series, pie series, or even advanced types like spline or fit series. | |
| 14 | + | ||
| 15 | + | ## What is needed? | |
| 16 | + | ||
| 17 | + | This guide will be very elemental. Of course, you'll need basic knowledge of the [[Object Pascal]] language and the Lazarus [[IDE]]. | |
| 18 | + | ||
| 19 | + | TAChart is included in Lazarus, so there is no need for seeking this package somewhere in the internet. However, don't use a too-old version of Lazarus since TAChart is being actively developed and some features may change from version to version. | |
| 20 | + | ||
| 21 | + | It is best if you follow this tutorial step by step. But if you want you can use the [[Source code|source code]] of the finished project at the end of this article. | |
| 22 | + | ||
| 23 | + | ## A new project | |
| 24 | + | ||
| 25 | + |  | |
| 26 | + | ||
| 27 | + | To begin with, we create a new project in Lazarus and, in the [[Component Palette|component palette]] we select the page [[Chart tab|"Chart"]]. Click on the left-most icon, the [[TChart]] component, and add it to the form. You will see an empty diagram with standardized x and y axes. | |
| 28 | + | ||
| 29 | + | 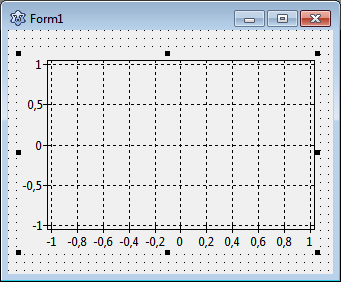 | |
| 30 | + | ||
| 31 | + | ## Adding series | |
| 32 | + | ||
| 33 | + | Now let's add series. For this purpose, double-click on the chart (or right-click, and select "Edit series" from the context menu). The TAChart series editor appears. It is still empty, but when you select "Add" you will see a menu with all the series types available within the TAChart package. Select the "line series". Repeat two times to create, in total, three line series that are assigned to the chart. They are not yet displayed in the chart, because they do not yet have any data. No data - no display. We will fix that in a minute. | |
| 34 | + | ||
| 35 | + | 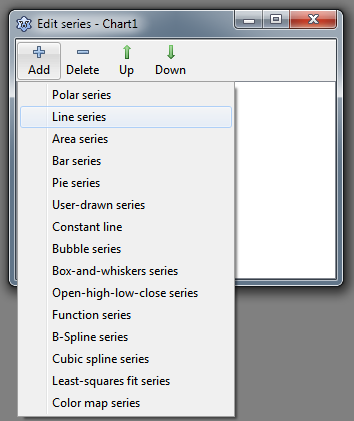 | |
| 36 | + | ||
| 37 | + | Before we do that let us have a look at the object inspector tree. TAChart uses a quite complex architecture of classes and containers, so it is important to understand the object tree. In the current state of our project we see the TChart component and its children, the three line series and the AxisList with Left and Bottom axes as children again. The series names are constructed according to `Chart<number><SeriesType><Number>`. | |
| 38 | + | ||
| 39 | + | 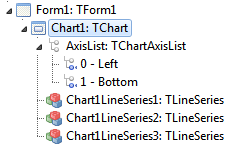 | |
| 40 | + | ||
| 41 | + | Why don't we give them more descriptive names, like `SinSeries`, `CosSeries`, and `SinCosSeries`? For this purpose, click on each series, and change the series `Name` in the corresponding field of the object inspector below. | |
| 42 | + | ||
| 43 | + | ## Adding data | |
| 44 | + | ||
| 45 | + | Now it's time to add data. The easiest option is to create the data along with the form, i.e. we write a handler for the forms's `OnCreate` event. Of course, in a "real" project, you will add data at other occasions, for example after a button click which might initiate a calculation or read data from a file. | |
| 46 | + | ||
| 47 | + | ``` pascal | |
| 48 | + | procedure TForm1.FormCreate(Sender: TObject); | |
| 49 | + | const | |
| 50 | + | N = 100; | |
| 51 | + | MIN = -10; | |
| 52 | + | MAX = 10; | |
| 53 | + | var | |
| 54 | + | i: Integer; | |
| 55 | + | x: Double; | |
| 56 | + | begin | |
| 57 | + | for i:=0 to N-1 do begin | |
| 58 | + | x := MIN + (MAX - MIN) * i /(N - 1); | |
| 59 | + | SinSeries.AddXY(x, sin(x)); | |
| 60 | + | CosSeries.AddXY(x, cos(x)); | |
| 61 | + | SinCosSeries.AddXY(x, sin(x)*cos(x)); | |
| 62 | + | end; | |
| 63 | + | end; | |
| 64 | + | ``` | |
| 65 | + | ||
| 66 | + | This [[Procedure|procedure]] creates 100 data points for each series. The x values are calculated to be equidistant between `MIN` and `MAX`, i.e. -10 and 10. The important lines are the calls to the `AddXY` [[Method|method]] of each series. This method takes the x and y coordinates of each data point and adds them to an internal list. There are also overloaded versions of this method where you can also pass a text label for each data point, as well as an individual color, but we don't need this feature here. | |
| 67 | + | ||
| 68 | + | The mentioned list is a so-called chart source - this is a [[Class|class]] which provides the data for plotting. You can use the built-in chart source, or you can link the series to a separate one. There is a variety of chart sources in the component palette, like | |
| 69 | + | ||
| 70 | + | - `TListChartSource` which stores the data in a list (this type is used by our series internally) | |
| 71 | + | - `TDBChartSource` which interfaces to the records and fields in a database | |
| 72 | + | - `TUserDefinedChartSource` which gives a very general access to data, for example, stored in an array of user-defined records | |
| 73 | + | - `TCalculatedChartSource` which allows to analyze one series and display the results in another one. | |
| 74 | + | ||
| 75 | + | But enough on chart sources - the built-in source is sufficient for this introductory project. | |
| 76 | + | ||
| 77 | + | 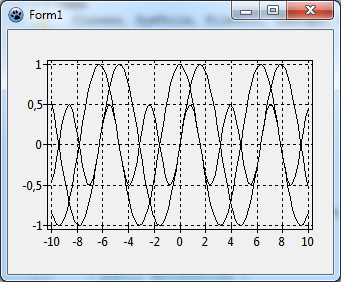 | |
| 78 | + | ||
| 79 | + | Ok, let's compile the program. We see the three curves, and the x axis automatically covers our data range between -10 and 10. Well - not too bad, but far from being perfect: The diagram is very confusing, we cannot distinguish between the individual lines, and we cannot tell which series belongs to which function. | |
| 80 | + | ||
| 81 | + | ## Formatting the series | |
| 82 | + | ||
| 83 | + | Why don't we change the color of each series? To do this select each series in the object tree and, in the object inspector below, change the [[Property|property]] `SeriesColor` as you want it to be - `SeriesColor` is the color of the lines connecting the data points. | |
| 84 | + | ||
| 85 | + | When you recompile you will see the series colored. But we still cannot distinguish between the different functions. What we need is a legend. | |
| 86 | + | ||
| 87 | + | ## Adding a legend | |
| 88 | + | ||
| 89 | + | Highlight the chart and, in the object inspector, scroll down to `Legend` and open the sub-properties. At the end, there is `Visible` which is `false` by default - so, set it to `true`, and recompile. | |
| 90 | + | ||
| 91 | + | 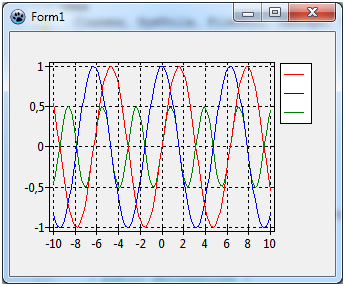 | |
| 92 | + | ||
| 93 | + | Well, it's getting better. What is missing, is an explanatory text for each series, like `y = sin(x)`. For this purpose each series has a property `Title` - this is the text which will appear in the legend for each entry along with the symbol for the corresponding series. Therefore you have to go through all series again and use the object inspector to set `Title` to `y=sin(x)`, `y=cos(x)`, and `y=sin(x)*cos(x)`, respectively. | |
| 94 | + | ||
| 95 | + | 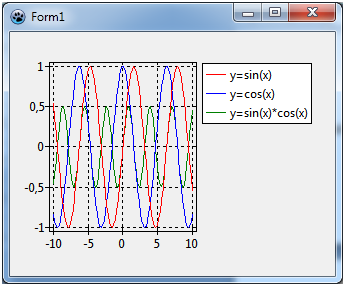 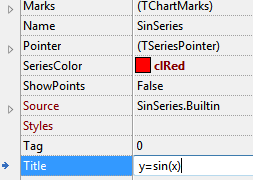 | |
| 96 | + | ||
| 97 | + | Now when you recompile, the chart is almost perfect. Almost - because the legend is quite large, and the diagram is squeezed into the remaining space. Of course, we could increase the size of the form. But can we also put the legend underneath the diagram? No problem: go back to the chart's property `Legend` and set `Alignment` to `laBottomCenter`. You should also set `ColumnCount` to `3`, otherwise the legend items will be in a column instead of in a row. | |
| 98 | + | ||
| 99 | + | 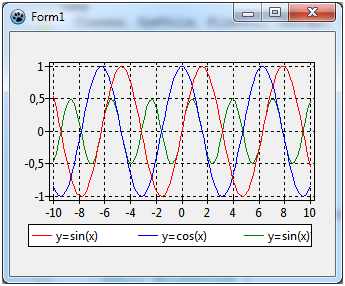 | |
| 100 | + | ||
| 101 | + | Ah! -- the third legend entry is truncated because the window is not wide enough. Align the chart to `alClient` and increase the width of the window a bit. | |
| 102 | + | ||
| 103 | + | ## Fine-tuning | |
| 104 | + | ||
| 105 | + | A few more things can still be improved: The axes should have a title, like "x axis" and "y axis", respectively, and there should also be a title above the chart. | |
| 106 | + | ||
| 107 | + | To set the title for the x axis select in the object tree the item `Bottom` of the AxisList child component of TChart, or go to `Bottom axis` in the object inspector. Open the sub-properties where you'll find `Title` which has sub-properties again. The text in the field `Caption` will be displayed as a title above the chart. Don't forget to set `Visible` to `true`. You may also want to set the font style of the title to bold - you find that property under `LabelFont`. Repeat the same with `Left axis`. | |
| 108 | + | ||
| 109 | + | Essentially the same procedure can be used to set the chart title: Scroll to the chart's property `Title`, enter the title in the field `Text` (you may even use a multi-line text here), and set `Visible` to `true` again. | |
| 110 | + | ||
| 111 | + | And finally, you might prefer to use a white background of the chart area, this is changed by the property `BackColor` of TChart. And maybe the grid should be less emphasized, i.e. it might look better with color `clSilver`. Use the left and bottom axes property `Grid.Color` to change that. | |
| 112 | + | ||
| 113 | + | ## Finished! | |
| 114 | + | ||
| 115 | + | In the end, our chart looks like this. Neat, isn't it? And it was not difficult at all... | |
| 116 | + | ||
| 117 | + | If you want to learn more about TAChart have a look at the official [[TAChart documentation]], and study some of the many demos that come with TAChart. They can be found in the folder `components\tachart\demo` of your Lazarus installation. | |
| 118 | + | ||
| 119 | + |  | |
| 120 | + | ||
| 121 | + | ## Source code | |
| 122 | + | ||
| 123 | + | The source code of this tutorial project can be found in the folder *tutorials/getting_started* of trunk TAChart installations. | |
| 124 | + | ||
| 125 | + | ### Project file | |
| 126 | + | ||
| 127 | + | ``` pascal | |
| 128 | + | program project1; | |
| 129 | + | ||
| 130 | + | {$mode objfpc}{$H+} | |
| 131 | + | ||
| 132 | + | uses | |
| 133 | + | {$IFDEF UNIX}{$IFDEF UseCThreads} | |
| 134 | + | cthreads, | |
| 135 | + | {$ENDIF}{$ENDIF} | |
| 136 | + | Interfaces, // this includes the LCL widgetset | |
| 137 | + | Forms, Unit1, tachartlazaruspkg | |
| 138 | + | { you can add units after this }; | |
| 139 | + | ||
| 140 | + | {$R *.res} | |
| 141 | + | ||
| 142 | + | begin | |
| 143 | + | RequireDerivedFormResource := True; | |
| 144 | + | Application.Initialize; | |
| 145 | + | Application.CreateForm(TForm1, Form1); | |
| 146 | + | Application.Run; | |
| 147 | + | end. | |
| 148 | + | ``` | |
| 149 | + | ||
| 150 | + | ### Unit1.pas | |
| 151 | + | ||
| 152 | + | ``` pascal | |
| 153 | + | unit Unit1; | |
| 154 | + | ||
| 155 | + | {$mode objfpc}{$H+} | |
| 156 | + | ||
| 157 | + | interface | |
| 158 | + | ||
| 159 | + | uses | |
| 160 | + | Classes, SysUtils, FileUtil, TAGraph, TASeries, Forms, Controls, Graphics, | |
| 161 | + | Dialogs; | |
| 162 | + | ||
| 163 | + | type | |
| 164 | + | ||
| 165 | + | { TForm1 } | |
| 166 | + | ||
| 167 | + | TForm1 = class(TForm) | |
| 168 | + | Chart1: TChart; | |
| 169 | + | SinSeries: TLineSeries; | |
| 170 | + | CosSeries: TLineSeries; | |
| 171 | + | SinCosSeries: TLineSeries; | |
| 172 | + | procedure FormCreate(Sender: TObject); | |
| 173 | + | private | |
| 174 | + | { private declarations } | |
| 175 | + | public | |
| 176 | + | { public declarations } | |
| 177 | + | end; | |
| 178 | + | ||
| 179 | + | var | |
| 180 | + | Form1: TForm1; | |
| 181 | + | ||
| 182 | + | implementation | |
| 183 | + | ||
| 184 | + | {$R *.lfm} | |
| 185 | + | ||
| 186 | + | { TForm1 } | |
| 187 | + | ||
| 188 | + | procedure TForm1.FormCreate(Sender: TObject); | |
| 189 | + | const | |
| 190 | + | N = 100; | |
| 191 | + | MIN = -10; | |
| 192 | + | MAX = 10; | |
| 193 | + | var | |
| 194 | + | i: Integer; | |
| 195 | + | x: Double; | |
| 196 | + | begin | |
| 197 | + | for i:=0 to N - 1 do begin | |
| 198 | + | x := MIN + (MAX - MIN) * i / (N - 1); | |
| 199 | + | SinSeries.AddXY(x, sin(x)); | |
| 200 | + | CosSeries.AddXY(x, cos(x)); | |
| 201 | + | SinCosSeries.AddXY(x, sin(x)*cos(x)); | |
| 202 | + | end; | |
| 203 | + | ||
| 204 | + | end; | |
| 205 | + | ||
| 206 | + | end. | |
| 207 | + | ``` | |
| 208 | + | ||
| 209 | + | ### Unit.lfm | |
| 210 | + | ||
| 211 | + | ``` pascal | |
| 212 | + | object Form1: TForm1 | |
| 213 | + | Left = 14 | |
| 214 | + | Height = 244 | |
| 215 | + | Top = 137 | |
| 216 | + | Width = 347 | |
| 217 | + | Caption = 'Form1' | |
| 218 | + | ClientHeight = 244 | |
| 219 | + | ClientWidth = 347 | |
| 220 | + | OnCreate = FormCreate | |
| 221 | + | LCLVersion = '1.1' | |
| 222 | + | object Chart1: TChart | |
| 223 | + | Left = 0 | |
| 224 | + | Height = 244 | |
| 225 | + | Top = 0 | |
| 226 | + | Width = 347 | |
| 227 | + | AxisList = < | |
| 228 | + | item | |
| 229 | + | Grid.Color = clSilver | |
| 230 | + | Minors = <> | |
| 231 | + | Title.LabelFont.Orientation = 900 | |
| 232 | + | Title.LabelFont.Style = [fsBold] | |
| 233 | + | Title.Visible = True | |
| 234 | + | Title.Caption = 'y axis' | |
| 235 | + | end | |
| 236 | + | item | |
| 237 | + | Grid.Color = clSilver | |
| 238 | + | Alignment = calBottom | |
| 239 | + | Minors = <> | |
| 240 | + | Title.LabelFont.Style = [fsBold] | |
| 241 | + | Title.Visible = True | |
| 242 | + | Title.Caption = 'x axis' | |
| 243 | + | end> | |
| 244 | + | BackColor = clWhite | |
| 245 | + | Foot.Brush.Color = clBtnFace | |
| 246 | + | Foot.Font.Color = clBlue | |
| 247 | + | Legend.Alignment = laBottomCenter | |
| 248 | + | Legend.ColumnCount = 3 | |
| 249 | + | Legend.Visible = True | |
| 250 | + | Title.Brush.Color = clBtnFace | |
| 251 | + | Title.Font.Color = clBlue | |
| 252 | + | Title.Font.Style = [fsBold] | |
| 253 | + | Title.Text.Strings = ( | |
| 254 | + | 'My first chart' | |
| 255 | + | ) | |
| 256 | + | Title.Visible = True | |
| 257 | + | Align = alClient | |
| 258 | + | ParentColor = False | |
| 259 | + | object SinSeries: TLineSeries | |
| 260 | + | Title = 'y=sin(x)' | |
| 261 | + | LinePen.Color = clRed | |
| 262 | + | end | |
| 263 | + | object CosSeries: TLineSeries | |
| 264 | + | Title = 'y=cos(x)' | |
| 265 | + | LinePen.Color = clBlue | |
| 266 | + | end | |
| 267 | + | object SinCosSeries: TLineSeries | |
| 268 | + | Title = 'y=sin(x)*cos(x)' | |
| 269 | + | LinePen.Color = clGreen | |
| 270 | + | end | |
| 271 | + | end | |
| 272 | + | end | |
| 273 | + | ``` | |
| 274 | + | ||
| 275 | + | --- | |
| 276 | + | *From the Free Pascal wiki, page "TAChart Tutorial: Getting started", as it stood on 2023-04-12 after a change by Trev, out of the wiki's dump of 2024-05-26. Copyright stays with the author who wrote it, according to the old wiki's [[Licensing]] page. If you have concerns about this material, [message the admin](/wiki-contact).* |