

TAChart Tutorial: Function Series: what changed
Revision 0 to 1. Removed lines have a minus sign; added lines have a plus sign.
Title: TAChart Tutorial: Function Series
| Old | New | Line | |
|---|---|---|---|
| 1 | + | ## Introduction | |
| 2 | + | ||
| 3 | + | 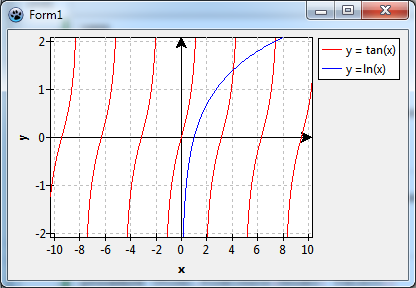 | |
| 4 | + | ||
| 5 | + | Did you work through the [[TAChart Tutorial: Getting started|Getting started tutorial]]? In that tutorial we had used some mathematical functions to demonstrate the basic usage of TAChart by means of line series. Line series, however, is not the best choice for drawing mathematical functions. [[TAChart documentation|TFuncSeries]] is much better suited to this purpose. This is a series type that -- at first sight -- looks like an ordinary line series. But in the background, it is completely different. It does not get its data from a ChartSource, but from a mathematical function. Whenever the series needs data it calls the handler for `OnCalculate` event where the user can pass the function values for an x value requested. This saves memory for storage of the function values. But most of all, it allows to calculate the function values, depending on zooming level and chart size, at sufficiently narrow intervals, such that the series curve is smooth even at high magnifications. | |
| 6 | + | ||
| 7 | + | ## Preparation | |
| 8 | + | ||
| 9 | + | Let us start a new project with a standard `TChart` component on the main form. Modify its properties as you like. We will use the following settings for the rest of this tutorial: | |
| 10 | + | ||
| 11 | + | - **Align**: `alClient` | |
| 12 | + | - **BackColor**: `clWhite` | |
| 13 | + | - **BottomAxis**: `Grid.Color = clSilver`, `Title.Caption = 'x'`, `Title.Visible = true`, `Title.LabelFont.Style = fsBold` | |
| 14 | + | - **LeftAxis**: `Grid.Color = clSilver`, `Title.Caption = 'y'`, `Title.Visible = true`, `Title.LabelFont.Style = fsBold` | |
| 15 | + | ||
| 16 | + | The resulting form is displayed in the following image on the left: | |
| 17 | + | ||
| 18 | + | 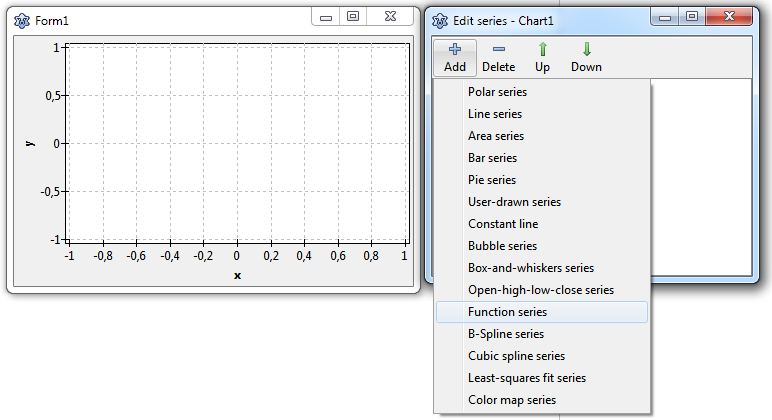 | |
| 19 | + | ||
| 20 | + | ## Adding a TFuncSeries | |
| 21 | + | ||
| 22 | + | At first, let's draw a sine function, **y = sin(x)**. We double-click on the chart, the series editor opens (*"Edit series"*). Click on *"Add"* and select *"Function series"* from the drop-down list. The chart will display a line going from the bottom-left to the top-right corner as a representative of the FuncSeries. | |
| 23 | + | ||
| 24 | + | We could give the series a red color. Function series don't have a `SeriesColor` property, but we can use the property `Pen` for this purpose: Set `Pen.Color` to `clRed`. | |
| 25 | + | ||
| 26 | + | Now we go to the page *"Events"* of the object inspector, and double-click on the event `OnCalculate`. This is the place where we define the function. `OnCalculate` is called whenever the series needs the y value for a given x value: | |
| 27 | + | ||
| 28 | + | ``` pascal | |
| 29 | + | procedure TForm1.Chart1FuncSeries1Calculate(const AX: Double; out AY: Double); | |
| 30 | + | begin | |
| 31 | + | AY := sin(AX); | |
| 32 | + | end; | |
| 33 | + | ``` | |
| 34 | + | ||
| 35 | + | 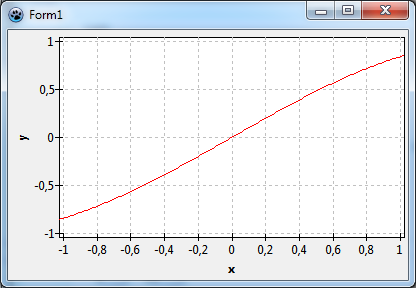 | |
| 36 | + | ||
| 37 | + | When we compile we'll see the sine funtion. But it is not the full wave - because we did not set up the axes, x runs only between -1 and +1, the default for an empty x axis extent. | |
| 38 | + | ||
| 39 | + | ## Setting the extent | |
| 40 | + | ||
| 41 | + | ### x extent | |
| 42 | + | ||
| 43 | + | To get a wider axis range we have two options: we can set the **extent of the series** or the **extent of the chart**. There are subtle differences between both cases, in our simple chart, however, they won't show up, and therefore, we will not discuss them here. So go to the object inspector, select the series' property `Extent`, set the axis start at `XMin` to, say, -10, and the axis end at `XMax` to +10. Activate these axis limits by setting `UseXMin` and `UseXMax` to `true`. Now when you recompile, you'll see the sine function between -10 and 10. | |
| 44 | + | ||
| 45 | + | 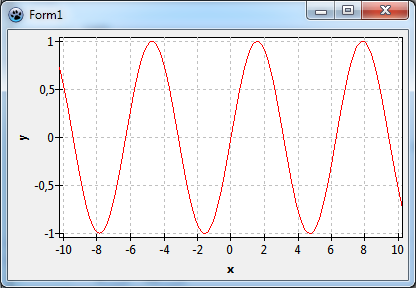 | |
| 46 | + | ||
| 47 | + | ### y extent | |
| 48 | + | ||
| 49 | + | Why don't we play with the function a bit to see what happens? Go to the `OnCalculate` event handler again and multiply the sine function by 2: | |
| 50 | + | ||
| 51 | + | ``` pascal | |
| 52 | + | procedure TForm1.Chart1FuncSeries1Calculate(const AX: Double; out AY: Double); | |
| 53 | + | begin | |
| 54 | + | AY := 2*sin(AX); | |
| 55 | + | end; | |
| 56 | + | ``` | |
| 57 | + | ||
| 58 | + | 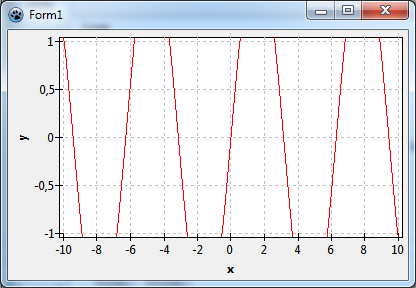 | |
| 59 | + | ||
| 60 | + | Oh -- the function series does not automatically update the y extent! This is true for the release version of Lazarus v1.0. In the trunk version, however, the `FuncSeries` has a new property `ExtentAutoY` which, if set to `true`, enforces automatic calculation of the y extent. Please note that the property applies only if both `Extent.UseXMin` and `Extent.UseXMax` are `true`. | |
| 61 | + | ||
| 62 | + | If you don't have the trunk version of Lazarus you have to set the extent manually: Select the series `Extent` again, set `YMin` to -2, `YMax` to 2, and `UseYMin` and `UseYMax` to `true`. This will show us the full sine curve with amplitude 2. | |
| 63 | + | ||
| 64 | + | 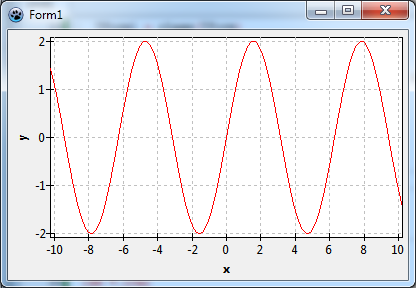 | |
| 65 | + | ||
| 66 | + | ## Zooming | |
| 67 | + | ||
| 68 | + | Now let's focus on the statement in the introduction that function series are always smooth, even at high magnification. To see the difference, we plot the sine function a second time, but now as a line series which draws the function only with predefined segments. | |
| 69 | + | ||
| 70 | + | Add a *"line series"* to the chart, set its `Pen.Style` to `psDash`, and add code to the form's OnCreate event handler which defines the series data: | |
| 71 | + | ||
| 72 | + | ``` pascal | |
| 73 | + | procedure TForm1.FormCreate(Sender: TObject); | |
| 74 | + | const | |
| 75 | + | N = 100; | |
| 76 | + | XMIN = -10; | |
| 77 | + | XMAX = 10; | |
| 78 | + | var | |
| 79 | + | i: Integer; | |
| 80 | + | x: Double; | |
| 81 | + | begin | |
| 82 | + | for i:=0 to N-1 do begin | |
| 83 | + | x := XMIN + (XMAX - XMIN) * i / (N-1); | |
| 84 | + | Chart1LineSeries1.AddXY(x, 2*sin(x)); | |
| 85 | + | end; | |
| 86 | + | end; | |
| 87 | + | ``` | |
| 88 | + | ||
| 89 | + | When you compile you'll see an overlay of the red function series and the black line series, the curves are hard to separate. Now zoom into the chart: while holding the left mouse button down drag a small rectangle near one of the maxima of the sine function (you need to drag from the top-left to the bottom-right corner to get the zoom effect). After you release the mouse you'll see a blow-up of the zoomed rectangle. If the magnification is large enough, you will see the segments of the line series, but the function series will still be smooth. | |
| 90 | + | ||
| 91 | + | 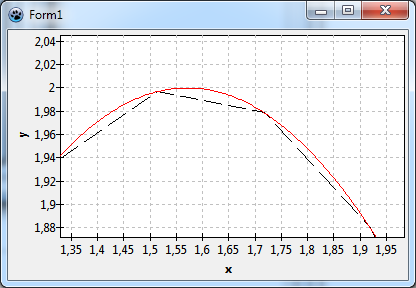 | |
| 92 | + | ||
| 93 | + | What is the reason why the function series is so smooth even at extreme magnification? This is because the function is calculated at very small intervals defined by the property `Step` of `TFuncSeries`. This number is in screen pixels and, therefore, the smoothness is independent of zoom magnification. Its default value of 2 is a good compromise between almost perfect resolution and drawing speed for most functions. | |
| 94 | + | ||
| 95 | + | Before we continue, delete the line series -- we don't need it any more. Remove also the FormCreate event handler. | |
| 96 | + | ||
| 97 | + | ## Domain exclusions | |
| 98 | + | ||
| 99 | + | === Plotting y = tan(x) === | |
| 100 | + | ||
| 101 | + | In this exercise we want to plot a different function, **y = tan(x)**. We can easily adapt our project to this function by changing the `OnCalculate` event handler (you will need the `math` unit in the `uses` clause): | |
| 102 | + | ||
| 103 | + | ``` pascal | |
| 104 | + | procedure TForm1.Chart1FuncSeries1Calculate(const AX: Double; out AY: Double); | |
| 105 | + | begin | |
| 106 | + | AY := tan(AX); | |
| 107 | + | end; | |
| 108 | + | ``` | |
| 109 | + | ||
| 110 | + | 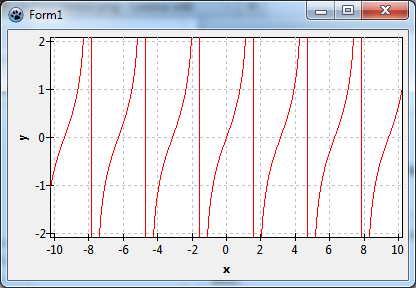 | |
| 111 | + | ||
| 112 | + | The chart looks fine at first sight, but when you remember some basics of the tan function from school you'll notice that the (almost) vertical lines near ±1.6, ±4.7, ±7.9 are not correct. The function is not defined at these locations (to be exact, at (n+1/2)π). The lines should not be there. Because the function series does not "know" about these discontinuities, it draws a connection line between the last and first calculated point before and after the discontinuities. | |
| 113 | + | ||
| 114 | + | `TFuncSeries` provides so-called `DomainExclusions` to overcome this issue. These are points and regions at which the function is not calculated and not drawn. Presently, `DomainExclusions` do not appear in the Object Inspector, but must be assigned in code at runtime by calling their methods `AddPoint` or `AddRange`. | |
| 115 | + | ||
| 116 | + | In case of the tan function, we add the following code to the form's OnCreate event handler in which we exclude above-mentioned points from the calculation: | |
| 117 | + | ||
| 118 | + | ``` pascal | |
| 119 | + | procedure TForm1.FormCreate(Sender: TObject); | |
| 120 | + | begin | |
| 121 | + | with Chart1FuncSeries1.DomainExclusions do begin | |
| 122 | + | AddPoint(pi/2); AddPoint(-pi/2); | |
| 123 | + | AddPoint(3*pi/2); AddPoint(-3*pi/2); | |
| 124 | + | AddPoint(5*pi/2); AddPoint(-5*pi/2); | |
| 125 | + | end; | |
| 126 | + | end; | |
| 127 | + | ``` | |
| 128 | + | ||
| 129 | + | 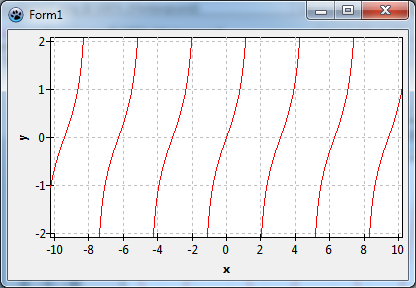 | |
| 130 | + | ||
| 131 | + | This chart, now, is perfect. | |
| 132 | + | ||
| 133 | + | It should be mentioned, however, that the code in the `FormCreate` procedure is too specific and is correct only for our x axis range from -10 to 10. Suppose the user could zoom out or could change the axis limits in some other way. Then these domain exclusions may not be appropriate any longer. Therefore, you should provide a more general method, maybe "`UpdateDomainExclusions`", and call it where appropriate. The first idea would be to use the chart's `OnExtentChanged` event. Without going into details, however, this may cause a hang under some circumstances because this event occurs after drawing of the chart. In Lazarus v2.1 or newer, however, there is a new event `OnExtentValidate` which is better suited because it is called before any drawing. If you stick to an older version you could use the event handler for `TChart.OnAfterDrawBackwall` although its name is not intuitive for this purpose. Don't forget to call `DomainExclusions.Clear` to avoid adding the same points again and again. | |
| 134 | + | ||
| 135 | + | ``` pascal | |
| 136 | + | procedure TForm1.UpdateDomainExclusions; | |
| 137 | + | var | |
| 138 | + | ex: TDoubleRect; // unit TAChartUtils.pas | |
| 139 | + | x: Integer; | |
| 140 | + | begin | |
| 141 | + | ex := Chart1.CurrentExtent; | |
| 142 | + | Chart1.DisableRedrawing; | |
| 143 | + | try | |
| 144 | + | with Chart1FuncSeries1.DomainExclusions do begin | |
| 145 | + | Clear; | |
| 146 | + | for x := Floor(ex.a.x / Pi - 0.5) to Ceil(ex.b.x / Pi + 0.5) do | |
| 147 | + | AddPoint((x + 0.5) * Pi); | |
| 148 | + | end; | |
| 149 | + | finally | |
| 150 | + | Chart1.EnableRedrawing; | |
| 151 | + | end; | |
| 152 | + | end; | |
| 153 | + | ``` | |
| 154 | + | ||
| 155 | + | === Plotting y = ln(x) === | |
| 156 | + | ||
| 157 | + | In the last exercise, we add another function, y = ln(x). For this, double-click on the chart again, and in the series editor add another function series. Set its color to `clBlue`, and write the following `OnCalculate` event handler which tells the series to plot a log function: | |
| 158 | + | ||
| 159 | + | ``` pascal | |
| 160 | + | procedure TForm1.Chart1FuncSeries2Calculate(const AX: Double; out AY: Double); | |
| 161 | + | begin | |
| 162 | + | AY := ln(AX); | |
| 163 | + | end; | |
| 164 | + | ``` | |
| 165 | + | ||
| 166 | + | 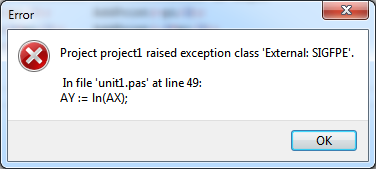 | |
| 167 | + | ||
| 168 | + | But when we run the program it crashes because of a floating point exception! Where does that come from? Our x axis starts at -10, and the logarithmic function can be calculated only for positive x values. What can be done against that? The answer is domain exclusions, again. We just forbid calculation of the function for negative values and for `x = 0`. This can be achieved by adding a range from -INF to 0 to the series' domain exclusions. The method `AddRange`, by default, also includes the end points of the interval, so we need no special treatment for `x = 0`. We modify the form's `OnCreate` event handler as follows: | |
| 169 | + | ||
| 170 | + | ``` pascal | |
| 171 | + | procedure TForm1.FormCreate(Sender: TObject); | |
| 172 | + | begin | |
| 173 | + | with Chart1FuncSeries1.DomainExclusions do begin | |
| 174 | + | AddPoint(pi/2); AddPoint(-pi/2); | |
| 175 | + | AddPoint(3*pi/2); AddPoint(-3*pi/2); | |
| 176 | + | AddPoint(5*pi/2); AddPoint(-5*pi/2); | |
| 177 | + | end; // ... or use the UpdateDomainExclusions procedure discussed in the text | |
| 178 | + | with Chart1FuncSeries2.DomainExclusions do begin | |
| 179 | + | AddRange(NegInfinity, 0); | |
| 180 | + | end; | |
| 181 | + | end; | |
| 182 | + | ``` | |
| 183 | + | ||
| 184 | + | Now the program runs fine. | |
| 185 | + | ||
| 186 | + | What if we would want to plot the function `y = sqrt(x)`? There is a subtle difference to `y = log(x)`: while both functions cannot be calculated for `x < 0`, `sqrt(x)` is defined also at `x = 0`, i.e. the point `x = 0` must be excluded from the domain exclusion interval. This can be achieved in the `AddRange` method by specifying the open end(s) of the interval in an optional third parameter set of `TIntervalOption = (ioOpenStart, ioOpenEnd)`. The correct code to set up the `DomainExclusions` for `y = sqrt(x)`, therefore, is | |
| 187 | + | ||
| 188 | + | ``` pascal | |
| 189 | + | SqrtXSeries.DomainExclusions.AddRange(NegInfinity, 0, [ioOpenEnd]); | |
| 190 | + | ``` | |
| 191 | + | ||
| 192 | + | One thing to mention is the property `Epsilon` of the `DomainExclusions`. This value controls the distance between the endpoint of the excluded interval and the last drawn function point (of a closed excluded interval). Its default value of `1e-6` is fine for most cases, but you may want to change it if it does not lead to correct results. | |
| 193 | + | ||
| 194 | + | 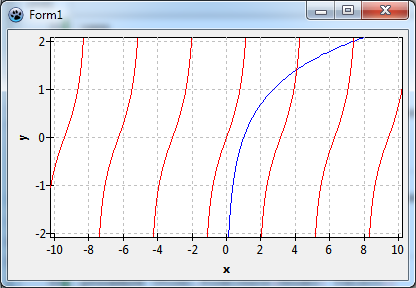 | |
| 195 | + | ||
| 196 | + | ## Cleaning up | |
| 197 | + | ||
| 198 | + | ### Legend | |
| 199 | + | ||
| 200 | + | Before we finish we could apply some improvements. Never show several curves in the same chart without a legend, there would be no way to distinguish them. Enter the function names as the `Title` of both series, and set the legend's `Visible` to `true`. | |
| 201 | + | ||
| 202 | + | ### Additional coordinate axes (TConstantLineSeries) | |
| 203 | + | ||
| 204 | + | Plots of mathematical functions often have axes crossing at the origin. The trunc version of TAChart now has an option to shift the axes away from the chart edge by applying the new property `Position`. But maybe you prefer the release version 1.0? For this case let's go another way: | |
| 205 | + | ||
| 206 | + | Open the series editor again, and add two [[TAChart documentation|"constant line" series]]. These are very simple series that display a line parallel to the coordinate axes. Their location is defined by the property `Position`, their direction -- horizontal or vertical -- by `LineStyle`. There is nothing to do with `Position` which has the default value 0. You just have to set `LineStyle` of the one series to `lsHorizontal`, and that of the other one to `lsVertical`. The [[TAChart documentation|TConstantLineSeries]] also has an [[TAChart documentation|arrow]] which can be activated by setting `Arrow.Visible` to `true`. Play with `Length`, `Width` and `BaseLength` properties of an `Arrow` to find the shape that you want. | |
| 207 | + | ||
| 208 | + | Finally you should turn off the constant series' property `Legend.Visible`, otherwise there will be two unidentified entries in the legend. | |
| 209 | + | ||
| 210 | + | Here's the final result: | |
| 211 | + | ||
| 212 | + |  | |
| 213 | + | ||
| 214 | + | ## Source code | |
| 215 | + | ||
| 216 | + | The source code for the final version of this tutorial project can be found in the folder *tutorials/func_series* of the TAChart installation. | |
| 217 | + | ||
| 218 | + | --- | |
| 219 | + | *From the Free Pascal wiki, page "TAChart Tutorial: Function Series", as it stood on 2020-02-29 after a change by Trev, out of the wiki's dump of 2024-05-26. Copyright stays with the author who wrote it, according to the old wiki's [[Licensing]] page. If you have concerns about this material, [message the admin](/wiki-contact).* |