

TAChart Tutorial: Dual y axis, Legend: what changed
Revision 0 to 1. Removed lines have a minus sign; added lines have a plus sign.
Title: TAChart Tutorial: Dual y axis, Legend
| Old | New | Line | |
|---|---|---|---|
| 1 | + | ## Introduction | |
| 2 | + | ||
| 3 | + | 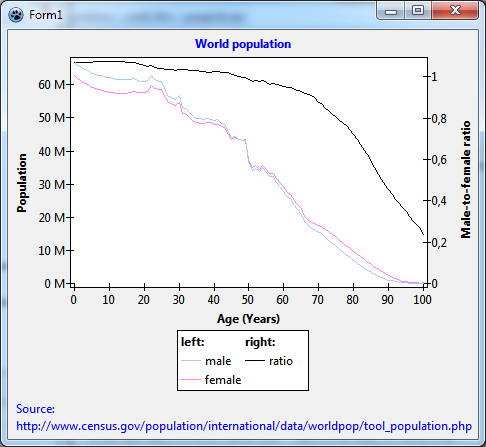 | |
| 4 | + | ||
| 5 | + | When different quantities are plotted into the same chart it happens quite often that they cover a largely different range. In an "ordinary" chart, the series with the large values dominates over the series with the small values which is compressed to a flat line. The chart would be much more meaningful if different axes could be used, one for the large values, and one for the small values. | |
| 6 | + | ||
| 7 | + | When you worked through the tutorial on [[TAChart Tutorial: Userdefined ChartSource|user-defined chartsource]] you will have come across such a case. In that tutorial we created a diagram of the world population as a function of age. There was also an option to draw the ratio of male-to-female population. This latter number is considerably smaller than the population count. So, if both data were combined in the same chart, the population ratio would shrink to a horizontal line. | |
| 8 | + | ||
| 9 | + | This is the background for today's project. We will go to the population data again and draw population count and the male-to-female ratio into the same chart. | |
| 10 | + | ||
| 11 | + | You will learn how to | |
| 12 | + | ||
| 13 | + | - create a chart with **two y axes** | |
| 14 | + | - work with **auto-scale axis transforms** | |
| 15 | + | - use **user-defined axis labels** | |
| 16 | + | - **tweak the legend** using less-known properties. | |
| 17 | + | ||
| 18 | + | This is our "disclaimer", as usual: You should be familiar with Lazarus and FPC, and you should have a basic understanding of the [[TAChart]] library (go through [[TAChart Tutorial: Getting started|Getting started]] tutorial if you don't). In this particular tutorial, it would also be helpful if you had studied the tutorial on [[TAChart Tutorial: Userdefined ChartSource|user-defined chartsource]] first. | |
| 19 | + | ||
| 20 | + | ## Data | |
| 21 | + | ||
| 22 | + | As already mentioned we will be using the same data as in the [[TAChart Tutorial: Userdefined ChartSource|user-defined chartsource]] tutorial. The primary data file is called "`population.txt`" and originates from [www.census.gov](http://www.census.gov/population/international/data/worldpop/tool_population.php). Copy this file from the [[TAChart Tutorial: Userdefined ChartSource|user-defined chartsource tutorial]] to your project output directory, or follow the instructions [[TAChart Tutorial: Userdefined ChartSource|there]] on how to download the file. [[Unit]] population.pas reads this file and stores the data in an [[Array|array]] of `TPopulationRecord`s: | |
| 23 | + | ||
| 24 | + | ``` pascal | |
| 25 | + | type | |
| 26 | + | TPopulationRecord = record | |
| 27 | + | Age: Integer; | |
| 28 | + | Total: Double; | |
| 29 | + | Male: Double; | |
| 30 | + | Female: Double; | |
| 31 | + | Ratio: Double; | |
| 32 | + | end; | |
| 33 | + | ||
| 34 | + | TPopulationArray = array of TPopulationRecord; | |
| 35 | + | ``` | |
| 36 | + | ||
| 37 | + | Now, we have all that we need to start a new project. Add the unit population.pas to the form's [[Uses|uses]] list. Add a [[Variable|variable]] `PopulationData` of type `TPopulationArray` to the [[Private|private]] section of the form. And read the data file by calling the [[Procedure|procedure]] `LoadPopulationData` (in the population unit) from the form's `OnCreate` event handler: | |
| 38 | + | ||
| 39 | + | ``` pascal | |
| 40 | + | uses | |
| 41 | + | ..., population, ...; | |
| 42 | + | ||
| 43 | + | type | |
| 44 | + | TForm1 = class(TForm) | |
| 45 | + | // ... | |
| 46 | + | private | |
| 47 | + | PopulationData : TPopulationArray; | |
| 48 | + | // ... | |
| 49 | + | end; | |
| 50 | + | ||
| 51 | + | const | |
| 52 | + | POPULATION_FILE = 'population.txt'; | |
| 53 | + | ||
| 54 | + | procedure TForm1.FormCreate(Sender: TObject); | |
| 55 | + | begin | |
| 56 | + | LoadPopulationData(POPULATION_FILE, PopulationData); | |
| 57 | + | end; | |
| 58 | + | ``` | |
| 59 | + | ||
| 60 | + | ## Preparation of the chart | |
| 61 | + | ||
| 62 | + | Now we can begin charting... | |
| 63 | + | ||
| 64 | + | Add a **[[TChart]]** component to the form: | |
| 65 | + | ||
| 66 | + | - Align it as `alClient`. | |
| 67 | + | - Set its `BackColor` to `clWhite`. | |
| 68 | + | ||
| 69 | + | Add **three line series** to the chart: | |
| 70 | + | ||
| 71 | + | - To be more descriptive, change their names to `LineSeries_male`, `LineSeries_female`, and `LineSeries_ratio`. | |
| 72 | + | - Set the `SeriesColor` of the *male* series to a "boyish" `clSkyBlue`, that of the *female* series to a "girlish" `$00FF80FF`, and leave the color of the *ratio* series at black. | |
| 73 | + | ||
| 74 | + | Where do the series get their data from? Our data is stored in the `PopulationData` array, so it would be best to take advantage of a [[TAChart documentation|user-defined chart source]]. To be exact: we need three chart sources, one for each series. | |
| 75 | + | ||
| 76 | + | Therefore, let's add three `TUserDefinedChartSource`s to the form: | |
| 77 | + | ||
| 78 | + | - Rename them as `ChartSource_male`, `ChartSource_female`, and `ChartSource_ratio`. | |
| 79 | + | - Assign each chartsource to the [[Property|property]] `Source` of the corresponding line series. | |
| 80 | + | - Write the following event handler and assign it to the `OnGetDataItem` event of each user-defined chart source: | |
| 81 | + | ||
| 82 | + | ``` pascal | |
| 83 | + | procedure TForm1.ChartSourceGetChartDataItem( | |
| 84 | + | ASource: TUserDefinedChartSource; AIndex: Integer; var AItem: TChartDataItem); | |
| 85 | + | begin | |
| 86 | + | AItem.X := PopulationData[AIndex].Age; | |
| 87 | + | if ASource = ChartSource_male then | |
| 88 | + | AItem.Y := PopulationData[AIndex].Male / 1e6 | |
| 89 | + | else if ASource = ChartSource_female then | |
| 90 | + | AItem.Y := PopulationData[AIndex].Female / 1e6 | |
| 91 | + | else | |
| 92 | + | AItem.Y := PopulationData[AIndex].Ratio / 100; | |
| 93 | + | end; | |
| 94 | + | ``` | |
| 95 | + | ||
| 96 | + | Here we tell the chart source where it finds the data: the x value is taken from the `Age` field of the `TPopulationRecord`, and, depending on the chart source, the y value is taken from the `Male`, `Female` or `Ratio` fields of the `TPopulationRecord`. We divide the population count by 1 million to get rid of many zeros. So, don't forget: the population axis will be labelled in terms of millions; we will come back to that later. We also divide the male-to-female ratio, as read from the file, by 100 since we just want fractions, no percentages. | |
| 97 | + | ||
| 98 | + | Time to compile? No, not yet. We have to tell the chart sources the number of data points. This information is known after reading the data file. Therefore, we set the property `PointNumber` of each chart source to the length of the data array in the form's `OnCreate` event handler: | |
| 99 | + | ||
| 100 | + | ``` pascal | |
| 101 | + | procedure TForm1.FormCreate(Sender: TObject); | |
| 102 | + | begin | |
| 103 | + | LoadPopulationData(POPULATION_FILE, PopulationData); | |
| 104 | + | ChartSource_male.PointsNumber := Length(PopulationData); | |
| 105 | + | ChartSource_female.PointsNumber := Length(PopulationData); | |
| 106 | + | ChartSource_ratio.PointsNumber := Length(PopulationData); | |
| 107 | + | end; | |
| 108 | + | ``` | |
| 109 | + | ||
| 110 | + | At this stage, your form and object tree should look like this: | |
| 111 | + | ||
| 112 | + | 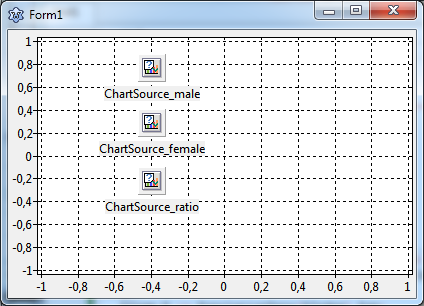 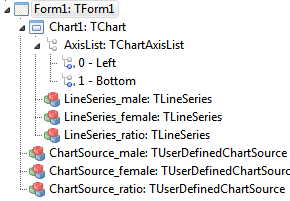 | |
| 113 | + | ||
| 114 | + | and when you compile and run you should see something like this: | |
| 115 | + | ||
| 116 | + | 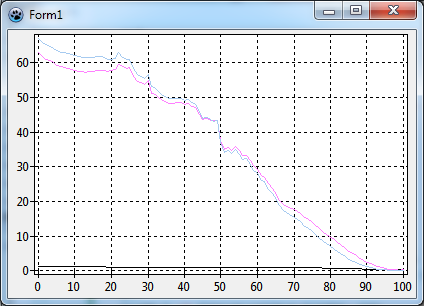 | |
| 117 | + | ||
| 118 | + | As mentioned in the introduction, the male-to-female ratio -- that is the black line -- is very flat and shows almost no structure. This is due to the different magnitudes: the population numbers go almost up to 70 while the ratio is around 1. | |
| 119 | + | ||
| 120 | + | ## Setting up a second y axis | |
| 121 | + | ||
| 122 | + | We need a second y axis. | |
| 123 | + | ||
| 124 | + | For this, go to the object tree, right-click on `AxisList` (right underneath the `Chart1`) and add a new axis to the chart. Now we have three axes: | |
| 125 | + | ||
| 126 | + | 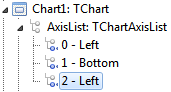 | |
| 127 | + | ||
| 128 | + | Select the axis \#2 which is still a left axis at this time, and in the object inspector, set its `Alignment` to `calRight`. | |
| 129 | + | ||
| 130 | + | This is maybe a good place to mention that having two y axes is not the limit. In fact, you can add any number of axes to the `AxisList` of the chart, and you can use them as vertical axes at the left or right, or as horizontal axes at the top or the bottom of the chart. Have a look at the parameter [[TAChart documentation|Group]] of the axis: axes with the same group parameter are drawn into the same rectangle, axes with different group values are drawn side-by-side. | |
| 131 | + | ||
| 132 | + | How does the chart know which series belongs to which axis? For this purpose, each series has properties `AxisIndexX` and `AxisIndexY`. Since the *male* and *female* series will be plotted on the left axis set their `AxisIndexY` to 0 -- a look at the object tree tells you that this is the index of the left axis. The *ratio* series belongs to the right axis, its `AxisIndexY` must be set to 2. We could also set the axis indices for the bottom axis, but this is not absolutely necessary here. | |
| 133 | + | ||
| 134 | + | When we compile the result is a bit disappointing: no change - the black *ratio* series is still very small. | |
| 135 | + | ||
| 136 | + | 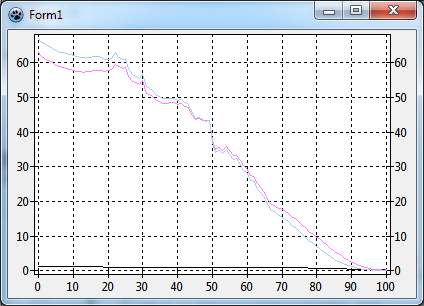 | |
| 137 | + | ||
| 138 | + | ## Setting up auto-scale axis transformations | |
| 139 | + | ||
| 140 | + | The reason why the second y axis is not scaled independently of the first one is that we ignore so far internal coordinate systems of the chart. TAChart employs three coordinate systems in the transition from "real world" data to the pixels on the screen: | |
| 141 | + | ||
| 142 | + | - [[TAChart documentation|axis coordinates]] are the coordinates in which the data come in, or, in other words, which are labeled along the axes. In our project, these are e.g. the population numbers (after division by 1 million), i.e. numbers between about 0 and 70. | |
| 143 | + | - [[TAChart documentation|graph coordinates]] are obtained after applying transformations. There is another tutorial where we apply a logarithmic transform, in this case the graph coordinates would be the logarithms of the input data. | |
| 144 | + | - [[TAChart documentation|image coordinates]] belong to the pixels on the screen calculated from the graph coordinates. | |
| 145 | + | ||
| 146 | + | So, there are two mapping operations involved when calculating the coordinates of a data point on the screen: | |
| 147 | + | ||
| 148 | + | 1. axis coordinates to screen coordinates by means of a user-specified `TChartAxisTransform` | |
| 149 | + | 2. screen coordinates to image coordinates by means of simple linear mapping | |
| 150 | + | ||
| 151 | + | If the axis transformation from axis to graph coordinates is not specified a simple 1:1 mapping is used instead. | |
| 152 | + | ||
| 153 | + | Oh -- we did not use any axis transform. Therefore, our *population* and *ratio* data still "live" in a common world of coordinates. To separate both data sets we need to apply a transformation to each data set which maps it to the same interval of graph coordinates, say, from 0 to 1. | |
| 154 | + | ||
| 155 | + | For this purpose, TAChart has [[TAChart documentation|TAutoScaleAxisTransform]]. It is not directly accessible from the component palette, but is a child of the [[TAChart documentation|TChartAxisTransformations]] component. | |
| 156 | + | ||
| 157 | + | So, let's drop two `TChartAxisTransformations` on the form, one for the left axis, one for the right axis. Rename them to `LeftAxisTransformations` and `RightAxisTransformations`, respectively. Double-click on each of these components and select *"auto scale"* from the *axis transformations editor*. In the object tree, you will see a child of each `ChartAxisTransformations` component. Rename these children to `LeftAxisAutoscaleTransform` and `RightAxisAutoscaleTransform`, respectively. Now assign the `LeftAxisTransformations` and `RightAxisTransformations` components to the property `Transformations` of the left and the right axis. | |
| 158 | + | ||
| 159 | + | This is the object tree after these operations: | |
| 160 | + | ||
| 161 | + | 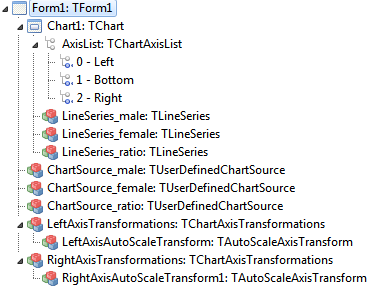 | |
| 162 | + | ||
| 163 | + | Look at the properties `MaxValue` and `MinValue` of the `AutoScaleAxisTransforms`. For both transformations we have `MaxValue = 1` and `MinValue = 0`. This means that each axis is mapped to the range between 0 and 1, in other words, both data sets are compressed or expanded to fill the chart area completely. | |
| 164 | + | ||
| 165 | + | When we compile we see that this exactly happens. | |
| 166 | + | ||
| 167 | + | 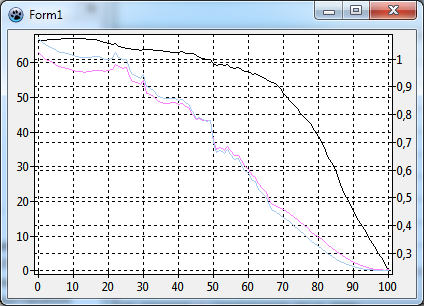 | |
| 168 | + | ||
| 169 | + | We could also, for example, set the `RightAxisAutoscaleTransform`'s `MinValue=1` and `MaxValue=2`. Then the *population* data would still be mapped on the axis from 0 to 1, and the *male-to-female ratio* data would be mapped to the range from 1 to 2, i.e. we would have a paned chart where the lower half would be occupied by the *population* series and the upper half by the *ratio* series. But maybe that's stuff for another tutorial. We leave the `MinValue` and `MaxValue` properties at their defaults. | |
| 170 | + | ||
| 171 | + | ## Cleaning up | |
| 172 | + | ||
| 173 | + | The most difficult part is done now. What is left is to clean up the chart. | |
| 174 | + | ||
| 175 | + | - Remove the **grids** from the axes (you should know how to do that...). The left and right axis grids, in particular, are very confusing. | |
| 176 | + | - Add **axis titles**: | |
| 177 | + | - *"Population"* on the left axis | |
| 178 | + | - *"Male-to-female ratio"* on the right axis | |
| 179 | + | - *"Age (Years)"* on the bottom axis. | |
| 180 | + | - Set the axes' `LabelFont.Style` to `fsBold`. | |
| 181 | + | - You will notice that the title of the right axis is not rotated. The `Title.LabelFont` of the axis has a property `Orientation` - this is the rotation angle in tenth's of degrees. Set it to 900 to get the same orientation as the title of the left axis. | |
| 182 | + | - Force the right axis to **start at zero** by setting its `Range.UseMin` to true. This is sufficient since the `Range.XMin` is at 0 by default. In this way, you could also select other ranges for the axes. | |
| 183 | + | ||
| 184 | + | ### Modifying the axis tick mark texts | |
| 185 | + | ||
| 186 | + | Now we should take care of the fact that we had divided that input data by 1E6, our plot somehow should show this. We could change the title of the left axis to *"Population (in millions)"*. But let's go a different way now: we could append an "M" to the labels, as a shortcut to the correct order of magnitude ("M" = "Mega" = "million"). There are two ways to achieve this: In the first one, we use the property `Marks.Format` of the axis where the "M" can be added ('%0:.9g M'). Or in the second way, we can take advantage of the event `OnMarkToText` that TChartAxis has; this event allows to modify the text displayed at the axis' tick marks in any way. In this case, assign the following procedure to this event of the left axis: | |
| 187 | + | ||
| 188 | + | ``` pascal | |
| 189 | + | procedure TForm1.Chart1AxisList0MarkToText(var AText: String; AMark: Double); | |
| 190 | + | begin | |
| 191 | + | AText := Format('%s M', [AText]); | |
| 192 | + | end; | |
| 193 | + | ``` | |
| 194 | + | ||
| 195 | + | 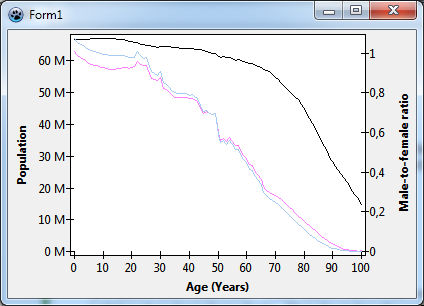 | |
| 196 | + | ||
| 197 | + | ### Setting up the legend | |
| 198 | + | ||
| 199 | + | We are almost finished now. What is left is a [[TAChart documentation|legend]] -- so far, it is not possible for the user to distinguish which curve belongs to which data. So, go to `Chart1.Legend` and set `Visible` to `true`. You see only short pieces of the curves in the legend, no texts. This is because we did not assign a `Title` to each series. Do this now, use the titles *"male"*, *"female"*, and *"ratio"* for the corresponding series. | |
| 200 | + | ||
| 201 | + | 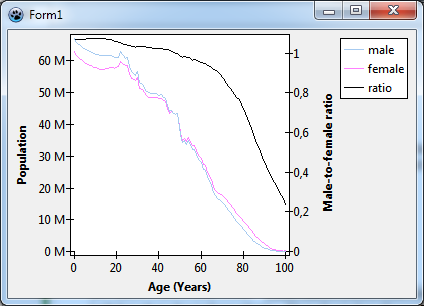 | |
| 202 | + | ||
| 203 | + | Since we have two axes, it would be fine to have a header *"left"* above the entries for the *male* and *female* series in the legend, and a header *"right"* above the entry for the *ratio* series. This effect can be achieved by **grouping**. Each series has a property `Legend` which can be used to control the appearance of the series in the legend. The property `GroupIndex` allows to group a set of series together underneath a common header. So, set the `Legend.GroupIndex` of the *male* and *female* series to zero, and set that of the *ratio* series to 1. Now we go the `Chart.Legend` and define the titles of the group headers by entering text in the property `Chart.Legend.GroupTitles`, line by line for each `GroupIndex`. And maybe you can also go to `Chart.Legend.GroupFont` and set the font to bold. | |
| 204 | + | ||
| 205 | + | A final improvement: what about if the legend were underneath the chart such that the items belonging to the left axis were on the left, and those belonging to the right axis were on the right? | |
| 206 | + | ||
| 207 | + | At first, we set the legend's `Alignment` to `laBottomCenter`. Then we change the `ColumnCount` to 2. We are lucky -- the five legend entries fit into the two-column legend just as we want it. Otherwise we might have to play with the legend [[TAChart documentation|Order]] or the filling sequence of the multicolumn legend (property `ItemFillOrder`), or might have to introduce ([[TAChart documentation|dummy items]]). | |
| 208 | + | ||
| 209 | + | TAChart's legend is very flexible -- please have a look at the [[TAChart documentation|documentation]] to learn more about it. | |
| 210 | + | ||
| 211 | + | At the end, we add the text *"World population"* as the chart's title, and we should mention our reference for the data in the footer -- we don't want to steal data... | |
| 212 | + | ||
| 213 | + | Finished! | |
| 214 | + | ||
| 215 | + |  | |
| 216 | + | ||
| 217 | + | ## Source code | |
| 218 | + | ||
| 219 | + | ### Project file | |
| 220 | + | ||
| 221 | + | For Lazarus v2.1+ you can find the [[Source code|source code]] of this tutorial project in folder **components/tachart/tutorials/population2** of your Lazarus installation. For older versions, copy and paste the following code to the corresponding files. | |
| 222 | + | ||
| 223 | + | ``` pascal | |
| 224 | + | program project1; | |
| 225 | + | ||
| 226 | + | {$mode objfpc}{$H+} | |
| 227 | + | ||
| 228 | + | uses | |
| 229 | + | {$IFDEF UNIX}{$IFDEF UseCThreads} | |
| 230 | + | cthreads, | |
| 231 | + | {$ENDIF}{$ENDIF} | |
| 232 | + | Interfaces, // this includes the LCL widgetset | |
| 233 | + | Forms, Unit1, tachartlazaruspkg | |
| 234 | + | { you can add units after this }; | |
| 235 | + | ||
| 236 | + | {$R *.res} | |
| 237 | + | ||
| 238 | + | begin | |
| 239 | + | RequireDerivedFormResource := True; | |
| 240 | + | Application.Initialize; | |
| 241 | + | Application.CreateForm(TForm1, Form1); | |
| 242 | + | Application.Run; | |
| 243 | + | end. | |
| 244 | + | ``` | |
| 245 | + | ||
| 246 | + | ### Unit1.pas | |
| 247 | + | ||
| 248 | + | ``` pascal | |
| 249 | + | unit Unit1; | |
| 250 | + | ||
| 251 | + | {$mode objfpc}{$H+} | |
| 252 | + | ||
| 253 | + | interface | |
| 254 | + | ||
| 255 | + | uses | |
| 256 | + | Classes, SysUtils, FileUtil, TAGraph, TASeries, TASources, Forms, Controls, | |
| 257 | + | Graphics, Dialogs, population, TACustomSource, TATransformations, TAChartAxisUtils; | |
| 258 | + | ||
| 259 | + | type | |
| 260 | + | ||
| 261 | + | { TForm1 } | |
| 262 | + | ||
| 263 | + | TForm1 = class(TForm) | |
| 264 | + | Chart1: TChart; | |
| 265 | + | LeftAxisTransformations: TChartAxisTransformations; | |
| 266 | + | LeftAxisAutoScaleTransform: TAutoScaleAxisTransform; | |
| 267 | + | RightAxisTransformations: TChartAxisTransformations; | |
| 268 | + | LineSeries_male: TLineSeries; | |
| 269 | + | LineSeries_female: TLineSeries; | |
| 270 | + | LineSeries_ratio: TLineSeries; | |
| 271 | + | ChartSource_male: TUserDefinedChartSource; | |
| 272 | + | ChartSource_female: TUserDefinedChartSource; | |
| 273 | + | ChartSource_ratio: TUserDefinedChartSource; | |
| 274 | + | RightAxisAutoScaleTransform: TAutoScaleAxisTransform; | |
| 275 | + | procedure Chart1AxisList0MarkToText(var AText: String; AMark: Double); | |
| 276 | + | procedure ChartSourceGetChartDataItem( | |
| 277 | + | ASource: TUserDefinedChartSource; AIndex: Integer; | |
| 278 | + | var AItem: TChartDataItem); | |
| 279 | + | procedure FormCreate(Sender: TObject); | |
| 280 | + | private | |
| 281 | + | { private declarations } | |
| 282 | + | PopulationData: TPopulationArray; | |
| 283 | + | public | |
| 284 | + | { public declarations } | |
| 285 | + | end; | |
| 286 | + | ||
| 287 | + | var | |
| 288 | + | Form1: TForm1; | |
| 289 | + | ||
| 290 | + | implementation | |
| 291 | + | ||
| 292 | + | {$R *.lfm} | |
| 293 | + | ||
| 294 | + | const | |
| 295 | + | POPULATION_FILE = 'population.txt'; | |
| 296 | + | ||
| 297 | + | { TForm1 } | |
| 298 | + | ||
| 299 | + | procedure TForm1.ChartSourceGetChartDataItem( | |
| 300 | + | ASource: TUserDefinedChartSource; AIndex: Integer; var AItem: TChartDataItem); | |
| 301 | + | begin | |
| 302 | + | AItem.X := PopulationData[AIndex].Age; | |
| 303 | + | if ASource = ChartSource_male then | |
| 304 | + | AItem.Y := PopulationData[AIndex].Male / 1e6 | |
| 305 | + | else if ASource = ChartSource_female then | |
| 306 | + | AItem.Y := PopulationData[AIndex].Female / 1e6 | |
| 307 | + | else | |
| 308 | + | AItem.Y := PopulationData[AIndex].Ratio / 100; | |
| 309 | + | end; | |
| 310 | + | ||
| 311 | + | procedure TForm1.Chart1AxisList0MarkToText(var AText: String; AMark: Double); | |
| 312 | + | begin | |
| 313 | + | AText := Format('%s M', [AText]); | |
| 314 | + | end; | |
| 315 | + | ||
| 316 | + | procedure TForm1.FormCreate(Sender: TObject); | |
| 317 | + | begin | |
| 318 | + | LoadPopulationData(POPULATION_FILE, PopulationData); | |
| 319 | + | ChartSource_male.PointsNumber := Length(PopulationData); | |
| 320 | + | ChartSource_female.PointsNumber := Length(PopulationData); | |
| 321 | + | ChartSource_ratio.PointsNumber := Length(PopulationData); | |
| 322 | + | end; | |
| 323 | + | ||
| 324 | + | end. | |
| 325 | + | ``` | |
| 326 | + | ||
| 327 | + | ### Unit1.lfm | |
| 328 | + | ||
| 329 | + | ``` pascal | |
| 330 | + | object Form1: TForm1 | |
| 331 | + | Left = 365 | |
| 332 | + | Height = 409 | |
| 333 | + | Top = 169 | |
| 334 | + | Width = 470 | |
| 335 | + | Caption = 'Form1' | |
| 336 | + | ClientHeight = 409 | |
| 337 | + | ClientWidth = 470 | |
| 338 | + | OnCreate = FormCreate | |
| 339 | + | LCLVersion = '1.1' | |
| 340 | + | object Chart1: TChart | |
| 341 | + | Left = 0 | |
| 342 | + | Height = 409 | |
| 343 | + | Top = 0 | |
| 344 | + | Width = 470 | |
| 345 | + | AxisList = < | |
| 346 | + | item | |
| 347 | + | Grid.Visible = False | |
| 348 | + | Minors = <> | |
| 349 | + | Title.LabelFont.Orientation = 900 | |
| 350 | + | Title.LabelFont.Style = [fsBold] | |
| 351 | + | Title.Visible = True | |
| 352 | + | Title.Caption = 'Population' | |
| 353 | + | Transformations = LeftAxisTransformations | |
| 354 | + | OnMarkToText = Chart1AxisList0MarkToText | |
| 355 | + | end | |
| 356 | + | item | |
| 357 | + | Grid.Visible = False | |
| 358 | + | Alignment = calBottom | |
| 359 | + | Minors = <> | |
| 360 | + | Title.LabelFont.Style = [fsBold] | |
| 361 | + | Title.Visible = True | |
| 362 | + | Title.Caption = 'Age (Years)' | |
| 363 | + | end | |
| 364 | + | item | |
| 365 | + | Grid.Visible = False | |
| 366 | + | Alignment = calRight | |
| 367 | + | Minors = <> | |
| 368 | + | Range.UseMin = True | |
| 369 | + | Title.LabelFont.Orientation = 900 | |
| 370 | + | Title.LabelFont.Style = [fsBold] | |
| 371 | + | Title.Visible = True | |
| 372 | + | Title.Caption = 'Male-to-female ratio' | |
| 373 | + | Transformations = RightAxisTransformations | |
| 374 | + | end> | |
| 375 | + | BackColor = clWhite | |
| 376 | + | Foot.Alignment = taLeftJustify | |
| 377 | + | Foot.Brush.Color = clBtnFace | |
| 378 | + | Foot.Font.Color = clBlue | |
| 379 | + | Foot.Text.Strings = ( | |
| 380 | + | 'Source:' | |
| 381 | + | 'http://www.census.gov/population/international/data/worldpop/tool_population.php' | |
| 382 | + | ) | |
| 383 | + | Foot.Visible = True | |
| 384 | + | Legend.Alignment = laBottomCenter | |
| 385 | + | Legend.ColumnCount = 2 | |
| 386 | + | Legend.GroupFont.Style = [fsBold] | |
| 387 | + | Legend.GroupTitles.Strings = ( | |
| 388 | + | 'left:' | |
| 389 | + | 'right:' | |
| 390 | + | ) | |
| 391 | + | Legend.Visible = True | |
| 392 | + | Title.Brush.Color = clBtnFace | |
| 393 | + | Title.Font.Color = clBlue | |
| 394 | + | Title.Font.Style = [fsBold] | |
| 395 | + | Title.Text.Strings = ( | |
| 396 | + | 'World population' | |
| 397 | + | ) | |
| 398 | + | Title.Visible = True | |
| 399 | + | Align = alClient | |
| 400 | + | ParentColor = False | |
| 401 | + | object LineSeries_male: TLineSeries | |
| 402 | + | Legend.GroupIndex = 0 | |
| 403 | + | Title = 'male' | |
| 404 | + | AxisIndexY = 0 | |
| 405 | + | LinePen.Color = clSkyBlue | |
| 406 | + | Source = ChartSource_male | |
| 407 | + | end | |
| 408 | + | object LineSeries_female: TLineSeries | |
| 409 | + | Legend.GroupIndex = 0 | |
| 410 | + | Title = 'female' | |
| 411 | + | AxisIndexY = 0 | |
| 412 | + | LinePen.Color = 16744703 | |
| 413 | + | Source = ChartSource_female | |
| 414 | + | end | |
| 415 | + | object LineSeries_ratio: TLineSeries | |
| 416 | + | Legend.GroupIndex = 1 | |
| 417 | + | Title = 'ratio' | |
| 418 | + | AxisIndexY = 2 | |
| 419 | + | Source = ChartSource_ratio | |
| 420 | + | end | |
| 421 | + | end | |
| 422 | + | object ChartSource_male: TUserDefinedChartSource | |
| 423 | + | OnGetChartDataItem = ChartSourceGetChartDataItem | |
| 424 | + | left = 130 | |
| 425 | + | top = 25 | |
| 426 | + | end | |
| 427 | + | object ChartSource_female: TUserDefinedChartSource | |
| 428 | + | OnGetChartDataItem = ChartSourceGetChartDataItem | |
| 429 | + | left = 130 | |
| 430 | + | top = 79 | |
| 431 | + | end | |
| 432 | + | object ChartSource_ratio: TUserDefinedChartSource | |
| 433 | + | OnGetChartDataItem = ChartSourceGetChartDataItem | |
| 434 | + | left = 130 | |
| 435 | + | top = 137 | |
| 436 | + | end | |
| 437 | + | object LeftAxisTransformations: TChartAxisTransformations | |
| 438 | + | left = 267 | |
| 439 | + | top = 25 | |
| 440 | + | object LeftAxisAutoScaleTransform: TAutoScaleAxisTransform | |
| 441 | + | end | |
| 442 | + | end | |
| 443 | + | object RightAxisTransformations: TChartAxisTransformations | |
| 444 | + | left = 267 | |
| 445 | + | top = 136 | |
| 446 | + | object RightAxisAutoScaleTransform: TAutoScaleAxisTransform | |
| 447 | + | end | |
| 448 | + | end | |
| 449 | + | end | |
| 450 | + | ``` | |
| 451 | + | ||
| 452 | + | ### population.pas | |
| 453 | + | ||
| 454 | + | ``` pascal | |
| 455 | + | unit population; | |
| 456 | + | ||
| 457 | + | {$mode objfpc}{$H+} | |
| 458 | + | ||
| 459 | + | interface | |
| 460 | + | ||
| 461 | + | uses | |
| 462 | + | Classes, SysUtils; | |
| 463 | + | ||
| 464 | + | type | |
| 465 | + | TPopulationRecord = record | |
| 466 | + | Age: Integer; | |
| 467 | + | Total: Double; | |
| 468 | + | Male: Double; | |
| 469 | + | Female: Double; | |
| 470 | + | Ratio: Double; | |
| 471 | + | end; | |
| 472 | + | TPopulationArray = array of TPopulationRecord; | |
| 473 | + | ||
| 474 | + | procedure LoadPopulationData(const AFileName: String; var AData: TPopulationArray); | |
| 475 | + | ||
| 476 | + | implementation | |
| 477 | + | ||
| 478 | + | procedure LoadPopulationData(const AFileName: String; var AData: TPopulationArray); | |
| 479 | + | ||
| 480 | + | function StripThousandSep(const s: String): String; | |
| 481 | + | // Removes the thousand separators from the string | |
| 482 | + | // Otherwise StrToFloat would fail. | |
| 483 | + | var | |
| 484 | + | i: Integer; | |
| 485 | + | begin | |
| 486 | + | Result := s; | |
| 487 | + | for i:=Length(Result) downto 1 do | |
| 488 | + | if Result[i] = ',' then | |
| 489 | + | Delete(Result, i, 1); | |
| 490 | + | end; | |
| 491 | + | ||
| 492 | + | var | |
| 493 | + | List1, List2: TStringList; | |
| 494 | + | i, j, n: Integer; | |
| 495 | + | s: String; | |
| 496 | + | ds: char; | |
| 497 | + | begin | |
| 498 | + | ds := FormatSettings.DecimalSeparator; | |
| 499 | + | List1 := TStringList.Create; | |
| 500 | + | try | |
| 501 | + | List1.LoadFromFile(AFileName); | |
| 502 | + | n := List1.Count; | |
| 503 | + | SetLength(AData, n-2); | |
| 504 | + | FormatSettings.DecimalSeparator := '.'; | |
| 505 | + | List2 := TStringList.Create; | |
| 506 | + | try | |
| 507 | + | List2.Delimiter := #9; | |
| 508 | + | List2.StrictDelimiter := true; | |
| 509 | + | j := 0; | |
| 510 | + | for i:=2 to n-1 do begin | |
| 511 | + | List2.DelimitedText := List1[i]; | |
| 512 | + | s := List1[i]; | |
| 513 | + | with AData[j] do begin | |
| 514 | + | if i < n-1 then | |
| 515 | + | Age := StrToInt(trim(List2[0])) | |
| 516 | + | else | |
| 517 | + | Age := 100; // the last line is "100 +" | |
| 518 | + | Total := StrToFloat(StripThousandSep(trim(List2[1]))); | |
| 519 | + | Male := StrToFloat(StripThousandSep(trim(List2[2]))); | |
| 520 | + | Female := StrToFloat(StripThousandSep(trim(List2[3]))); | |
| 521 | + | Ratio := StrToFloat(trim(List2[4])); | |
| 522 | + | end; | |
| 523 | + | inc(j); | |
| 524 | + | end; | |
| 525 | + | finally | |
| 526 | + | List2.Free; | |
| 527 | + | end; | |
| 528 | + | finally | |
| 529 | + | FormatSettings.DecimalSeparator := ds; | |
| 530 | + | List1.Free; | |
| 531 | + | end; | |
| 532 | + | end; | |
| 533 | + | ||
| 534 | + | end. | |
| 535 | + | ``` | |
| 536 | + | ||
| 537 | + | --- | |
| 538 | + | *From the Free Pascal wiki, page "TAChart Tutorial: Dual y axis, Legend", as it stood on 2019-11-16 after a change by Djzepi, out of the wiki's dump of 2024-05-26. Copyright stays with the author who wrote it, according to the old wiki's [[Licensing]] page. If you have concerns about this material, [message the admin](/wiki-contact).* |