

TAChart Tutorial: Chart Tools: what changed
Revision 1 to 2. Removed lines have a minus sign; added lines have a plus sign.
| Old | New | Line | |
|---|---|---|---|
| 1 | 1 | ## Introduction | |
| 2 | 2 | ||
| 3 | 3 | 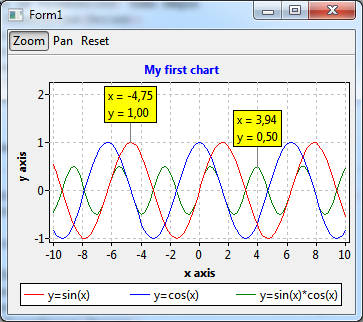 | |
| 4 | 4 | ||
| 5 | 5 | Charts are powerful tools to display relationships between data. They get even more powerful if the user can interact with them, for example: | |
| 6 | 6 | ||
| 7 | 7 | - by **zooming** into a crowded series to display more details, | |
| 8 | 8 | - by **panning** the visible viewport to other regions, | |
| 9 | 9 | - by **displaying data values** from the series or measuring characteristic parameters of the plot. | |
| 10 | 10 | ||
| 11 | 11 | The [[TAChart]] package is equipped with a powerful collection of tools to help creating interactive charts. In this tutorial, we want to show how to apply these tools to create interactive charts. | |
| 12 | 12 | ||
| 13 | 13 | If you are not familiar with TAChart we recommend that you have a look at the [[TAChart Tutorial: Getting started|Getting started tutorial]]. Of course, you must have some experience with Lazarus and FPC. | |
| 14 | 14 | ||
| 15 | 15 | ## Preparation | |
| 16 | 16 | ||
| 17 | 17 | We need a chart to play with. Instead of creating a new chart let's reuse the simple chart of the [[TAChart Tutorial: Getting started|Getting started tutorial]]. In this project we had created a chart of some mathematical functions for x between -10 and 10. The functions were drawn by means of `TLineSeries` storing their data in the built-in list source. Copy the project files (`project1.lpi, project1.lpr, unit1.pas, unit1.lfm`) into a separate folder for the new tutorial. | |
| 18 | 18 | ||
| 19 | 19 | 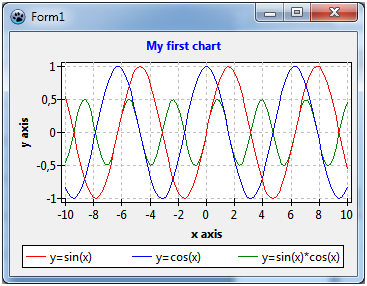 | |
| 20 | 20 | ||
| 21 | 21 | ## Zooming and Panning - the easy way | |
| 22 | 22 | ||
| 23 | 23 | ### Zooming | |
| 24 | 24 | ||
| 25 | 25 | Zooming is very easy -- you don't have to do anything to implement it since it is built into the heart of the chart component. You just have to drag a rectangle with the **left** mouse button down around the feature of interest that you want to see in detail. Keep in mind that you have to drag the mouse from the top-left to the right-bottom corner of the rectangle to get the zoom effect. After you release the mouse button, the region is blown up to fill the entire chart. Easy. | |
| 26 | 26 | ||
| 27 | 27 | 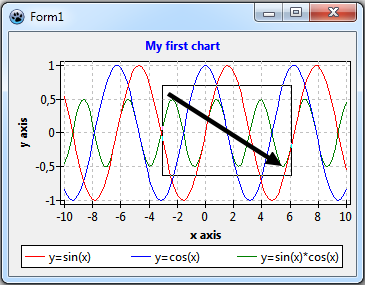 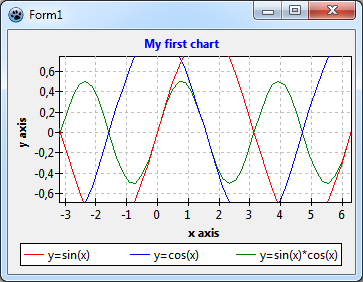 | |
| 28 | 28 | ||
| 29 | 29 | You can repeat this procedure to zoom into the chart deeper and deeper. | |
| 30 | 30 | ||
| 31 | 31 | If you want to restore the original viewport just click into the chart with the left button, or left-drag a rectangle in any direction, except of course from top-left to right-bottom -- this would zoom in even further. | |
| 32 | 32 | ||
| 33 | 33 | Maybe, for some reason, you do not like this behavior. `TChart` has a property `AllowZoom` with which you can turn off the zooming capability. Beyond that, there is nothing else to control the default zooming action. But don't give up: a bit further down we will discuss chart tools, and they give you almost unlimited access to any interactive feature. | |
| 34 | 34 | ||
| 35 | 35 | ### Panning | |
| 36 | 36 | ||
| 37 | 37 | After you have zoomed into a chart you may want to shift the viewport a bit to find a better view. This operation is called "panning". For the built-in panning operation you hold down the **right** mouse button and drag the viewport into the desired direction. More panning options are available by means of the Chart Tools. | |
| 38 | 38 | ||
| 39 | 39 | 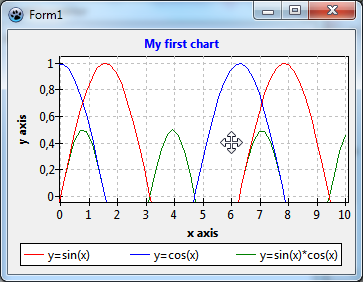 | |
| 40 | 40 | ||
| 41 | 41 | As with zooming you can restore the original viewport by clicking into the chart, or by dragging a rectangle in any direction, except from top-left to bottom-right. Note that you use the left mouse button for "un-panning" although you had used the right button for panning. | |
| 42 | 42 | ||
| 43 | 43 | Since Lazarus v2.1+, TChart has a property `AllowPanning` to disable panning. As we will see shortly, panning can be turned off also with the chart tools, so there is no real disadvantage for older versions. | |
| 44 | 44 | ||
| 45 | 45 | ## Fundamentals on chart tools | |
| 46 | 46 | ||
| 47 | 47 | ### What are chart tools? | |
| 48 | 48 | ||
| 49 | 49 | As you have seen, to add zooming and panning capabilities to your program can't be easier -- there's nothing to do, they are already there. But on the other hand, usage of the built-in routines is quite limited: zooming is only possible by using the left mouse button, panning by using the right mouse button; no mouse-wheel support; no vertical-only or horizontal-only zooming; no reading of data values, etc. | |
| 50 | 50 | ||
| 51 | 51 | For more versatile user interaction a set of [[TAChart documentation|chart tools]] has been added to TAChart. Each tool is specialized to some specific action. From the user point of view, there are two types of tools: [[TAChart documentation|Extent tools]] and [[TAChart documentation|data tools]]. | |
| 52 | 52 | ||
| 53 | 53 | - [[TAChart documentation|Extent tools]] modifiy the **extent** of the chart -- this is the visible viewport -- i.e. they are responsible for zooming and panning. For zooming, you can select from [[TAChart documentation|TZoomDragTool]], [[TAChart documentation|TZoomClickTool]], or [[TAChart documentation|TZoomMouseWheelTool]]; for panning, you can use [[TAChart documentation|TPanDragTool]], [[TAChart documentation|TPanClickTool]], or [[TAChart documentation|TPanMouseWheelTool]]. Note that there are no dedicated tools for unzooming or "un-panning", this feature is built into the tools used for zooming. | |
| 54 | 54 | - [[TAChart documentation|Data tools]] give interactive access to data displayed in the series, or even allow to modify the data: you will find [[TAChart documentation|TDataPointClickTool]], [[TAChart documentation|TDataPointDragTool]], [[TAChart documentation|TDataPointHintTool]], [[TAChart documentation|TDataPointCrosshairTool]], or [[TAChart documentation|TDataPointDistanceTool]]. | |
| 55 | 55 | - If nothing else fits your needs, [[TAChart documentation|TUserDefinedTool]] allows to build your own tool according to your specific requirements. | |
| 56 | 56 | ||
| 57 | 57 | ### Properties of chart tools | |
| 58 | 58 | ||
| 59 | 59 | All these tools have a property called **`Shift`** containing a set of shift states that activate the tool (see the standard LCL enumeration `TShiftState`). | |
| 60 | 60 | ||
| 61 | 61 | An example: If the tool's `Shift` contains `ssCtrl` and `ssLeft`, then the tool becomes active when the user presses the `Ctrl` key *and* left mouse button. Note that all conditions must be met, the tool does not activate if the left mouse button is pressed alone. Each tool must have its own set of unique `Shift` combinations. | |
| 62 | 62 | ||
| 63 | 63 | A note on the keyboard states: In order to receive messages on keyboard events the chart must have the focus. If tools do not work properly try to call `Chart.SetFocus`. There is also a property `AutoFocus` which automatically focuses the chart when the user moves the mouse into the chart. The disadvantage of `AutoFocus` should not be left unmentioned: if you type some text into a memo, move the mouse over the chart and want to continue typing you will notice that the memo has lost the focus, and the keystrokes typed will be ignored... | |
| 64 | 64 | ||
| 65 | 65 | There is another condition that must be met for the tool to become active: Its property **`Enabled`** must be set to `true`, but this is the default setting. This property is useful when several tools share the same `Shift` combinations and are activated by some other code, for example by toolbar buttons. | |
| 66 | 66 | ||
| 67 | 67 | Finally, all tools have in common various **events** that are fired before or after a key or mouse button is pressed or released; in case of the mouse, there are also events that fire before or after the mouse is moved. Usually, chart tools work "out of the box", and these events are not needed. But they are necessary when some functionality is to be added. We will see examples in the course of this tutorial. | |
| 68 | 68 | ||
| 69 | 69 | ### TChartToolset | |
| 70 | 70 | ||
| 71 | 71 |  | |
| 72 | 72 | ||
| 73 | 73 | Chart tools are collected in a special component, `TChartToolset`. You can find it somewhere in the center of the "Chart" page of the Lazarus component palette, it has the icon with the red screw driver. | |
| 74 | 74 | ||
| 75 | 75 | The `TChartToolset` manages communications between tools and chart. Therefore, the chart has a property `Toolset` which has to be assigned to the `TChartToolset` instance. Note that this is a 1:n relationship, i.e. one toolset can handle multiple charts, a very nice feature! I should also mention that I usually forget to make that assignment -- and have to spend time in seeking for the reason why the tools do not work... | |
| 76 | 76 | ||
| 77 | 77 | ## Zooming by the mouse-wheel | |
| 78 | 78 | ||
| 79 | 79 | But now, enough of theory! Let's practise instead. | |
| 80 | 80 | ||
| 81 | 81 | Let us add tools to our demo chart. For this purpose we need a `TChartToolset` . Drop it onto your form and link it to the `Toolset` property of the chart. | |
| 82 | 82 | ||
| 83 | 83 | Although we did not yet add any tools to the toolset, maybe this is a good point to compile and run our program. Try to zoom or pan, as we did above. Oh -- no longer working! This is an important observation: by adding a `TChartToolset` to the form we replaced the default toolset built into the chart. So, the built-in tools for zooming and panning are not operational any more. | |
| 84 | 84 | ||
| 85 | 85 | In order to re-establish zooming and panning for our application we have to add one (or more) zooming or panning tools to the toolset. | |
| 86 | 86 | ||
| 87 | 87 | What do want to achieve? Maybe, instead of using the left and right mouse buttons we could take advantage of the mouse wheel for zooming and panning. And we could assign the left mouse button to a tool which allows us to read data values from the series while clicking onto a data point. | |
| 88 | 88 | ||
| 89 | 89 | To add a mouse-wheel tool for zooming to the chart you double-click on the `ChartToolset1` on the form, or double-click on it on the object tree of the object inspector, or right-click on it and select *"Edit tools"*, as you do with all collection editors of TAChart. Press *"Add"* button, select *"Zoom by mouse-wheel"* from the dropdown list, and a new item `ChartToolset1ZoomMousewheelTool1` appears in the object tree as a child of `ChartToolset1`. | |
| 90 | 90 | ||
| 91 | 91 | 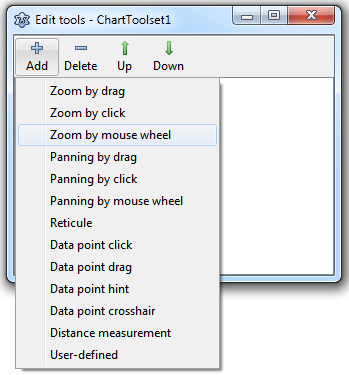 | |
| 92 | 92 | ||
| 93 | 93 | If you would run the program at this time, zooming still would not work because the tool has properties `ZoomFactor` and `ZoomRatio` that define the amount of zooming per mouse-wheel step, and they are still at their default of 1. So, set `ZoomFactor` to 1.1, and run the program. Now zooming works fine. | |
| 94 | 94 | ||
| 95 | 95 | When you scroll the mouse-wheel towards yourself the chart is magnified as if you bring the chart closer to you. Many programs work the other way round: for the same scrolling direction the chart gets smaller as if you move away from the chart. If you want this behavior set the `ZoomFactor` to a number less then 1, for example 0.9. (We will stick to 1.1 for the rest of the tutorial, though). | |
| 96 | 96 | ||
| 97 | 97 | #### Some properties | |
| 98 | 98 | ||
| 99 | 99 | Let's have a look at the properties of the zoom mousewheel tool. There are `AnimationInterval` and `AnimationsSteps` which can be used to achieve an animation of the zooming effect. | |
| 100 | 100 | ||
| 101 | 101 | What is `FixedPoint`? If `true` the center of the zooming operation is the position of the mouse cursor. So, if you want to zoom into a particular feature in the chart move the mouse to the feature and rotate the mouse wheel. If `false` the zooming is always relative to the chart center, no matter where the mouse cursor is. In this case you have to be very careful because it is extremely easy to lose orientation in the chart. | |
| 102 | 102 | ||
| 103 | 103 | #### Using the ExtentSizeLimit | |
| 104 | 104 | ||
| 105 | 105 | 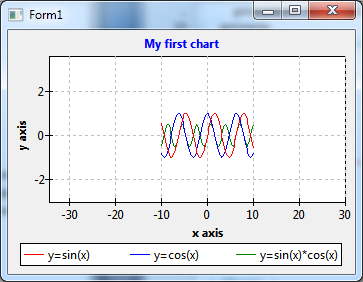 | |
| 106 | 106 | ||
| 107 | 107 | When you zoom *out* you will expose empty regions. Because the user can zoom out further and further the chart may eventually disappear. To prevent this we should restrict the axis ranges such that always data are displayed. | |
| 108 | 108 | ||
| 109 | 109 | For this purpose, TChart has a property **`ExtentSizeLimit`**. Our chart has an x extent from -10 to 10. So we set `ExtentSizeLimit.XMax` to the difference, 20, and activate this setting by `ExtentSizeLimit.UseXMax = true`. Now, we can no longer zoom out beyond the original *x* extent. Similarly, we should restrict the extent of the *y* axis to 2. | |
| 110 | 110 | ||
| 111 | 111 | In the same way, we could prevent to zoom *into* the chart beyond an x extent of, say, 0.01. For this we would set the properties `ExentSizeLimit.XMin` and `ExtentSizeLimit.UseXMin` accordingly. | |
| 112 | 112 | ||
| 113 | 113 | #### Horizontal and vertical zooming | |
| 114 | 114 | ||
| 115 | 115 | Why are there two parameters that control the amount of zooming, **`ZoomFactor`** and **`ZoomRatio`**? This is because the tool can be used for non-proportional zooming: the *x* zoom factor is given by `ZoomFactor` alone while the *y* zoom factor is determined by the product `ZoomFactor*ZoomRatio`. As long as `ZoomRatio=1`, zooming occurs isotropically in all directions. When you set `ZoomFactor=1` and `ZoomRatio=1.1` we leave the *x* direction unchanged, but zoom only along the *y* direction. Or, if we set `ZoomRatio = 1/ZoomFactor` zooming occurs only horizontally along the *x* axis. | |
| 116 | 116 | ||
| 117 | 117 | Hey -- these would be nice features for our program! When we look at the keyboard the `SHIFT`, `Ctrl` and `Alt` keys form some kind of coordinate system: `Ctrl` is the origin, `SHIFT` is the *y* direction, `Alt` is the *x* direction. So we could assign the `SHIFT` key to vertical zooming, the `Alt` key to horizontal zooming, and "no key" to isotropic zooming -- that's easy to remember. | |
| 118 | 118 | ||
| 119 | 119 | How can we implement this feature? Add two more ZoomMouseWheelTools to the form. The first one will do the vertical zoom, so name it `ChartToolset1ZoomMousewheelTool_vert`, select `ssShift` in the `Shift` property, and set `ZoomRatio = 1.1` (keep `ZoomFactor` at 1). The other tool will be for the horizontal zoom, name it `ChartToolset1ZoomMousewheelTool_hor`, set `Shift` to `ssAlt`, and set `ZoomFactor = 1.1` and `ZoomRatio = 0.90909090909` (which is approximately equal to 1/1.1). | |
| 120 | 120 | ||
| 121 | 121 | When you run the program you may notice that zooming stops working after you have pressed the `Alt` key. This is caused by the fact that the `Alt` key plays a special role for menu key handling. To reactivate the program you have to click into the chart. Or select another activation key for the horizontal zoom tool. | |
| 122 | 122 | ||
| 123 | 123 | ## Panning by the mouse-wheel | |
| 124 | 124 | ||
| 125 | 125 | Let's move on the panning. Why don't we use the mousewheel also for panning? Here, panning can go only in one direction -- either *x* or *y*. So let us add two `TPanMouseWheelTool`s and replace numbers at the end of their names by "_vert" and "_hor". The tool for vertical panning should be activated by the `SHIFT` key again, the tool for horizontal panning by the `Alt` key. | |
| 126 | 126 | ||
| 127 | 127 | There is a property `WheelUpDirection` which defaults to `pdUp`. This means that scrolling of the mouse-wheel is translated to a vertical panning direction. This setting is not correct for the horizontal panning tool, select `pdRight` or `pdLeft` instead. | |
| 128 | 128 | ||
| 129 | 129 | Run the program. When you rotate the mouse wheel with `SHIFT` or `Alt` down the chart zooms, but does not pan. What's wrong? | |
| 130 | 130 | ||
| 131 | 131 | The reason is that we are using the same `Shift` settings for the zooming and panning tools. Well, we could use, for example, the `Ctrl` key and assign it additionally to the panning tools. Then vertical panning, for example, would occur by pressing `Ctrl`+`SHIFT`, vertical zooming would occur with `SHIFT` alone. | |
| 132 | 132 | ||
| 133 | 133 | Let's go another way here to demonstrate usage of the `Enabled` property. Add a toolbar to the form with two buttons to activate either zooming or panning. Rename the first button to `ZoomToolbutton` and set `Down` to `true`. Rename the second button to `PanToolbutton`. For both buttons, set the following properties: | |
| 134 | 134 | ||
| 135 | 135 | - `Grouped = true` | |
| 136 | 136 | - `Style = tbsCheck` | |
| 137 | 137 | ||
| 138 | 138 | and assign their `OnClick` to the following event handler: | |
| 139 | 139 | ||
| 140 | 140 | ``` pascal | |
| 141 | 141 | procedure TForm1.ZoomPanToolbuttonClick(Sender: TObject); | |
| 142 | 142 | begin | |
| 143 | 143 | ChartToolset1ZoomMouseWheelTool_iso.Enabled := ZoomToolbutton.Down; | |
| 144 | 144 | ChartToolset1ZoomMouseWheelTool_vert.Enabled := ZoomToolbutton.Down; | |
| 145 | 145 | ChartToolset1ZoomMouseWheelTool_hor.Enabled := ZoomToolbutton.Down; | |
| 146 | 146 | ||
| 147 | 147 | ChartToolset1PanMouseWheelTool_vert.Enabled := PanToolbutton.Down; | |
| 148 | 148 | ChartToolset1PanMouseWheelTool_hor.Enabled := PanToolbutton.Down; | |
| 149 | 149 | end; | |
| 150 | 150 | ``` | |
| 151 | 151 | ||
| 152 | 152 | This enables either the zooming or the panning tools, depending on which toolbutton is down. To synchronize the chart tools' `Enabled` with the buttons' `Down` you should disable both panning tools (or call `ZoomPanToolbuttonClick(nil)` in the `OnCreate` event of the form). | |
| 153 | 153 | ||
| 154 | 154 | Some observations when you run the program: | |
| 155 | 155 | ||
| 156 | 156 | - It's a matter of taste, but maybe you feel that the vertical zoom direction is **opposite** to the direction the mouse wheel is rotated. You can change this by setting the `WheelUpDirection` of the vertical panning tool to `pdDown`. | |
| 157 | 157 | - **Empty chart regions without data** can become visible again. This is because the `ExtentSizeLimit` checks only the width and/or height of the extent. To take care of this the PanMousewheelTool has a set of properties `LimitToExtent`. Activate all options to disallow horizontal and vertical panning beyond the original extent with data. | |
| 158 | 158 | - Maybe you want to change the **speed** of panning. This can be done by adapting the `Step` property. | |
| 159 | 159 | - You may also notice that it is quite cumbersome to restore the original extent of the chart. It would be fine to have a button *"Reset"* in the toolbar which undoes any zooming and panning operations. That's easy: add a third button to the toolbar, name it `RestoreToolbutton`, set its `Caption` to *"Reset"*, and assign its `OnClick` event to the following procedure: | |
| 160 | 160 | ||
| 161 | 161 | ``` pascal | |
| 162 | 162 | procedure TForm1.ResetToolButtonClick(Sender: TObject); | |
| 163 | 163 | begin | |
| 164 | 164 | Chart1.ZoomFull; | |
| 165 | 165 | end; | |
| 166 | 166 | ``` | |
| 167 | 167 | ||
| 168 | 168 | The `ZoomFull` procedure restores the chart extent to its original value. Here's what our program looks like now: | |
| 169 | 169 | ||
| 170 | 170 | 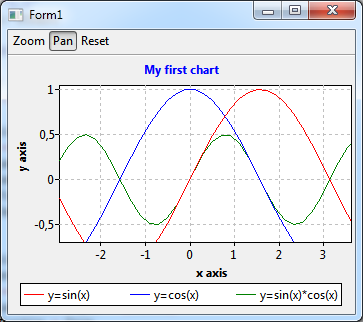 | |
| 171 | 171 | ||
| 172 | 172 | ## Reading data from the series | |
| 173 | 173 | ||
| 174 | 174 | You can add more zooming and panning tools to the toolset to get a practical user interface. But we will stop here with the extent tools and move on to the data tools. | |
| 175 | 175 | ||
| 176 | 176 | ### Using a TDataPointClickTool | |
| 177 | 177 | ||
| 178 | 178 | Our task is to read the x,y coordinates of the series underneath the mouse cursor. A neat tool to achieve this is the `TDatapointClickTool`. Add it to the toolset. Set `Shift` to `ssLeft` to activate it by a left button click. And add a `TStatusbar` to the form where we will display the requested information. | |
| 179 | 179 | ||
| 180 | 180 | Whenever a click occurs on (or sufficiently near) a data point the relevant data are stored in the tool. For example, there is a `Series` property which identifies onto which series the click occurred. Similarly, there is a property `PointIndex` which tells the index of the hit point within its series. The tool provides an `OnPointClick` event which fires when a point is clicked and from where we can query the requested information. We can use the following event handler to extract the information for displaying in the status bar: | |
| 181 | 181 | ||
| 182 | 182 | ``` pascal | |
| 183 | 183 | procedure TForm1.ChartToolset1DataPointClickTool1PointClick( | |
| 184 | 184 | ATool: TChartTool; APoint: TPoint); | |
| 185 | 185 | var | |
| 186 | 186 | x, y: Double; | |
| 187 | 187 | begin | |
| 188 | 188 | with ATool as TDatapointClickTool do | |
| 189 | 189 | if (Series is TLineSeries) then | |
| 190 | 190 | with TLineSeries(Series) do begin | |
| 191 | 191 | x := GetXValue(PointIndex); | |
| 192 | 192 | y := GetYValue(PointIndex); | |
| 193 | 193 | Statusbar1.SimpleText := Format('%s: x = %f, y = %f', [Title, x, y]); | |
| 194 | 194 | end | |
| 195 | 195 | else | |
| 196 | 196 | Statusbar1.SimpleText := ''; | |
| 197 | 197 | end; | |
| 198 | 198 | ``` | |
| 199 | 199 | ||
| 200 | 200 | The parameter `ATool` passed to the event is rather general, thus we have to type-cast it to `TDatapointClickTool` to get access to the mentioned properties. Similarly, the `Series` is of a very basic type as well, another type-cast is needed. Be careful with type-casts, make sure that the class types are correct. Therefore, we check the types by means of `is`. | |
| 201 | 201 | ||
| 202 | 202 | When you run the program and click on a data point you will see its coordinates along with the title of its series in the status bar. | |
| 203 | 203 | ||
| 204 | 204 | 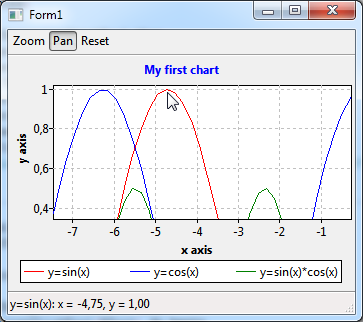 | |
| 205 | 205 | ||
| 206 | 206 | ### Showing permanent labels | |
| 207 | 207 | ||
| 208 | 208 | Unfortunately, there is no indication where exactly the click occurred. It would be better if we could display a label above the clicked point to show the requested information. | |
| 209 | 209 | ||
| 210 | 210 | Here we can take advantage of the fact that the series in our chart get their data from `TListChartSource`s. They have no special components on the form, because this is the default behavior, and each `TChartSeries` (from which `TLineSeries` inherits) has a non-visual built-in listsource which can be accessed by a (public) property `ListSource`. | |
| 211 | 211 | ||
| 212 | 212 | Why is this important? Because the items stored in a listsource provide extra storage for an additional text: | |
| 213 | 213 | ||
| 214 | 214 | ``` pascal | |
| 215 | 215 | type | |
| 216 | 216 | TChartDataItem = object | |
| 217 | 217 | X, Y: Double; | |
| 218 | 218 | Text: String; | |
| 219 | 219 | // ... | |
| 220 | 220 | end; | |
| 221 | 221 | ``` | |
| 222 | 222 | ||
| 223 | 223 | To modify the `Text` assigned to a data point at a given `index` you can call | |
| 224 | 224 | ||
| 225 | 225 | ``` pascal | |
| 226 | 226 | ListSource.Item[index]^.Text := 'some text'; | |
| 227 | 227 | ``` | |
| 228 | 228 | ||
| 229 | 229 | or, in later versions of Lazarus, there is a `SetText` method for abbreviation: | |
| 230 | 230 | ||
| 231 | 231 | ``` pascal | |
| 232 | 232 | ListSource.SetText(index, 'some text'); | |
| 233 | 233 | ``` | |
| 234 | 234 | ||
| 235 | 235 | (You can learn more about list sources from [[TAChart Tutorial: ListChartSource, Logarithmic Axis, Fitting|the tutorial on them]].) | |
| 236 | 236 | ||
| 237 | 237 | Since we did not use this feature all `Text` entries are empty. But when we click onto a data point, we can transfer the coordinate info into the `Text` member of the ChartDataItem by adding the indicated line to our `OnPointClick` event handler of the datapoint click tool (BTW, we don't need the status bar any longer, so delete it and remove the corresponding code from the event handler): | |
| 238 | 238 | ||
| 239 | 239 | ``` pascal | |
| 240 | 240 | procedure TForm1.ChartToolset1DataPointClickTool1PointClick( | |
| 241 | 241 | ATool: TChartTool; APoint: TPoint); | |
| 242 | 242 | var | |
| 243 | 243 | x, y: Double; | |
| 244 | 244 | begin | |
| 245 | 245 | with ATool as TDatapointClickTool do | |
| 246 | 246 | if (Series <> nil) then | |
| 247 | 247 | with (Series as TLineSeries) do begin | |
| 248 | 248 | x := GetXValue(PointIndex); | |
| 249 | 249 | y := GetYValue(PointIndex); | |
| 250 | 250 | { --- next line removed --- } | |
| 251 | 251 | // Statusbar1.SimpleText := Format('%s: x = %f, y = %f', [Title, x, y]); | |
| 252 | 252 | { --- next line added --- } | |
| 253 | 253 | ListSource.Item[PointIndex]^.Text := Format('x = %f'#13#10'y = %f', [x,y]); | |
| 254 | 254 | ParentChart.Repaint; | |
| 255 | 255 | // in newer Lazarus versions you can use (which already contains the Repaint): | |
| 256 | 256 | // ListSource.SetText(PointIndex, Format('x = %f'#13#10'y = %f', [x,y])); | |
| 257 | 257 | end; | |
| 258 | 258 | end; | |
| 259 | 259 | ``` | |
| 260 | 260 | ||
| 261 | 261 | Now we have to make sure that the labels are displayed. For this purpose, the `TChartSeries` which is an ancestor of `TLineSeries` has a property `Marks`. In the sub-properties you find the option `Style` which is set to `smsNone` by default, meaning that no labels are displayed. You see in the object inspector that there is a variety of information than can be displayed in the marks, but you'll need here the option `smsLabel` which shows the text of the ChartDataItems. Another modification may be useful: Set `LinkPen.Color` to some darker color, otherwise the connecting line between label and data point will not be visible on the white background. You may also want to play with some visual enhancements like `CalloutAngle` or `Shape`. | |
| 262 | 262 | ||
| 263 | 263 | You have to do the same changes for all three series in the chart. | |
| 264 | 264 | ||
| 265 | 265 | When you run the project and click on the series you get nice permanent labels. Please note that the markers stay in place even if you change the viewport by zooming or panning. | |
| 266 | 266 | ||
| 267 | 267 |  | |
| 268 | 268 | ||
| 269 | 269 | ### Removing permanent labels | |
| 270 | 270 | ||
| 271 | 271 | Once in a while you may find that you have clicked at the wrong point and you may want to remove a label. | |
| 272 | 272 | ||
| 273 | 273 | The basic idea for this feature is as follows: add another `TDatapointClickTool`, assign it to the right mouse button and, in the `OnDatapointClick` event handler, we remove the text from the clicked ChartDataItem. Try doing it yourself -- you should now know all the necessary steps. | |
| 274 | 274 | ||
| 275 | 275 | ## Related tutorials | |
| 276 | 276 | ||
| 277 | 277 | - [[TAChart Tutorial: Getting started]]: explains how the chart used here is created. | |
| 278 | 278 | - [[TAChart Tutorial: ListChartSource, Logarithmic Axis, Fitting]]: discusses usage of series `Marks`. | |
| 279 | 279 | - [[TAChart Tutorial: ColorMapSeries, Zooming]]: demonstrates other aspects of zooming and panning, like using the ZoomDragTool, PanDragTool and setting up a zoom history. | |
| 280 | 280 | ||
| 281 | 281 | ## Source code | |
| 282 | 282 | ||
| 283 | 283 | ### project.lpr | |
| 284 | 284 | ||
| 285 | 285 | ``` pascal | |
| 286 | 286 | program project1; | |
| 287 | 287 | ||
| 288 | 288 | {$mode objfpc}{$H+} | |
| 289 | 289 | ||
| 290 | 290 | uses | |
| 291 | 291 | {$IFDEF UNIX}{$IFDEF UseCThreads} | |
| 292 | 292 | cthreads, | |
| 293 | 293 | {$ENDIF}{$ENDIF} | |
| 294 | 294 | Interfaces, // this includes the LCL widgetset | |
| 295 | 295 | Forms, Unit1, tachartlazaruspkg | |
| 296 | 296 | { you can add units after this }; | |
| 297 | 297 | ||
| 298 | 298 | {$R *.res} | |
| 299 | 299 | ||
| 300 | 300 | begin | |
| 301 | 301 | RequireDerivedFormResource := True; | |
| 302 | 302 | Application.Initialize; | |
| 303 | 303 | Application.CreateForm(TForm1, Form1); | |
| 304 | 304 | Application.Run; | |
| 305 | 305 | end. | |
| 306 | 306 | ``` | |
| 307 | 307 | ||
| 308 | 308 | ### unit1.pas | |
| 309 | 309 | ||
| 310 | 310 | ``` pascal | |
| 311 | 311 | unit Unit1; | |
| 312 | 312 | ||
| 313 | 313 | {$mode objfpc}{$H+} | |
| 314 | 314 | ||
| 315 | 315 | interface | |
| 316 | 316 | ||
| 317 | 317 | uses | |
| 318 | 318 | Classes, SysUtils, FileUtil, TAGraph, TASeries, TATools, Forms, Controls, | |
| 319 | 319 | Graphics, Dialogs, ComCtrls, types; | |
| 320 | 320 | ||
| 321 | 321 | type | |
| 322 | 322 | ||
| 323 | 323 | { TForm1 } | |
| 324 | 324 | ||
| 325 | 325 | TForm1 = class(TForm) | |
| 326 | 326 | Chart1: TChart; | |
| 327 | 327 | ChartToolset1: TChartToolset; | |
| 328 | 328 | ChartToolset1DataPointClickTool1: TDataPointClickTool; | |
| 329 | 329 | ChartToolset1DataPointClickTool2: TDataPointClickTool; | |
| 330 | 330 | ChartToolset1PanMouseWheelTool_Hor: TPanMouseWheelTool; | |
| 331 | 331 | ChartToolset1PanMouseWheelTool_Vert: TPanMouseWheelTool; | |
| 332 | 332 | ChartToolset1ZoomMouseWheelTool_iso: TZoomMouseWheelTool; | |
| 333 | 333 | ChartToolset1ZoomMouseWheelTool_Hor: TZoomMouseWheelTool; | |
| 334 | 334 | ChartToolset1ZoomMouseWheelTool_Vert: TZoomMouseWheelTool; | |
| 335 | 335 | SinSeries: TLineSeries; | |
| 336 | 336 | CosSeries: TLineSeries; | |
| 337 | 337 | SinCosSeries: TLineSeries; | |
| 338 | 338 | ToolBar1: TToolBar; | |
| 339 | 339 | ResetToolButton: TToolButton; | |
| 340 | 340 | ZoomToolbutton: TToolButton; | |
| 341 | 341 | PanToolbutton: TToolButton; | |
| 342 | 342 | procedure ChartToolset1DataPointClickTool1PointClick( | |
| 343 | 343 | ATool: TChartTool; APoint: TPoint); | |
| 344 | 344 | procedure ChartToolset1DataPointClickTool2PointClick( | |
| 345 | 345 | ATool: TChartTool; APoint: TPoint); | |
| 346 | 346 | procedure FormCreate(Sender: TObject); | |
| 347 | 347 | procedure ResetToolButtonClick(Sender: TObject); | |
| 348 | 348 | procedure ZoomPanToolbuttonClick(Sender: TObject); | |
| 349 | 349 | private | |
| 350 | 350 | { private declarations } | |
| 351 | 351 | public | |
| 352 | 352 | { public declarations } | |
| 353 | 353 | end; | |
| 354 | 354 | ||
| 355 | 355 | var | |
| 356 | 356 | Form1: TForm1; | |
| 357 | 357 | ||
| 358 | 358 | implementation | |
| 359 | 359 | ||
| 360 | 360 | {$R *.lfm} | |
| 361 | 361 | ||
| 362 | 362 | { TForm1 } | |
| 363 | 363 | ||
| 364 | 364 | procedure TForm1.FormCreate(Sender: TObject); | |
| 365 | 365 | const | |
| 366 | 366 | N = 100; | |
| 367 | 367 | MIN = -10; | |
| 368 | 368 | MAX = 10; | |
| 369 | 369 | var | |
| 370 | 370 | i: Integer; | |
| 371 | 371 | x: Double; | |
| 372 | 372 | begin | |
| 373 | 373 | for i:=0 to N - 1 do begin | |
| 374 | 374 | x := MIN + (MAX - MIN) * i / (N - 1); | |
| 375 | 375 | SinSeries.AddXY(x, sin(x)); | |
| 376 | 376 | CosSeries.AddXY(x, cos(x)); | |
| 377 | 377 | SinCosSeries.AddXY(x, sin(x)*cos(x)); | |
| 378 | 378 | end; | |
| 379 | 379 | end; | |
| 380 | 380 | ||
| 381 | 381 | procedure TForm1.ResetToolButtonClick(Sender: TObject); | |
| 382 | 382 | begin | |
| 383 | 383 | Chart1.ZoomFull; | |
| 384 | 384 | end; | |
| 385 | 385 | ||
| 386 | 386 | procedure TForm1.ChartToolset1DataPointClickTool1PointClick( | |
| 387 | 387 | ATool: TChartTool; APoint: TPoint); | |
| 388 | 388 | var | |
| 389 | 389 | x,y: Double; | |
| 390 | 390 | begin | |
| 391 | 391 | with ATool as TDatapointClickTool do | |
| 392 | 392 | if (Series <> nil) then | |
| 393 | 393 | with (Series as TLineSeries) do begin | |
| 394 | 394 | x := GetXValue(PointIndex); | |
| 395 | 395 | y := GetYValue(PointIndex); | |
| 396 | 396 | // Statusbar1.SimpleText := Format('%s: x = %f, y = %f', [Title, x, y]); | |
| 397 | 397 | ListSource.Item[PointIndex]^.Text := Format('x = %f'#13#10'y = %f', [x,y]); | |
| 398 | 398 | ParentChart.Repaint; | |
| 399 | 399 | end; | |
| 400 | 400 | end; | |
| 401 | 401 | ||
| 402 | 402 | procedure TForm1.ChartToolset1DataPointClickTool2PointClick( | |
| 403 | 403 | ATool: TChartTool; APoint: TPoint); | |
| 404 | 404 | begin | |
| 405 | 405 | with ATool as TDatapointClickTool do | |
| 406 | 406 | if (Series <> nil) then | |
| 407 | 407 | with (Series as TLineSeries) do begin | |
| 408 | 408 | ListSource.Item[PointIndex]^.Text := ''; | |
| 409 | 409 | ParentChart.Repaint; | |
| 410 | 410 | end; | |
| 411 | 411 | end; | |
| 412 | 412 | ||
| 413 | 413 | procedure TForm1.ZoomPanToolbuttonClick(Sender: TObject); | |
| 414 | 414 | begin | |
| 415 | 415 | ChartToolset1ZoomMouseWheelTool_iso.Enabled := ZoomToolbutton.Down; | |
| 416 | 416 | ChartToolset1ZoomMouseWheelTool_vert.Enabled := ZoomToolbutton.Down; | |
| 417 | 417 | ChartToolset1ZoomMouseWheelTool_hor.Enabled := ZoomToolbutton.Down; | |
| 418 | 418 | ||
| 419 | 419 | ChartToolset1PanMouseWheelTool_vert.Enabled := PanToolbutton.Down; | |
| 420 | 420 | ChartToolset1PanMouseWheelTool_hor.Enabled := PanToolbutton.Down; | |
| 421 | 421 | end; | |
| 422 | 422 | ||
| 423 | 423 | end. | |
| 424 | 424 | ``` | |
| 425 | 425 | ||
| 426 | 426 | ### unit1.lfm | |
| 427 | 427 | ||
| 428 | - | ||
| 428 | + | ``` lfm | |
| 429 | 429 | object Form1: TForm1 | |
| 430 | 430 | Left = 554 | |
| 431 | 431 | Height = 284 | |
| 432 | 432 | Top = 341 | |
| 433 | 433 | Width = 347 | |
| 434 | 434 | Caption = 'Form1' | |
| 435 | 435 | ClientHeight = 284 | |
| 436 | 436 | ClientWidth = 347 | |
| 437 | 437 | OnCreate = FormCreate | |
| 438 | 438 | LCLVersion = '1.1' | |
| 439 | 439 | object Chart1: TChart | |
| 440 | 440 | Left = 0 | |
| 441 | 441 | Height = 258 | |
| 442 | 442 | Top = 26 | |
| 443 | 443 | Width = 347 | |
| 444 | 444 | AxisList = < | |
| 445 | 445 | item | |
| 446 | 446 | Grid.Color = clSilver | |
| 447 | 447 | Minors = <> | |
| 448 | 448 | Title.LabelFont.Orientation = 900 | |
| 449 | 449 | Title.LabelFont.Style = [fsBold] | |
| 450 | 450 | Title.Visible = True | |
| 451 | 451 | Title.Caption = 'y axis' | |
| 452 | 452 | end | |
| 453 | 453 | item | |
| 454 | 454 | Grid.Color = clSilver | |
| 455 | 455 | Alignment = calBottom | |
| 456 | 456 | Minors = <> | |
| 457 | 457 | Title.LabelFont.Style = [fsBold] | |
| 458 | 458 | Title.Visible = True | |
| 459 | 459 | Title.Caption = 'x axis' | |
| 460 | 460 | end> | |
| 461 | 461 | BackColor = clWhite | |
| 462 | 462 | ExtentSizeLimit.UseXMax = True | |
| 463 | 463 | ExtentSizeLimit.UseXMin = True | |
| 464 | 464 | ExtentSizeLimit.UseYMax = True | |
| 465 | 465 | ExtentSizeLimit.XMax = 20 | |
| 466 | 466 | ExtentSizeLimit.XMin = 0.01 | |
| 467 | 467 | ExtentSizeLimit.YMax = 2 | |
| 468 | 468 | Foot.Brush.Color = clBtnFace | |
| 469 | 469 | Foot.Font.Color = clBlue | |
| 470 | 470 | Legend.Alignment = laBottomCenter | |
| 471 | 471 | Legend.ColumnCount = 3 | |
| 472 | 472 | Legend.Visible = True | |
| 473 | 473 | Title.Brush.Color = clBtnFace | |
| 474 | 474 | Title.Font.Color = clBlue | |
| 475 | 475 | Title.Font.Style = [fsBold] | |
| 476 | 476 | Title.Text.Strings = ( | |
| 477 | 477 | 'My first chart' | |
| 478 | 478 | ) | |
| 479 | 479 | Title.Visible = True | |
| 480 | 480 | Toolset = ChartToolset1 | |
| 481 | 481 | Align = alClient | |
| 482 | 482 | ParentColor = False | |
| 483 | 483 | object SinSeries: TLineSeries | |
| 484 | 484 | Marks.Format = '%2:s' | |
| 485 | 485 | Marks.LinkPen.Color = clGray | |
| 486 | 486 | Marks.Style = smsLabel | |
| 487 | 487 | Title = 'y=sin(x)' | |
| 488 | 488 | LinePen.Color = clRed | |
| 489 | 489 | end | |
| 490 | 490 | object CosSeries: TLineSeries | |
| 491 | 491 | Marks.Format = '%2:s' | |
| 492 | 492 | Marks.LinkPen.Color = clGray | |
| 493 | 493 | Marks.Style = smsLabel | |
| 494 | 494 | Title = 'y=cos(x)' | |
| 495 | 495 | LinePen.Color = clBlue | |
| 496 | 496 | end | |
| 497 | 497 | object SinCosSeries: TLineSeries | |
| 498 | 498 | Marks.Format = '%2:s' | |
| 499 | 499 | Marks.LinkPen.Color = clGray | |
| 500 | 500 | Marks.Style = smsLabel | |
| 501 | 501 | Title = 'y=sin(x)*cos(x)' | |
| 502 | 502 | LinePen.Color = clGreen | |
| 503 | 503 | end | |
| 504 | 504 | end | |
| 505 | 505 | object ToolBar1: TToolBar | |
| 506 | 506 | Left = 0 | |
| 507 | 507 | Height = 26 | |
| 508 | 508 | Top = 0 | |
| 509 | 509 | Width = 347 | |
| 510 | 510 | Caption = 'ToolBar1' | |
| 511 | 511 | EdgeBorders = [ebBottom] | |
| 512 | 512 | ShowCaptions = True | |
| 513 | 513 | TabOrder = 1 | |
| 514 | 514 | object ZoomToolbutton: TToolButton | |
| 515 | 515 | Left = 1 | |
| 516 | 516 | Top = 0 | |
| 517 | 517 | Caption = 'Zoom' | |
| 518 | 518 | Down = True | |
| 519 | 519 | Grouped = True | |
| 520 | 520 | OnClick = ZoomPanToolbuttonClick | |
| 521 | 521 | Style = tbsCheck | |
| 522 | 522 | end | |
| 523 | 523 | object PanToolbutton: TToolButton | |
| 524 | 524 | Left = 41 | |
| 525 | 525 | Top = 0 | |
| 526 | 526 | Caption = 'Pan' | |
| 527 | 527 | Grouped = True | |
| 528 | 528 | OnClick = ZoomPanToolbuttonClick | |
| 529 | 529 | Style = tbsCheck | |
| 530 | 530 | end | |
| 531 | 531 | object ResetToolButton: TToolButton | |
| 532 | 532 | Left = 69 | |
| 533 | 533 | Top = 0 | |
| 534 | 534 | Caption = 'Reset' | |
| 535 | 535 | OnClick = ResetToolButtonClick | |
| 536 | 536 | end | |
| 537 | 537 | end | |
| 538 | 538 | object ChartToolset1: TChartToolset | |
| 539 | 539 | left = 153 | |
| 540 | 540 | top = 66 | |
| 541 | 541 | object ChartToolset1ZoomMouseWheelTool_iso: TZoomMouseWheelTool | |
| 542 | 542 | ZoomFactor = 1.1 | |
| 543 | 543 | end | |
| 544 | 544 | object ChartToolset1ZoomMouseWheelTool_Hor: TZoomMouseWheelTool | |
| 545 | 545 | Shift = [ssAlt] | |
| 546 | 546 | ZoomFactor = 1.1 | |
| 547 | 547 | ZoomRatio = 0.90909090909091 | |
| 548 | 548 | end | |
| 549 | 549 | object ChartToolset1ZoomMouseWheelTool_Vert: TZoomMouseWheelTool | |
| 550 | 550 | Shift = [ssShift] | |
| 551 | 551 | ZoomRatio = 1.1 | |
| 552 | 552 | end | |
| 553 | 553 | object ChartToolset1PanMouseWheelTool_Hor: TPanMouseWheelTool | |
| 554 | 554 | Shift = [ssAlt] | |
| 555 | 555 | LimitToExtent = [pdLeft, pdUp, pdRight, pdDown] | |
| 556 | 556 | WheelUpDirection = pdLeft | |
| 557 | 557 | end | |
| 558 | 558 | object ChartToolset1PanMouseWheelTool_Vert: TPanMouseWheelTool | |
| 559 | 559 | Shift = [ssShift] | |
| 560 | 560 | LimitToExtent = [pdLeft, pdUp, pdRight, pdDown] | |
| 561 | 561 | WheelUpDirection = pdDown | |
| 562 | 562 | end | |
| 563 | 563 | object ChartToolset1DataPointClickTool1: TDataPointClickTool | |
| 564 | 564 | Shift = [ssLeft] | |
| 565 | 565 | OnPointClick = ChartToolset1DataPointClickTool1PointClick | |
| 566 | 566 | end | |
| 567 | 567 | object ChartToolset1DataPointClickTool2: TDataPointClickTool | |
| 568 | 568 | Shift = [ssRight] | |
| 569 | 569 | OnPointClick = ChartToolset1DataPointClickTool2PointClick | |
| 570 | 570 | end | |
| 571 | 571 | end | |
| 572 | 572 | end | |
| 573 | 573 | ``` | |
| 574 | 574 | ||
| 575 | 575 | --- | |
| 576 | 576 | *From the Free Pascal wiki, page "TAChart Tutorial: Chart Tools", as it stood on 2022-10-05 after a change by Wp, out of the wiki's dump of 2024-05-26. Copyright stays with the author who wrote it, according to the old wiki's [[Licensing]] page. If you have concerns about this material, [message the admin](/wiki-contact).* |