

TAChart Tutorial: BarSeries: what changed
Revision 0 to 1. Removed lines have a minus sign; added lines have a plus sign.
Title: TAChart Tutorial: BarSeries
| Old | New | Line | |
|---|---|---|---|
| 1 | + | ## Introduction | |
| 2 | + | ||
| 3 | + | 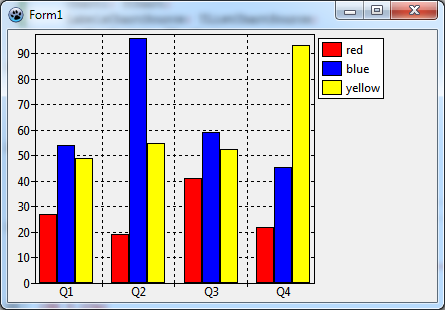 | |
| 4 | + | ||
| 5 | + | The `TAChart` library can create a variety of charts in Lazarus. But in comparison with other series types, bar series appear to be more difficult, mostly because there is a wide range of possibilities: | |
| 6 | + | ||
| 7 | + | - side-by-side bar series | |
| 8 | + | - stacked bar series | |
| 9 | + | - stacked bar series normalized to 100% | |
| 10 | + | - vertical bar series | |
| 11 | + | - horizontal bar series | |
| 12 | + | ||
| 13 | + | In this tutorial we want to show you the basic idea of how to create a chart with several bar series arranged in a side-by-side manner. A [[TAChart Tutorial: Stacked BarSeries|follow-up tutorial]] will teach you how to stack bars above each other. | |
| 14 | + | ||
| 15 | + | Besides bar series this tutorial will also introduce [[TAChart documentation|TRandomChartSource]] which is a convenient data source to design and test a chart without needing to compile the application. | |
| 16 | + | ||
| 17 | + | You'll need some basic knowledge of Pascal and Lazarus. Have a look at the [[TAChart Tutorial: Getting started]] to learn some basic skills for working with `TAChart` if this library is new to you. We also recommend to study the [[TAChart documentation]]. | |
| 18 | + | ||
| 19 | + | ## Preparation | |
| 20 | + | ||
| 21 | + | ### Setting up the chart | |
| 22 | + | ||
| 23 | + | Create a new project, save it. | |
| 24 | + | ||
| 25 | + | Add a `TChart` component from Lazarus' component palette to `Form1`, scale it to fill a given region of the form. | |
| 26 | + | ||
| 27 | + | ### Data for plotting | |
| 28 | + | ||
| 29 | + | Before continuing let's think about which data we want to plot. Maybe you could use the balance of your checking and saving accounts, or the business results of large companies found somewhere in the internet, or something completely different... | |
| 30 | + | ||
| 31 | + | Let's go a different way this time: why don't we plot just random data? Of course, they don't mean anything, but they are simple and very convenient for exercising. In particular, `TAChart` contains the [[TAChart documentation|TRandomChartSource]] component which provides random data to be plugged into a series seamlessly at design-time. This means you can follow this tutorial without a need to write a line of code and without a need to compile the demo application. Later, when the layout work is done, you could remove the RandomChartSources and replace them with the ChartSources containing our data. | |
| 32 | + | ||
| 33 | + | As you will see shortly, there will be three series in the chart, each of them with - say - four bars. For each series, you'll need a `RandomChartSource`. To add a `RandomChartSource` have a look at the "Chart" component palette - it is the fourth icon in the palette highlighted by red in the screenshot below: | |
| 34 | + | ||
| 35 | + |  | |
| 36 | + | ||
| 37 | + | Add three RandomChartSources to the form - one per series. Rename them as `RedChartSource`, `BlueChartSource`, and `YellowChartSource` since they will be linked to "red", "blue" and "yellow" bar series to be created immediately (you should always prefer to use "speaking" variable names.) | |
| 38 | + | ||
| 39 | + | Before doing so, we need to set up the RandomChartSources because they do not provide any data by default. We want to have four bars per series. Therefore, set the property `PointsNumber` to 4. In order to get the axis labels in sync with the bars the `x` axis must range between 1 and 4 (or between 0 and 3, or between 0 and 39, whatever you like - we'll come across axis labels later in more details): `XMin = 1, XMax = 4`. And finally we also have to specify the `y` axis range, maybe select `YMin = 0` and `YMax = 100`. | |
| 40 | + | ||
| 41 | + | ## Bar series | |
| 42 | + | ||
| 43 | + | ### Adding series | |
| 44 | + | ||
| 45 | + | Now that all preparations are done we can add the bar series to the chart. Double-click on the chart to open the series editor. Click "Add" and select "Bar series" from the list. Repeat twice. In the end, we have three bar series in the chart. We don't see them in the chart since they are not yet linked to our data. In the object tree of the Object Inspector, however, the series appear as children of the Chart node. | |
| 46 | + | ||
| 47 | + | Click at the first series in the object tree, and - in the Object Inspector - go to the property `Source` and pick `RedChartSource` from the list. Now the series becomes visible in the chart. To make it "red" go to its property `SeriesColor` and select the color `clRed`. Rename the series to "RedBarSeries", and change its title to "red". The latter is for the legend which we turn on by setting the chart's `Legend.Visible` to `true`. | |
| 48 | + | ||
| 49 | + | Repeat with the other two series correspondingly. | |
| 50 | + | ||
| 51 | + | 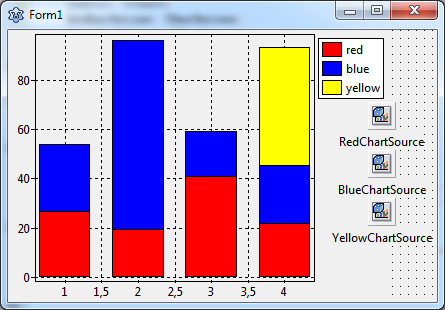 | |
| 52 | + | ||
| 53 | + | Now the chart displays the bar series. However, the bars are located at the same value of the `x` axis, the yellow bars are partly covered by the other bars. Let's fix this. | |
| 54 | + | ||
| 55 | + | ### Side-by-side arrangement of bars | |
| 56 | + | ||
| 57 | + | In oder to arrange the bars of each group (i.e. bars corresponding to the same `x` value) side-by-side, we have to shift them horizontally. `TBarSeries` offers two properties for this purpose: | |
| 58 | + | ||
| 59 | + | - `BarWidthPercent` | |
| 60 | + | - `BarOffsetPercent` | |
| 61 | + | ||
| 62 | + | Both numbers are expressed as a percentage of the distance to the next bar group. (In some charts, the bars are not equidistant and therefore get varying bar widths. To achieve a constant bar thickness in such a case, set the property `BarWidthStyle` to `bwPercentMin`.) | |
| 63 | + | ||
| 64 | + | The basic idea is that the space between the bar groups (100%) is divided by the bars and some empty space to the next group. If we want to leave a gap of - say - one bar width between the groups, we have to divide 100% by 4 (3 bars plus gap), i.e. each bar can occupy a width of 25%. | |
| 65 | + | ||
| 66 | + | So, let's set the `BarWidthPercent` to 25% and see what happens. Oh - not quite what we wanted: The bars did get narrower, but they are still overlapping. Of course, this happens because we did not change the `BarOffsetPercent` parameter. | |
| 67 | + | ||
| 68 | + | Currently, `BarOffsetPercent` is zero which means that the center of each bar is exactly at the position of the axis tick mark. We have to shift the red bars to the left and the yellow bars to the right such that they touch the blue bars which remain in the center. The shift difference is one bar width, i.e. 25%. For moving the red bars to the left their `BarOffsetPercent` has to be negative. | |
| 69 | + | ||
| 70 | + | In summary, we use the following values: | |
| 71 | + | ||
| 72 | + | - `RedBarSeries: BarOffsetPercent = -25, BarWidthPercent = 25` | |
| 73 | + | - `BlueBarSeries: BarOffsetPercent = 0, BarWidthPercent = 25` | |
| 74 | + | - `YellowBarSeries: BarOffsetPercent = 25, BarWidthPercent = 25` | |
| 75 | + | ||
| 76 | + | 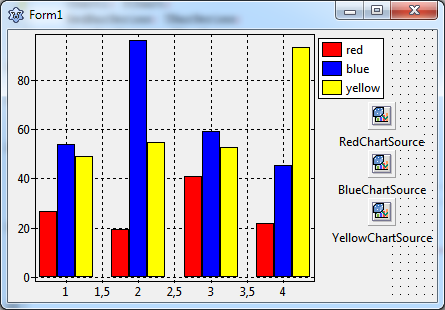 | |
| 77 | + | ||
| 78 | + | ## Axis | |
| 79 | + | ||
| 80 | + | ### Using text labels | |
| 81 | + | ||
| 82 | + | The next issue to be addressed is the `x` axis. Usually bar charts are considered to display categories of some data sets which often requires text labels underneath each bar group. But so far, we only have numerical labels, and the intermediate labels at half integers are particularly annoying. | |
| 83 | + | ||
| 84 | + | The best way to get this right is to use an additional ChartSource for assigning the strings to the axis values, it is a `TListChartSource` this time to be found as the second icon in the chart component palette. Add it to the form and rename is as `LabelsChartSource`. | |
| 85 | + | ||
| 86 | + | The ListChartSource has a built-in data editor which allows to enter data at design-time. Select the `LabelsChartSource` and go to the property `DataPoints`. Click on "..." at the right to open the data points editor, and enter the following data: | |
| 87 | + | ||
| 88 | + | 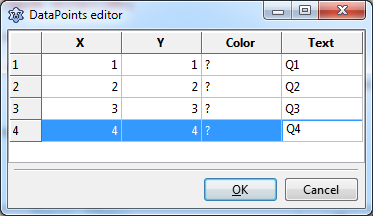 | |
| 89 | + | ||
| 90 | + | In the "X" column we enter the values of the `x` coordinates of each bar group. We could omit the "Y" column, but as we'll see later that it is conventient to have the same data in this column as well because labels are retained after rotation of the bars to an horizontal arrangement. In the column "Text" we specify the texts that will appear for each bar group along the axis as axis marks. Let us assume that our data represent some seasonal values and use the abbreviations "Q1", "Q2", "Q3", and "Q4" for "quarter 1" etc. Column "Color" can be left empty. | |
| 91 | + | ||
| 92 | + | In order to activate these labels we have to assign this ChartSource to the `Source` property of the `Marks` of the bottom axis, and we have to set the property `Style` of the `Marks` to `smsLabel`. | |
| 93 | + | ||
| 94 | + | Voila - here's what we get: | |
| 95 | + | ||
| 96 | + | 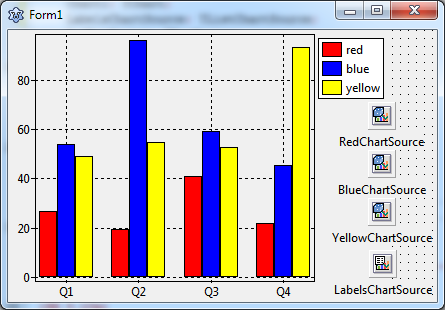 | |
| 97 | + | ||
| 98 | + | ### Showing grid lines & ticks between groups | |
| 99 | + | ||
| 100 | + | A minor issue can be improved: the chart would be clearer if the axis tick marks and grid lines were not at the center of the bar groups, but right between them. | |
| 101 | + | ||
| 102 | + | At first, we turn off the grid of the bottom axis: `BottomAxis.Grid.Visible = false`. To remove the ticks, we can set the `TickLength` and the `TickInnerLength` to `0`. | |
| 103 | + | ||
| 104 | + | But how to add grid lines between the chart groups? This can be done by creating a "minor" axis to the bottom axis. This is another set of ticks and gridlines in addition to the "major" axis. Go to the bottom axis and click on `Minors` to open the corresponding editor. Click "Add" and the select the `0 - M` in the list. Back in the normal Object Inspector, activate `Visible`, increase the `TickLength` to 4, and finally, set `Intervals.Count` to `1` - we only want one minor tick between the major ticks. Check the `Grid` settings - `Visible` should be `true`. | |
| 105 | + | ||
| 106 | + | This leads to the final result. Final? Not quite! There is an annoying little gap underneath the bars. This originates from the chart's `Margins` property which leaves some distance between the series and the axes. Just set `Chart.Margins.Bottom` to `0` to remove the gap. | |
| 107 | + | ||
| 108 | + | 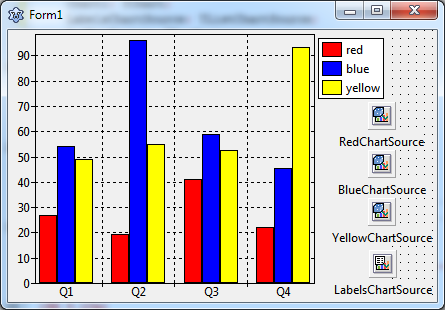 | |
| 109 | + | ||
| 110 | + | ## Horizontal bar series | |
| 111 | + | ||
| 112 | + | Before closing this lesson we'd like to quickly modify this project and create a plot with horizontal bars. This kind of diagram is often preferred when the axis labels consist of lengthy texts, and the chart is in a landscape orientation. | |
| 113 | + | ||
| 114 | + | `TAChart` does not offer a dedicated "`THorizontalBarSeries`", but the standard `TBarSeries` can easily be modified to obtain horizontal bars. Like any other descendant of `TChartSeries` it has properties `AxisIndexX` and `AxisIndexY` to indicate which axis is responsible for `x` and `y` coordinates. Just set `AxisIndexX` to the index of the `LeftAxis` (usually `0`) and `AxisIndexY` to that of the `BottomAxis` in order to rotate the bar direction. | |
| 115 | + | ||
| 116 | + | And, of course, the `LabelsChartSource` has to be linked to the `Marks.Source` of the `LeftAxis` this time. And the minor axis has to be handled accordingly. | |
| 117 | + | ||
| 118 | + | Essentially, that's all that's needed to create a chart with horizontal bars. | |
| 119 | + | ||
| 120 | + | 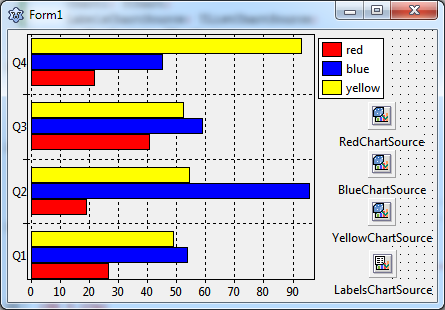 | |
| 121 | + | ||
| 122 | + | ## Summary | |
| 123 | + | ||
| 124 | + | Steps to create a side-by-side bar chart: | |
| 125 | + | ||
| 126 | + | - Every bar requires a separate BarSeries. | |
| 127 | + | - Use the BarSeries' properties `BarWidthPercent` and `BarOffsetPercent` to arrange the bars side-by-side with or without overlapping. The percentages refer to the distance between the center of the bar groups. | |
| 128 | + | - For horizontal bar series, set the series' `AxisIndexX` to the index of the chart's `LeftAxis` (usually `0`) and `AxisIndexY` to the index of the `BottomAxis` (usually `1`). | |
| 129 | + | ||
| 130 | + | ## Source code | |
| 131 | + | ||
| 132 | + | The source code of this tutorial is available in the folder `components/tachart/tutorials/bar_series` of your TAChart installation of newer Lazarus versions. | |
| 133 | + | ||
| 134 | + | ### Project file | |
| 135 | + | ||
| 136 | + | ``` pascal | |
| 137 | + | program project1; | |
| 138 | + | ||
| 139 | + | {$mode objfpc}{$H+} | |
| 140 | + | ||
| 141 | + | uses | |
| 142 | + | {$IFDEF UNIX}{$IFDEF UseCThreads} | |
| 143 | + | cthreads, | |
| 144 | + | {$ENDIF}{$ENDIF} | |
| 145 | + | Interfaces, // this includes the LCL widgetset | |
| 146 | + | Forms, tachartlazaruspkg, Unit1 | |
| 147 | + | { you can add units after this }; | |
| 148 | + | ||
| 149 | + | {$R *.res} | |
| 150 | + | ||
| 151 | + | begin | |
| 152 | + | RequireDerivedFormResource := True; | |
| 153 | + | Application.Initialize; | |
| 154 | + | Application.CreateForm(TForm1, Form1); | |
| 155 | + | Application.Run; | |
| 156 | + | end. | |
| 157 | + | ``` | |
| 158 | + | ||
| 159 | + | ### Unit1.pas | |
| 160 | + | ||
| 161 | + | ``` pascal | |
| 162 | + | unit Unit1; | |
| 163 | + | ||
| 164 | + | {$mode objfpc}{$H+} | |
| 165 | + | ||
| 166 | + | interface | |
| 167 | + | ||
| 168 | + | uses | |
| 169 | + | Classes, SysUtils, FileUtil, Forms, Controls, Graphics, Dialogs, TAGraph, | |
| 170 | + | TASeries, TASources; | |
| 171 | + | ||
| 172 | + | type | |
| 173 | + | ||
| 174 | + | { TForm1 } | |
| 175 | + | ||
| 176 | + | TForm1 = class(TForm) | |
| 177 | + | Chart1: TChart; | |
| 178 | + | LabelsChartSource: TListChartSource; | |
| 179 | + | RedBarSeries: TBarSeries; | |
| 180 | + | BlueBarSeries: TBarSeries; | |
| 181 | + | YellowBarSeries: TBarSeries; | |
| 182 | + | RedChartSource: TRandomChartSource; | |
| 183 | + | BlueChartSource: TRandomChartSource; | |
| 184 | + | YellowChartSource: TRandomChartSource; | |
| 185 | + | private | |
| 186 | + | { private declarations } | |
| 187 | + | public | |
| 188 | + | { public declarations } | |
| 189 | + | end; | |
| 190 | + | ||
| 191 | + | var | |
| 192 | + | Form1: TForm1; | |
| 193 | + | ||
| 194 | + | implementation | |
| 195 | + | ||
| 196 | + | {$R *.lfm} | |
| 197 | + | ||
| 198 | + | end. | |
| 199 | + | ``` | |
| 200 | + | ||
| 201 | + | ### Unit1.lfm (vertical bars) | |
| 202 | + | ||
| 203 | + | ``` pascal | |
| 204 | + | object Form1: TForm1 | |
| 205 | + | Left = 381 | |
| 206 | + | Height = 272 | |
| 207 | + | Top = 444 | |
| 208 | + | Width = 429 | |
| 209 | + | Caption = 'Form1' | |
| 210 | + | ClientHeight = 272 | |
| 211 | + | ClientWidth = 429 | |
| 212 | + | LCLVersion = '1.3' | |
| 213 | + | object Chart1: TChart | |
| 214 | + | Left = 0 | |
| 215 | + | Height = 272 | |
| 216 | + | Top = 0 | |
| 217 | + | Width = 384 | |
| 218 | + | AxisList = < | |
| 219 | + | item | |
| 220 | + | Minors = <> | |
| 221 | + | Title.LabelFont.Orientation = 900 | |
| 222 | + | end | |
| 223 | + | item | |
| 224 | + | Grid.Visible = False | |
| 225 | + | TickLength = 0 | |
| 226 | + | Alignment = calBottom | |
| 227 | + | Marks.Format = '%2:s' | |
| 228 | + | Marks.Source = LabelsChartSource | |
| 229 | + | Marks.Style = smsLabel | |
| 230 | + | Minors = < | |
| 231 | + | item | |
| 232 | + | Intervals.Count = 1 | |
| 233 | + | Intervals.MinLength = 5 | |
| 234 | + | Intervals.Options = [aipUseCount, aipUseMinLength] | |
| 235 | + | TickLength = 4 | |
| 236 | + | end> | |
| 237 | + | end> | |
| 238 | + | Foot.Brush.Color = clBtnFace | |
| 239 | + | Foot.Font.Color = clBlue | |
| 240 | + | Legend.Visible = True | |
| 241 | + | Margins.Bottom = 0 | |
| 242 | + | Title.Brush.Color = clBtnFace | |
| 243 | + | Title.Font.Color = clBlue | |
| 244 | + | Title.Text.Strings = ( | |
| 245 | + | 'TAChart' | |
| 246 | + | ) | |
| 247 | + | ParentColor = False | |
| 248 | + | object RedBarSeries: TBarSeries | |
| 249 | + | Title = 'red' | |
| 250 | + | BarBrush.Color = clRed | |
| 251 | + | BarOffsetPercent = -25 | |
| 252 | + | BarWidthPercent = 25 | |
| 253 | + | Source = RedChartSource | |
| 254 | + | end | |
| 255 | + | object BlueBarSeries: TBarSeries | |
| 256 | + | Title = 'blue' | |
| 257 | + | BarBrush.Color = clBlue | |
| 258 | + | BarWidthPercent = 25 | |
| 259 | + | Source = BlueChartSource | |
| 260 | + | end | |
| 261 | + | object YellowBarSeries: TBarSeries | |
| 262 | + | Title = 'yellow' | |
| 263 | + | BarBrush.Color = clYellow | |
| 264 | + | BarOffsetPercent = 25 | |
| 265 | + | BarWidthPercent = 25 | |
| 266 | + | Source = YellowChartSource | |
| 267 | + | end | |
| 268 | + | end | |
| 269 | + | object RedChartSource: TRandomChartSource | |
| 270 | + | PointsNumber = 4 | |
| 271 | + | RandSeed = 1 | |
| 272 | + | XMax = 4 | |
| 273 | + | XMin = 1 | |
| 274 | + | YMax = 100 | |
| 275 | + | YMin = 0 | |
| 276 | + | left = 360 | |
| 277 | + | top = 72 | |
| 278 | + | end | |
| 279 | + | object BlueChartSource: TRandomChartSource | |
| 280 | + | PointsNumber = 4 | |
| 281 | + | RandSeed = 2 | |
| 282 | + | XMax = 4 | |
| 283 | + | XMin = 1 | |
| 284 | + | YMax = 100 | |
| 285 | + | YMin = 0 | |
| 286 | + | left = 360 | |
| 287 | + | top = 120 | |
| 288 | + | end | |
| 289 | + | object YellowChartSource: TRandomChartSource | |
| 290 | + | PointsNumber = 4 | |
| 291 | + | RandSeed = 3 | |
| 292 | + | XMax = 4 | |
| 293 | + | XMin = 1 | |
| 294 | + | YMax = 100 | |
| 295 | + | YMin = 0 | |
| 296 | + | left = 360 | |
| 297 | + | top = 168 | |
| 298 | + | end | |
| 299 | + | object LabelsChartSource: TListChartSource | |
| 300 | + | DataPoints.Strings = ( | |
| 301 | + | '1|1|?|Q1' | |
| 302 | + | '2|2|?|Q2' | |
| 303 | + | '3|3|?|Q3' | |
| 304 | + | '4|4|?|Q4' | |
| 305 | + | ) | |
| 306 | + | left = 361 | |
| 307 | + | top = 220 | |
| 308 | + | end | |
| 309 | + | end | |
| 310 | + | ``` | |
| 311 | + | ||
| 312 | + | ### Unit1.lfm (horizontal bars) | |
| 313 | + | ||
| 314 | + | ``` pascal | |
| 315 | + | object Form1: TForm1 | |
| 316 | + | Left = 381 | |
| 317 | + | Height = 272 | |
| 318 | + | Top = 444 | |
| 319 | + | Width = 429 | |
| 320 | + | Caption = 'Form1' | |
| 321 | + | ClientHeight = 272 | |
| 322 | + | ClientWidth = 429 | |
| 323 | + | LCLVersion = '1.3' | |
| 324 | + | object Chart1: TChart | |
| 325 | + | Left = 0 | |
| 326 | + | Height = 272 | |
| 327 | + | Top = 0 | |
| 328 | + | Width = 384 | |
| 329 | + | AxisList = < | |
| 330 | + | item | |
| 331 | + | Grid.Visible = False | |
| 332 | + | TickLength = 0 | |
| 333 | + | Marks.Format = '%2:s' | |
| 334 | + | Marks.Source = LabelsChartSource | |
| 335 | + | Marks.Style = smsLabel | |
| 336 | + | Minors = < | |
| 337 | + | item | |
| 338 | + | Intervals.Count = 1 | |
| 339 | + | Intervals.MinLength = 5 | |
| 340 | + | Intervals.Options = [aipUseCount, aipUseMinLength] | |
| 341 | + | TickLength = 4 | |
| 342 | + | end> | |
| 343 | + | Title.LabelFont.Orientation = 900 | |
| 344 | + | end | |
| 345 | + | item | |
| 346 | + | Alignment = calBottom | |
| 347 | + | Minors = <> | |
| 348 | + | end> | |
| 349 | + | Foot.Brush.Color = clBtnFace | |
| 350 | + | Foot.Font.Color = clBlue | |
| 351 | + | Legend.Visible = True | |
| 352 | + | Margins.Bottom = 0 | |
| 353 | + | Title.Brush.Color = clBtnFace | |
| 354 | + | Title.Font.Color = clBlue | |
| 355 | + | Title.Text.Strings = ( | |
| 356 | + | 'TAChart' | |
| 357 | + | ) | |
| 358 | + | ParentColor = False | |
| 359 | + | object RedBarSeries: TBarSeries | |
| 360 | + | Title = 'red' | |
| 361 | + | AxisIndexX = 0 | |
| 362 | + | AxisIndexY = 1 | |
| 363 | + | BarBrush.Color = clRed | |
| 364 | + | BarOffsetPercent = -25 | |
| 365 | + | BarWidthPercent = 25 | |
| 366 | + | Source = RedChartSource | |
| 367 | + | end | |
| 368 | + | object BlueBarSeries: TBarSeries | |
| 369 | + | Title = 'blue' | |
| 370 | + | AxisIndexX = 0 | |
| 371 | + | AxisIndexY = 1 | |
| 372 | + | BarBrush.Color = clBlue | |
| 373 | + | BarWidthPercent = 25 | |
| 374 | + | Source = BlueChartSource | |
| 375 | + | end | |
| 376 | + | object YellowBarSeries: TBarSeries | |
| 377 | + | Title = 'yellow' | |
| 378 | + | AxisIndexX = 0 | |
| 379 | + | AxisIndexY = 1 | |
| 380 | + | BarBrush.Color = clYellow | |
| 381 | + | BarOffsetPercent = 25 | |
| 382 | + | BarWidthPercent = 25 | |
| 383 | + | Source = YellowChartSource | |
| 384 | + | end | |
| 385 | + | end | |
| 386 | + | object RedChartSource: TRandomChartSource | |
| 387 | + | PointsNumber = 4 | |
| 388 | + | RandSeed = 1 | |
| 389 | + | XMax = 4 | |
| 390 | + | XMin = 1 | |
| 391 | + | YMax = 100 | |
| 392 | + | YMin = 0 | |
| 393 | + | left = 360 | |
| 394 | + | top = 72 | |
| 395 | + | end | |
| 396 | + | object BlueChartSource: TRandomChartSource | |
| 397 | + | PointsNumber = 4 | |
| 398 | + | RandSeed = 2 | |
| 399 | + | XMax = 4 | |
| 400 | + | XMin = 1 | |
| 401 | + | YMax = 100 | |
| 402 | + | YMin = 0 | |
| 403 | + | left = 360 | |
| 404 | + | top = 120 | |
| 405 | + | end | |
| 406 | + | object YellowChartSource: TRandomChartSource | |
| 407 | + | PointsNumber = 4 | |
| 408 | + | RandSeed = 3 | |
| 409 | + | XMax = 4 | |
| 410 | + | XMin = 1 | |
| 411 | + | YMax = 100 | |
| 412 | + | YMin = 0 | |
| 413 | + | left = 360 | |
| 414 | + | top = 168 | |
| 415 | + | end | |
| 416 | + | object LabelsChartSource: TListChartSource | |
| 417 | + | DataPoints.Strings = ( | |
| 418 | + | '1|1|?|Q1' | |
| 419 | + | '2|2|?|Q2' | |
| 420 | + | '3|3|?|Q3' | |
| 421 | + | '4|4|?|Q4' | |
| 422 | + | ) | |
| 423 | + | left = 361 | |
| 424 | + | top = 220 | |
| 425 | + | end | |
| 426 | + | end | |
| 427 | + | ``` | |
| 428 | + | ||
| 429 | + | --- | |
| 430 | + | *From the Free Pascal wiki, page "TAChart Tutorial: BarSeries", as it stood on 2022-12-30 after a change by Wp, out of the wiki's dump of 2024-05-26. Copyright stays with the author who wrote it, according to the old wiki's [[Licensing]] page. If you have concerns about this material, [message the admin](/wiki-contact).* |