

TAChart Tutorial: Background design: what changed
Revision 0 to 1. Removed lines have a minus sign; added lines have a plus sign.
Title: TAChart Tutorial: Background design
| Old | New | Line | |
|---|---|---|---|
| 1 | + | ## Introduction | |
| 2 | + | ||
| 3 | + | 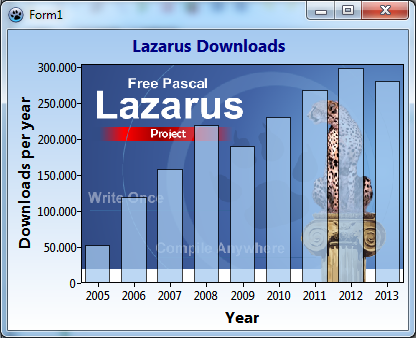 | |
| 4 | + | ||
| 5 | + | Standard charts created by the TAChart package have a gray background. Using the `Color` property it is possibly to modify the color of the entire chart background, and the `BackColor` controls the color of the chart area enclosed by the axes, the so-called "back wall". In any case, the design is quite conventional compared to other charting packages and applications. Is it possible to give the chart background a more interesting design? | |
| 6 | + | ||
| 7 | + | In this tutorial, we will demonstrate that this is a relatively easy task by taking advantage of one or two events of TChart. We will create a plot charting changes in the number of Lazarus downloads per year over recent years. To highlight the connection with Lazarus we plan to show the Lazarus splash screen as a background image of the chart. | |
| 8 | + | ||
| 9 | + | ## Preparation | |
| 10 | + | ||
| 11 | + | ### Data | |
| 12 | + | ||
| 13 | + | Sourceforge provides a list of the Lazarus download counts per month. From <http://sourceforge.net/projects/lazarus/files/Lazarus%20Windows%2032%20bits/stats/timeline?dates=2003-01-01+to+2014-09-02> I extracted the download count per year for the windows-32 installation file: | |
| 14 | + | ||
| 15 | + | | Year | 2005 | 2006 | 2007 | 2008 | 2009 | 2010 | 2011 | 2012 | 2013 | | |
| 16 | + | |-----------|-------|--------|--------|--------|--------|--------|--------|--------|--------| | |
| 17 | + | | Downloads | 53299 | 119613 | 158060 | 218915 | 190567 | 230108 | 267858 | 298335 | 280586 | | |
| 18 | + | ||
| 19 | + | These data will be basis of our chart. | |
| 20 | + | ||
| 21 | + | ### Setting up the chart | |
| 22 | + | ||
| 23 | + | Create a new project and add a `TChart` to the form. Client-align it such that the chart fills the entire form. Drag the form borders such that the window is about 400 pixels wide and 300 pixels high. | |
| 24 | + | ||
| 25 | + | We will plot the "Years" along the `x` axis, and the "Download count" along the `y` axis of the chart. Therefore, go to bottom axis, find the property `Title` and enter "Years" in the field for `Caption`. Show the title by setting its property `Visible` to `true`. Adapt other properties to your liking: I often prefer to have the title in bold font and larger size (12). And sometimes the grid is annoying, you can turn if off by setting the `Visible` property of the axis' `Grid` to `false`. Repeat with the vertical axis, the title should be named "Downloads per year". | |
| 26 | + | ||
| 27 | + | We should also show a title above the chart. Select the text "Lazarus downloads" for the `Text` of the chart's `Title`. Again, set the property `Visible` to `true` in order to show the title. You may also want to switch the title font to bold and increase its size a bit. | |
| 28 | + | ||
| 29 | + | 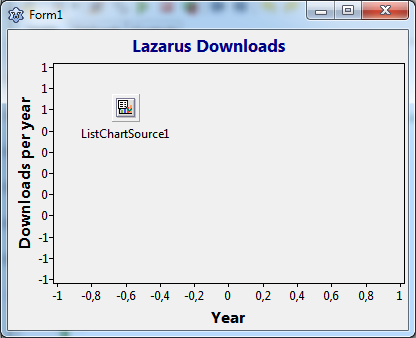 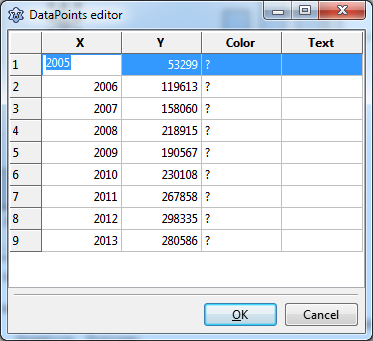 | |
| 30 | + | ||
| 31 | + | A good series type for time-series data is a bar series. At first we add a `TBarSeries` to the chart: Double-click on the chart to open the series editor, click "Add" and select "Bar series" from the dropdown list. We do not see the series because it has no data yet. | |
| 32 | + | ||
| 33 | + | There are various ways to assign data to the series. Since we have static data which do not change during the program it is convenient to use a `TListSource` which provides a datapoint editor for entering data at design-time. You find the ListChartSource in the "Chart" component palette, it is the second icon. In order to enter data click on the ellipsis button next to the property `DataPoints` of the component - this opens the DataPoints editor. Enter the data from the table above into the editor grid: the "year" goes into the "X" column, the "downloads" go into the "Y" column. There is no need to enter anything into the "Color" and "Text" columns. | |
| 34 | + | ||
| 35 | + | Finally, we connect the ListChartSource to the BarSeries. Each series has a property `Source`. Click on the dropdown arrow and select the ListChartSource from the list. Immediately the bar chart shows up. | |
| 36 | + | ||
| 37 | + | 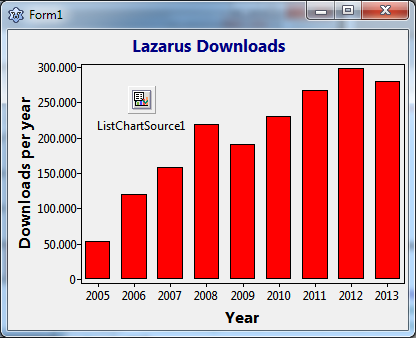 | |
| 38 | + | ||
| 39 | + | ## The TChart painting events | |
| 40 | + | ||
| 41 | + | So far, the project has been standard. Now let's intercept the drawing process... | |
| 42 | + | ||
| 43 | + | `TChart` offers several events where our own code can be hooked in: | |
| 44 | + | ||
| 45 | + | - At the beginning of the drawing pipeline there is `OnChartPaint`. This event is marked as experimental and can only be reached from code, not from the object inspector. It fires before anything is drawn by the chart and offers a `var` parameter `ADoDefaultDrawing`. Setting this one to `false`, therefore, by-passes the entire built-in drawing process and allows to paint the chart completely on your own. A very exciting feature, but too drastic for our purpose... | |
| 46 | + | - The next event happens before the background of the entire chart is drawn: `OnBeforeDrawBackground`. It, again, has the `ADoDefaultDrawing` parameter. If we set it to `false` we can replace the background drawn by the chart by our own procedures. Very good for our purpose. If left at `true` the chart will paint its standard background that we can control by the object inspector. | |
| 47 | + | - After the background has been painted - either the default or the custom one - there is another event, `OnAfterDrawBackground`. It can be used to paint something on the background which is always underneath the series or axes which are painted later. | |
| 48 | + | - Still in the very early stages, we have the `OnBeforeDrawBackwall` event. It fires before the area enclosed by the axis rectangle ("back wall") is filled by its background color/pattern. Taking advantage of the `ADoDefaultDrawing` parameter again we can replace the back wall by our own procedure. Exactly what we need! | |
| 49 | + | - Then the chart paints the titles, the axes, the grid, the series, and the legend. Unfortunately, there are no events to intercept their painting (except for the legend which provides an `OnDrawLegend` event). But we do have some control of the drawing process within a group of chart elements by means of the their `ZPosition` property. If, for example, you have a chart with a bar and a line series and do not want the line series to be partly covered by the bars you have to give the line series a greater `ZPosition` than the bar series - the element with the larger `ZPosition` is drawn later, i.e. on top of the element with the smaller `ZPosition`. | |
| 50 | + | - Only at the very end of the drawing process there is another event, `OnAfterDraw`. It is usually intended for administrative purposes, for example measuring the painting time by reading a clock that was started in the `OnChartPaint` event. | |
| 51 | + | ||
| 52 | + | ### Showing the background image | |
| 53 | + | ||
| 54 | + | The Lazarus logo makes a nice background for our chart of Lazarus download counts. We want to paint it in the chart area enclosed by the axis, the back wall. As you saw above in the listing of chart event there is an event which perfectly fits our need: `OnBeforeDrawBackwall`. | |
| 55 | + | ||
| 56 | + | At first we have to make the logo available to the program. The logo file has the name "splash_logo.png" and can be found in the folder "images" of your Lazarus installation. For simplicity, copy it to the folder which will hold the exe file of our project (or use the full file path in the code below). Since the logo is a png file we need an instance of a TPortableNetworkGraphic, or - which is more flexible - a TPicture. Let's declare a variable `FBackImage` of the latter type to the form and add code in the form's OnCreate event to load the image file. Of course, don't forget to free the image when the program closes: | |
| 57 | + | ||
| 58 | + | ``` pascal | |
| 59 | + | type | |
| 60 | + | TForm1 = class(TForm) | |
| 61 | + | ... | |
| 62 | + | private | |
| 63 | + | FBackImage: TPicture; | |
| 64 | + | ... | |
| 65 | + | ||
| 66 | + | procedure TForm1.FormCreate(Sender: TObject); | |
| 67 | + | begin | |
| 68 | + | FBackImage := TPicture.Create; | |
| 69 | + | FBackImage.LoadFromFile('splash_logo.png'); | |
| 70 | + | // or: FBackImage.LoadFromFile('c:\lazarus\images\splash_logo.png'); | |
| 71 | + | end; | |
| 72 | + | ||
| 73 | + | procedure TForm1.FormDestroy(Sender: TObject); | |
| 74 | + | begin | |
| 75 | + | FBackImage.Free; | |
| 76 | + | end; | |
| 77 | + | ``` | |
| 78 | + | ||
| 79 | + | Loading the image directly from file requires that the image is distributed along with the exe file. This can be avoided if the image is added as a resource to the binary. For this purpose you have to create a resource file containing the image - see the wiki article .... on how to do that. The Lazarus images folder contains a ready-made resource file with the logo, "splash_logo.res". If you want to use this approach, copy this file to the project folder and use this alternative `OnCreate` code (don't forget to add `{$R splash_logo.res}` at the beginning of the `implemenation` section of the unit): | |
| 80 | + | ||
| 81 | + | ``` pascal | |
| 82 | + | ... | |
| 83 | + | implementation | |
| 84 | + | ||
| 85 | + | {$R *.lfm} | |
| 86 | + | {$R splash_logo.res} | |
| 87 | + | ||
| 88 | + | procedure TForm1.FormCreate(Sender: TObject); | |
| 89 | + | begin | |
| 90 | + | FBackImage := TPicture.Create; | |
| 91 | + | FBackImage.LoadFromResourceName(HInstance, 'splash_logo'); | |
| 92 | + | end; | |
| 93 | + | ``` | |
| 94 | + | ||
| 95 | + | Whichever method you decide to use - now it's the time to add code to the `OnBeforeDrawBackwall` event of the chart. It is very simple: we just "stretch-draw" the image on the canvas into the rectangle provided as a parameter, and - of course - we set the `ADeDefaultDrawing` to `false` to by-pass the default painting method. It is important that you draw on the canvas provided as a parameter, not on the chart's canvas, because painting of the chart is executed by special backend classes which can provide different canvases, for example, if the chart is to be printed. | |
| 96 | + | ||
| 97 | + | ``` pascal | |
| 98 | + | procedure TForm1.Chart1BeforeDrawBackWall(ASender: TChart; ACanvas: TCanvas; | |
| 99 | + | const ARect: TRect; var ADoDefaultDrawing: Boolean); | |
| 100 | + | begin | |
| 101 | + | ACanvas.StretchDraw(ARect, FBackImage.Graphic); | |
| 102 | + | ADoDefaultDrawing := false; | |
| 103 | + | end; | |
| 104 | + | ``` | |
| 105 | + | ||
| 106 | + | Because the event handler is run-time code you have to compile the program to see the current state of the chart: | |
| 107 | + | ||
| 108 | + | 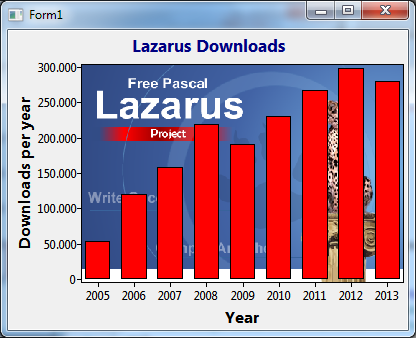 | |
| 109 | + | ||
| 110 | + | ### Showing a background gradient | |
| 111 | + | ||
| 112 | + | In the outer region of the chart we still see the famous gray background. How about replacing it by a decent gradient? From the predominant blue colors of the Lazarus logo we could select a vertical transition from bright blue (`clSkyBlue`) at the top to white a the bottom. | |
| 113 | + | ||
| 114 | + | We know from the summary of painting events that the `OnBeforeDrawBackground` is the right event which we can use to draw the chart background on our own. But how to paint a gradient? Very easy: the canvas has a method `GradientFill` which accepts start and end colors and the gradient direction. | |
| 115 | + | ||
| 116 | + | ``` pascal | |
| 117 | + | procedure TForm1.Chart1BeforeDrawBackground(ASender: TChart; ACanvas: TCanvas; | |
| 118 | + | const ARect: TRect; var ADoDefaultDrawing: Boolean); | |
| 119 | + | begin | |
| 120 | + | ACanvas.GradientFill(ARect, clSkyBlue, clWhite, gdVertical); | |
| 121 | + | ADoDefaultDrawing := false; | |
| 122 | + | end; | |
| 123 | + | ``` | |
| 124 | + | ||
| 125 | + | 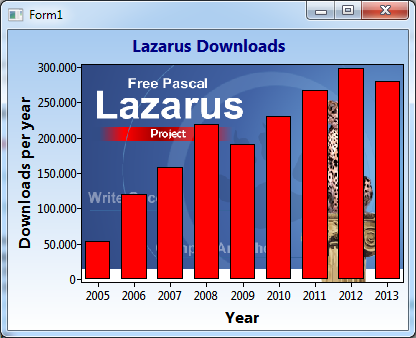 | |
| 126 | + | ||
| 127 | + | ### A note on Lazarus version 1.9 or newer | |
| 128 | + | ||
| 129 | + | If you have Lazarus version 1.9 or newer you many notice that the events `OnBeforeDrawBackground` and `OnBeforeDrawBackWall` are marked as deprecated, it is recommended to use `OnBeforeCustomDrawBackground` and `OnBeforeCustomDrawBackWall`. This was introduced because the new events support the TAChart drawing backend architecture which enables drawing on devices which do not have an LCL-compatible canvas (e.g. an OpenGL rendering context, or an SVG file). A chart drawer essentially provides the same commands as TCanvas, however, some differences exist here and there - unfortunately also in drawing of images and gradients: Images are requested as descendants of TFPCustomImage. And gradients are not supported at all, but may be provided after painting on an auxiliary bitmap. | |
| 130 | + | ||
| 131 | + | Here is the code which works for the `OnBeforeCustomDrawBackWall` event: | |
| 132 | + | ||
| 133 | + | ``` pascal | |
| 134 | + | procedure TForm1.Chart1BeforeCustomDrawBackWall(ASender: TChart; | |
| 135 | + | ADrawer: IChartDrawer; const ARect: TRect; var ADoDefaultDrawing: Boolean); | |
| 136 | + | var | |
| 137 | + | bmp: TBitmap; | |
| 138 | + | img: TLazIntfImage; | |
| 139 | + | begin | |
| 140 | + | img := TLazIntfImage.Create(0, 0); | |
| 141 | + | try | |
| 142 | + | bmp := TBitmap.Create; | |
| 143 | + | try | |
| 144 | + | bmp.SetSize(ARect.Right - ARect.Left, ARect.Bottom - ARect.Top); | |
| 145 | + | bmp.Canvas.StretchDraw(Rect(0, 0, bmp.Width, bmp.Height), FBackImage.Graphic); | |
| 146 | + | img.LoadFromBitmap(bmp.Handle, bmp.MaskHandle); | |
| 147 | + | finally | |
| 148 | + | bmp.Free; | |
| 149 | + | end; | |
| 150 | + | ADrawer.PutImage(ARect.Left, ARect.Top, img); | |
| 151 | + | ADoDefaultDrawing := false; | |
| 152 | + | finally | |
| 153 | + | img.Free; | |
| 154 | + | end; | |
| 155 | + | end; | |
| 156 | + | ``` | |
| 157 | + | ||
| 158 | + | The image painting command of the drawer is `PutImage`. It gets the image as a `TLazIntfImage` which, unlike TBitmap, is a descendant of TFPCustomImage. The originally loaded picture is stretch-drawn onto an auxiliary bitmap because the drawer does not support this operation. This auxiliary bitmap, finally is passed to the `LazIntfImage` via its method `LoadFromBitmap`. | |
| 159 | + | ||
| 160 | + | The `OnBeforeCustomDrawBackground` event handler follows the same principle. But now the auxiliary bitmap is painted with the gradient requested. | |
| 161 | + | ||
| 162 | + | ``` pascal | |
| 163 | + | procedure TForm1.Chart1BeforeCustomDrawBackground(ASender: TChart; | |
| 164 | + | ADrawer: IChartDrawer; const ARect: TRect; var ADoDefaultDrawing: Boolean); | |
| 165 | + | var | |
| 166 | + | bmp: TBitmap; | |
| 167 | + | img: TLazIntfImage; | |
| 168 | + | begin | |
| 169 | + | img := TLazIntfImage.Create(0, 0); | |
| 170 | + | try | |
| 171 | + | bmp := TBitmap.Create; | |
| 172 | + | try | |
| 173 | + | bmp.SetSize(ARect.Right - ARect.Left, ARect.Bottom - ARect.Top); | |
| 174 | + | bmp.Canvas.GradientFill(Rect(0, 0, bmp.Width, bmp.Height), clSkyBlue, clWhite, gdVertical); | |
| 175 | + | img.LoadFromBitmap(bmp.Handle, bmp.MaskHandle); | |
| 176 | + | finally | |
| 177 | + | bmp.Free; | |
| 178 | + | end; | |
| 179 | + | ADrawer.PutImage(ARect.Left, ARect.Top, img); | |
| 180 | + | ADoDefaultDrawing := false; | |
| 181 | + | finally | |
| 182 | + | img.Free; | |
| 183 | + | end; | |
| 184 | + | end; | |
| 185 | + | ``` | |
| 186 | + | ||
| 187 | + | ### Finishing up | |
| 188 | + | ||
| 189 | + | The red bars of the series look a bit "aggressive". How about a more decent sky-blue again? Select the bar series in the object inspector and set the `SeriesColor` to `clSkyBlue`. | |
| 190 | + | ||
| 191 | + | And it would be better to see more of the Lazarus cheetah which is largely covered by the bars. The bar series has a property `Transparency`. The default value, `0`, means opaque, the maximum allowable value, `255` means fully transparent. A low value, such as `64`, adds some transparency to show more details of the cheetah, but does not push the bars too much in the background. | |
| 192 | + | ||
| 193 | + | And this brings us to the chart which is displayed at the top of this page, and to the end of this tutorial. | |
| 194 | + | ||
| 195 | + | ## Summary | |
| 196 | + | ||
| 197 | + | These are the basic steps for **user-painting of chart backgrounds**: | |
| 198 | + | ||
| 199 | + | - Use the **`OnBeforeDrawBackWall` event** to provide your own painting procedure for the **area enclosed by the axis rectangle**. | |
| 200 | + | - Similarly, the **`OnBeforeDrawBackground` event** for painting of the entire **chart background**. | |
| 201 | + | - In these drawing procedures set **`ADoDefaultDrawing`** to **`false`** in order to call your own painting procedures. | |
| 202 | + | ||
| 203 | + | ## Source code | |
| 204 | + | ||
| 205 | + | The source code of this tutorial project can be found in the folder *tutorials/background* of trunk TAChart installations. | |
| 206 | + | ||
| 207 | + | ### Project file | |
| 208 | + | ||
| 209 | + | ``` pascal | |
| 210 | + | program backimage; | |
| 211 | + | ||
| 212 | + | {$mode objfpc}{$H+} | |
| 213 | + | ||
| 214 | + | uses | |
| 215 | + | {$IFDEF UNIX}{$IFDEF UseCThreads} | |
| 216 | + | cthreads, | |
| 217 | + | {$ENDIF}{$ENDIF} | |
| 218 | + | Interfaces, // this includes the LCL widgetset | |
| 219 | + | Forms, main, tachartlazaruspkg | |
| 220 | + | { you can add units after this }; | |
| 221 | + | ||
| 222 | + | {$R *.res} | |
| 223 | + | ||
| 224 | + | begin | |
| 225 | + | RequireDerivedFormResource := True; | |
| 226 | + | Application.Initialize; | |
| 227 | + | Application.CreateForm(TForm1, Form1); | |
| 228 | + | Application.Run; | |
| 229 | + | end. | |
| 230 | + | ``` | |
| 231 | + | ||
| 232 | + | ### Unit `main.pas` | |
| 233 | + | ||
| 234 | + | ``` pascal | |
| 235 | + | unit main; | |
| 236 | + | {$mode objfpc}{$H+} | |
| 237 | + | ||
| 238 | + | interface | |
| 239 | + | ||
| 240 | + | uses | |
| 241 | + | Classes, SysUtils, FileUtil, TAGraph, TASeries, TASources, Forms, Controls, | |
| 242 | + | Graphics, Dialogs; | |
| 243 | + | ||
| 244 | + | type | |
| 245 | + | ||
| 246 | + | { TForm1 } | |
| 247 | + | ||
| 248 | + | TForm1 = class(TForm) | |
| 249 | + | Chart1: TChart; | |
| 250 | + | Chart1BarSeries1: TBarSeries; | |
| 251 | + | ListChartSource1: TListChartSource; | |
| 252 | + | procedure Chart1BeforeDrawBackground(ASender: TChart; ACanvas: TCanvas; | |
| 253 | + | const ARect: TRect; var ADoDefaultDrawing: Boolean); | |
| 254 | + | procedure Chart1BeforeDrawBackWall(ASender: TChart; ACanvas: TCanvas; | |
| 255 | + | const ARect: TRect; var ADoDefaultDrawing: Boolean); | |
| 256 | + | procedure FormCreate(Sender: TObject); | |
| 257 | + | procedure FormDestroy(Sender: TObject); | |
| 258 | + | private | |
| 259 | + | { private declarations } | |
| 260 | + | FBackImage: TPicture; | |
| 261 | + | public | |
| 262 | + | { public declarations } | |
| 263 | + | end; | |
| 264 | + | ||
| 265 | + | var | |
| 266 | + | Form1: TForm1; | |
| 267 | + | ||
| 268 | + | implementation | |
| 269 | + | ||
| 270 | + | {$R *.lfm} | |
| 271 | + | ||
| 272 | + | //{$R splash_logo.res} | |
| 273 | + | ||
| 274 | + | { TForm1 } | |
| 275 | + | ||
| 276 | + | procedure TForm1.FormCreate(Sender: TObject); | |
| 277 | + | begin | |
| 278 | + | FBackImage := TPicture.Create; | |
| 279 | + | ||
| 280 | + | FBackImage.LoadFromFile('splash_logo.png'); | |
| 281 | + | // this assumes that the logo is in the same folder as the binary | |
| 282 | + | ||
| 283 | + | // or, using resources: | |
| 284 | + | //FBackImage.LoadFromResourceName(HInstance, 'splash_logo'); | |
| 285 | + | // Don't forget ths {$R directive above... | |
| 286 | + | end; | |
| 287 | + | ||
| 288 | + | procedure TForm1.Chart1BeforeDrawBackWall(ASender: TChart; ACanvas: TCanvas; | |
| 289 | + | const ARect: TRect; var ADoDefaultDrawing: Boolean); | |
| 290 | + | begin | |
| 291 | + | ACanvas.StretchDraw(ARect, FBackImage.Graphic); | |
| 292 | + | ADoDefaultDrawing := false; | |
| 293 | + | end; | |
| 294 | + | ||
| 295 | + | procedure TForm1.Chart1BeforeDrawBackground(ASender: TChart; ACanvas: TCanvas; | |
| 296 | + | const ARect: TRect; var ADoDefaultDrawing: Boolean); | |
| 297 | + | begin | |
| 298 | + | ACanvas.GradientFill(ARect, clSkyBlue, clWhite, gdVertical); | |
| 299 | + | ADoDefaultDrawing := false; | |
| 300 | + | end; | |
| 301 | + | ||
| 302 | + | procedure TForm1.FormDestroy(Sender: TObject); | |
| 303 | + | begin | |
| 304 | + | FBackImage.Free; | |
| 305 | + | end; | |
| 306 | + | ||
| 307 | + | end. | |
| 308 | + | ``` | |
| 309 | + | ||
| 310 | + | ### Form file `main.lfm` | |
| 311 | + | ||
| 312 | + | ``` pascal | |
| 313 | + | object Form1: TForm1 | |
| 314 | + | Left = 340 | |
| 315 | + | Height = 300 | |
| 316 | + | Top = 154 | |
| 317 | + | Width = 400 | |
| 318 | + | Caption = 'Form1' | |
| 319 | + | ClientHeight = 300 | |
| 320 | + | ClientWidth = 400 | |
| 321 | + | OnCreate = FormCreate | |
| 322 | + | OnDestroy = FormDestroy | |
| 323 | + | LCLVersion = '1.3' | |
| 324 | + | object Chart1: TChart | |
| 325 | + | Left = 0 | |
| 326 | + | Height = 300 | |
| 327 | + | Top = 0 | |
| 328 | + | Width = 400 | |
| 329 | + | AxisList = < | |
| 330 | + | item | |
| 331 | + | Grid.Color = clSkyBlue | |
| 332 | + | Grid.Visible = False | |
| 333 | + | Marks.Format = '%.0n' | |
| 334 | + | Marks.Style = smsCustom | |
| 335 | + | Minors = <> | |
| 336 | + | Title.LabelFont.Height = -16 | |
| 337 | + | Title.LabelFont.Orientation = 900 | |
| 338 | + | Title.LabelFont.Style = [fsBold] | |
| 339 | + | Title.Visible = True | |
| 340 | + | Title.Caption = 'Downloads per year' | |
| 341 | + | end | |
| 342 | + | item | |
| 343 | + | Grid.Visible = False | |
| 344 | + | Alignment = calBottom | |
| 345 | + | Minors = <> | |
| 346 | + | Title.LabelFont.Height = -16 | |
| 347 | + | Title.LabelFont.Style = [fsBold] | |
| 348 | + | Title.Visible = True | |
| 349 | + | Title.Caption = 'Year' | |
| 350 | + | end> | |
| 351 | + | Foot.Brush.Color = clBtnFace | |
| 352 | + | Foot.Font.Color = clBlue | |
| 353 | + | Title.Brush.Color = clBtnFace | |
| 354 | + | Title.Brush.Style = bsClear | |
| 355 | + | Title.Font.Color = clNavy | |
| 356 | + | Title.Font.Height = -17 | |
| 357 | + | Title.Font.Style = [fsBold] | |
| 358 | + | Title.Text.Strings = ( | |
| 359 | + | 'Lazarus Downloads' | |
| 360 | + | ) | |
| 361 | + | Title.Visible = True | |
| 362 | + | OnBeforeDrawBackground = Chart1BeforeDrawBackground | |
| 363 | + | OnBeforeDrawBackWall = Chart1BeforeDrawBackWall | |
| 364 | + | Align = alClient | |
| 365 | + | ParentColor = False | |
| 366 | + | object Chart1BarSeries1: TBarSeries | |
| 367 | + | Shadow.Color = clNavy | |
| 368 | + | Shadow.OffsetX = 4 | |
| 369 | + | BarBrush.Color = clSkyBlue | |
| 370 | + | Source = ListChartSource1 | |
| 371 | + | end | |
| 372 | + | end | |
| 373 | + | object ListChartSource1: TListChartSource | |
| 374 | + | DataPoints.Strings = ( | |
| 375 | + | '2005|53299|?|' | |
| 376 | + | '2006|119613|?|' | |
| 377 | + | '2007|158060|?|' | |
| 378 | + | '2008|218915|?|' | |
| 379 | + | '2009|190567|?|' | |
| 380 | + | '2010|230108|?|' | |
| 381 | + | '2011|267858|?|' | |
| 382 | + | '2012|298335|?|' | |
| 383 | + | '2013|280586|?|' | |
| 384 | + | ) | |
| 385 | + | left = 120 | |
| 386 | + | top = 56 | |
| 387 | + | end | |
| 388 | + | end | |
| 389 | + | ``` | |
| 390 | + | ||
| 391 | + | --- | |
| 392 | + | *From the Free Pascal wiki, page "TAChart Tutorial: Background design", as it stood on 2020-02-28 after a change by Trev, out of the wiki's dump of 2024-05-26. Copyright stays with the author who wrote it, according to the old wiki's [[Licensing]] page. If you have concerns about this material, [message the admin](/wiki-contact).* |