

TAChart Demos: what changed
Revision 2 to 3. Removed lines have a minus sign; added lines have a plus sign.
| Old | New | Line | |
|---|---|---|---|
| 1 | 1 | ## Introduction | |
| 2 | 2 | ||
| 3 | 3 | TAChart is Lazarus' powerful charting library. It consists of numerous classes and declarations distributed over some 50 units. New users may be overwhelmed by the complexity of usage, and even experienced charters still find gems from time to time. | |
| 4 | 4 | ||
| 5 | 5 | In order to demonstrate the possibilities of TAChart a variety of demo projects has been written. They are stored in the directory `components/tachart/demo` of the Lazarus installation. However, there is no overview of these examples, and it is often quite cumbersome to find a certain application of interest. Therefore, it is the intention of this wiki page to provide some kind of catalogue of the TAChart demos. Each demo project will be accompanied by a short description and a screen shot of the program output. | |
| 6 | 6 | ||
| 7 | 7 | ## Gallery | |
| 8 | 8 | ||
| 9 | 9 | Click on the **captions** to go to the description of that particular demo project. Click on the **thumbnail** to see the screenshot at normal size. | |
| 10 | 10 | ||
| 11 | - | ||
| 12 | - | ||
| 13 | - | ||
| 14 | - | ||
| 15 | - | ||
| 16 | - | ||
| 17 | - | ||
| 18 | - | ||
| 19 | - | ||
| 20 | - | ||
| 21 | - | ||
| 22 | - | ||
| 23 | - | ||
| 24 | - | ||
| 25 | - | ||
| 26 | - | ||
| 27 | - | ||
| 28 | - | ||
| 29 | - | ||
| 30 | - | ||
| 31 | - | ||
| 32 | - | ||
| 33 | - | ||
| 34 | - | ||
| 35 | - | ||
| 36 | - | ||
| 37 | - | ||
| 38 | - | ||
| 39 | - | ||
| 40 | - | ||
| 41 | - | ||
| 42 | - | ||
| 43 | - | ||
| 44 | - | ||
| 45 | - | ||
| 46 | - | ||
| 47 | - | ||
| 48 | - | ||
| 49 | - | ||
| 50 | - | ||
| 51 | - | ||
| 52 | - | ||
| 53 | - | ||
| 54 | - | ||
| 55 | - | ||
| 56 | - | ||
| 57 | - | ||
| 58 | - | ||
| 59 | - | ||
| 60 | - | ||
| 61 | - | ||
| 62 | - | ||
| 63 | - | ||
| 64 | - | ||
| 65 | - | ||
| 66 | - | ||
| 67 | - | ||
| 68 | - | ||
| 69 | - | ||
| 70 | - | ||
| 71 | - | ||
| 72 | - | ||
| 73 | - | ||
| 74 | - | ||
| 75 | - | ||
| 11 | + | 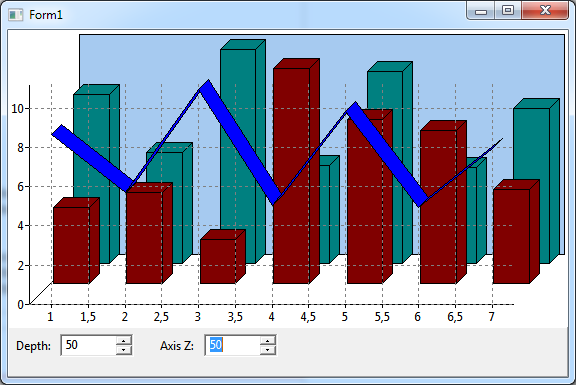 | |
| 76 | 12 | ||
| 13 | + | [[TAChart Demos|3d]] | |
| 14 | + | ||
| 15 | + | 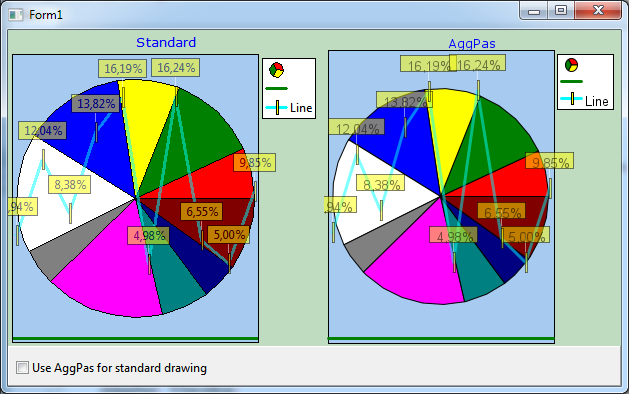 | |
| 16 | + | ||
| 17 | + | [[TAChart Demos|aggpas]] | |
| 18 | + | ||
| 19 | + | 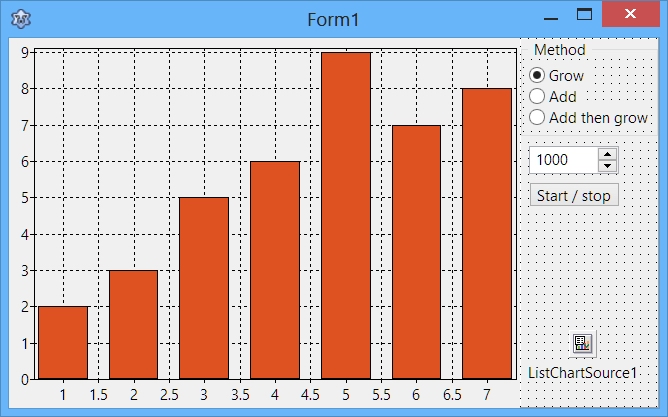 | |
| 20 | + | ||
| 21 | + | [[TAChart Demos|animate]] | |
| 22 | + | ||
| 23 | + | 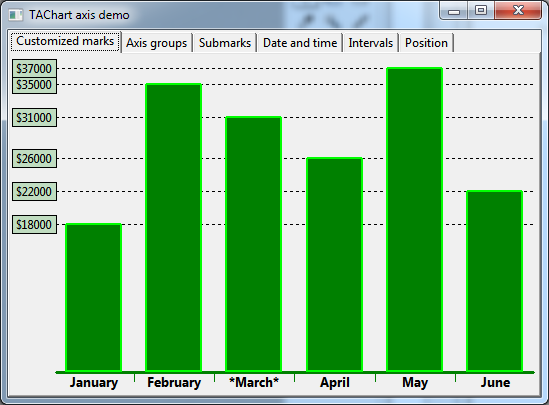 | |
| 24 | + | ||
| 25 | + | [[TAChart Demos|axis (Page "Customized marks")]] | |
| 26 | + | ||
| 27 | + | 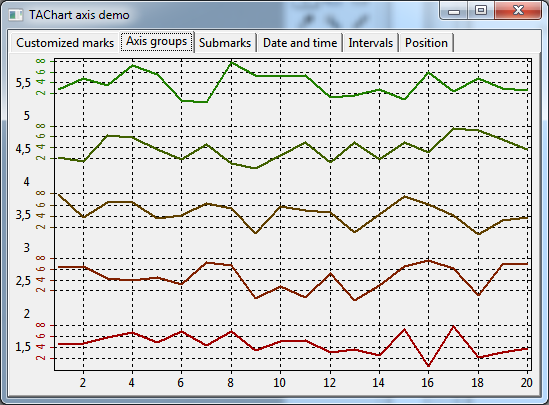 | |
| 28 | + | ||
| 29 | + | [[TAChart Demos|axis (Page "Axis groups")]] | |
| 30 | + | ||
| 31 | + | 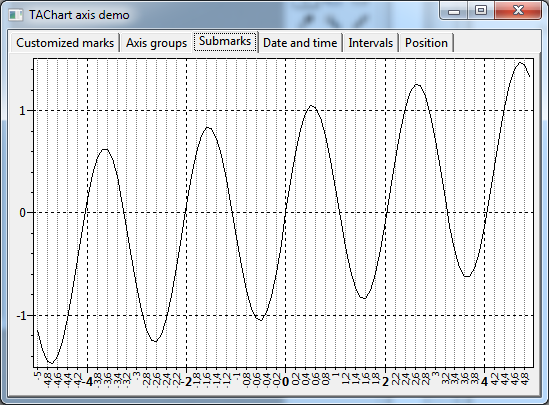 | |
| 32 | + | ||
| 33 | + | [[TAChart Demos|axis (Page "Submarks")]] | |
| 34 | + | ||
| 35 | + | 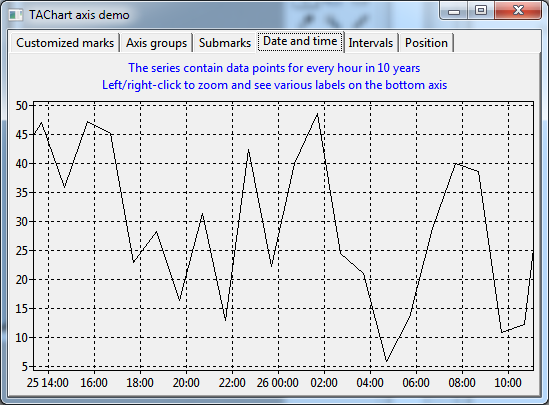 | |
| 36 | + | ||
| 37 | + | [[TAChart Demos|axis (Page "Date and time")]] | |
| 38 | + | ||
| 39 | + | 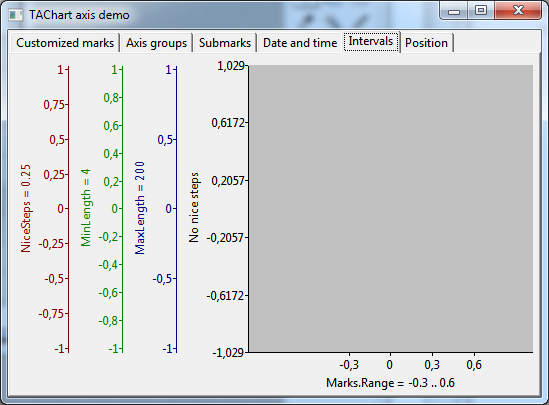 | |
| 40 | + | ||
| 41 | + | [[TAChart Demos|axis (Page "Intervals")]] | |
| 42 | + | ||
| 43 | + | 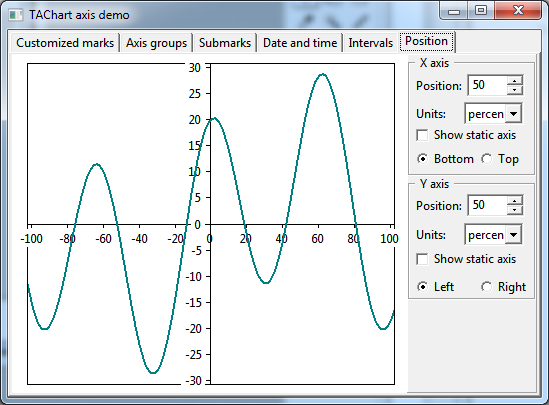 | |
| 44 | + | ||
| 45 | + | [[TAChart Demos|axis (Page "Position")]] | |
| 46 | + | ||
| 47 | + | 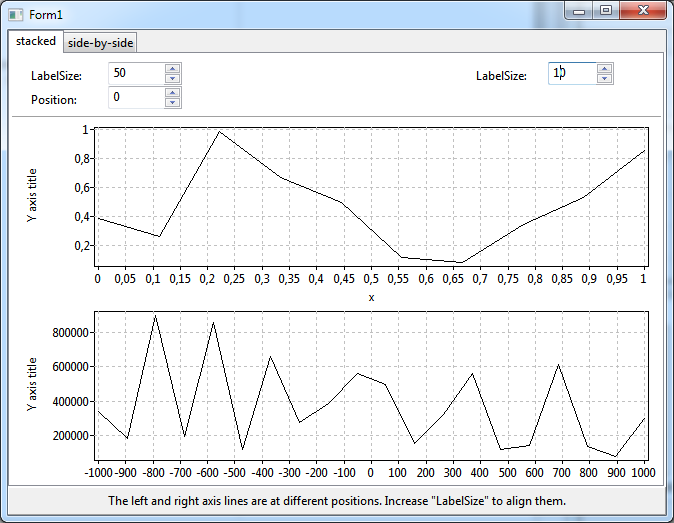 | |
| 48 | + | ||
| 49 | + | [[TAChart Demos|axisalign]] | |
| 50 | + | ||
| 51 | + | 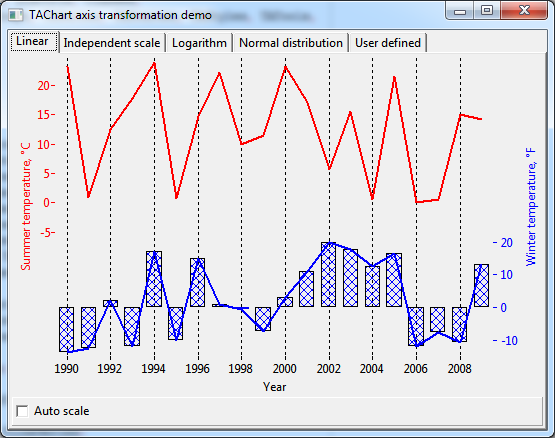 | |
| 52 | + | ||
| 53 | + | [[TAChart Demos|axistransf (Page "Linear")]] | |
| 54 | + | ||
| 55 | + | 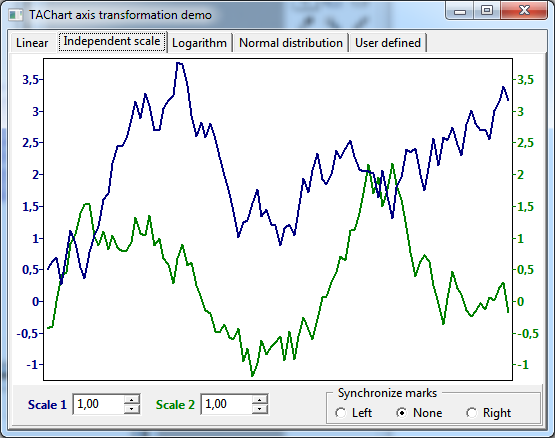 | |
| 56 | + | ||
| 57 | + | [[TAChart Demos|axistransf (Page "Independent scale")]] | |
| 58 | + | ||
| 59 | + | 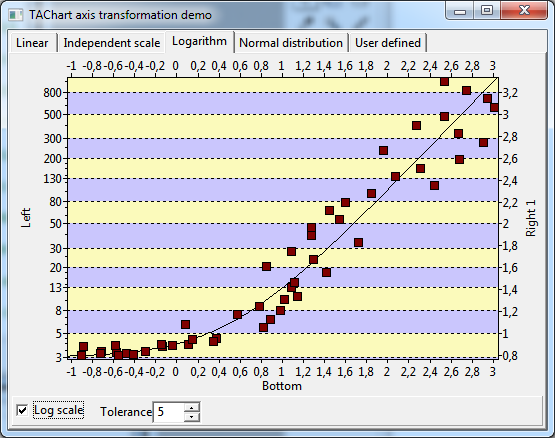 | |
| 60 | + | ||
| 61 | + | [[TAChart Demos|axistransf (Page "Logarithm")]] | |
| 62 | + | ||
| 63 | + | 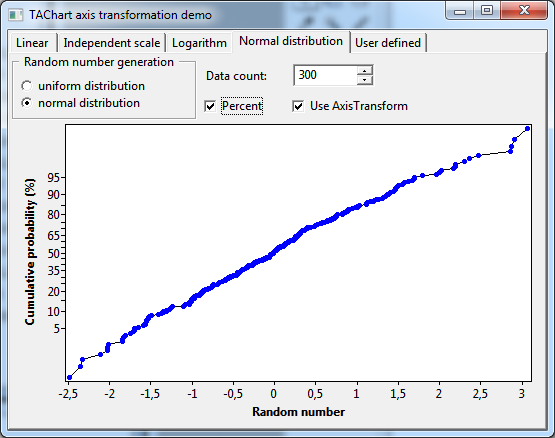 | |
| 64 | + | ||
| 65 | + | [[TAChart Demos|axistransf (Page "Normal distribution")]] | |
| 66 | + | ||
| 67 | + | 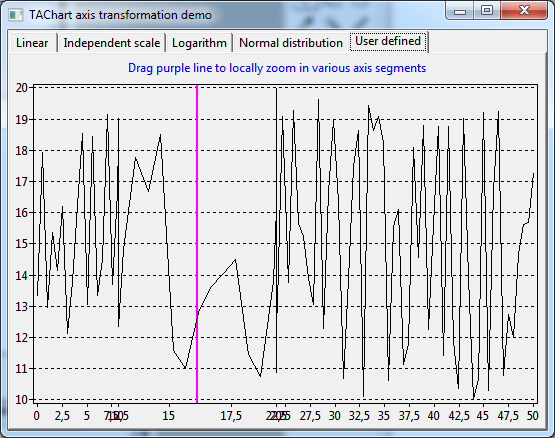 | |
| 68 | + | ||
| 69 | + | [[TAChart Demos|axistransf (Page "User defined")]] | |
| 70 | + | ||
| 71 | + | 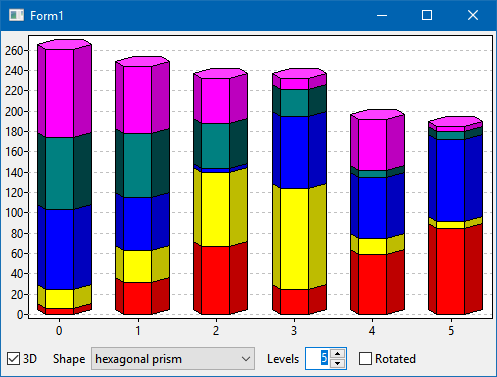 | |
| 72 | + | ||
| 73 | + | [[TAChart Demos|barserieshapes]] | |
| 74 | + | ||
| 75 | + | 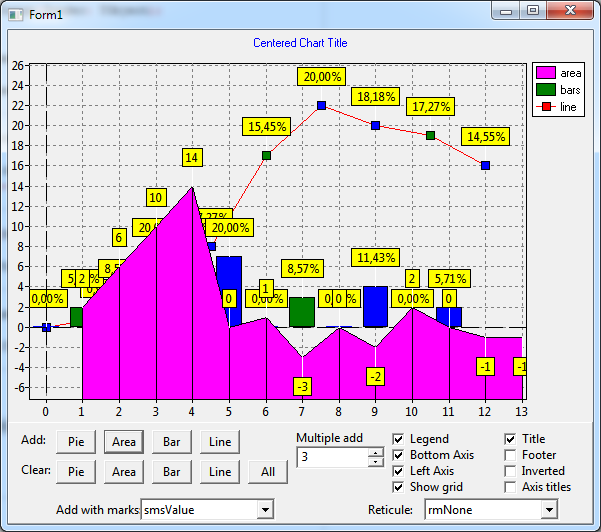 | |
| 76 | + | ||
| 77 | + | [[TAChart Demos|basic]] | |
| 78 | + | ||
| 79 | + | 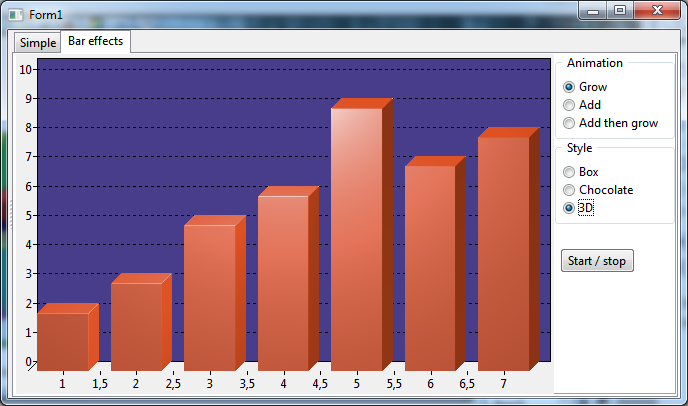 | |
| 80 | + | ||
| 81 | + | [[TAChart Demos|bgra]] | |
| 82 | + | ||
| 83 | + | 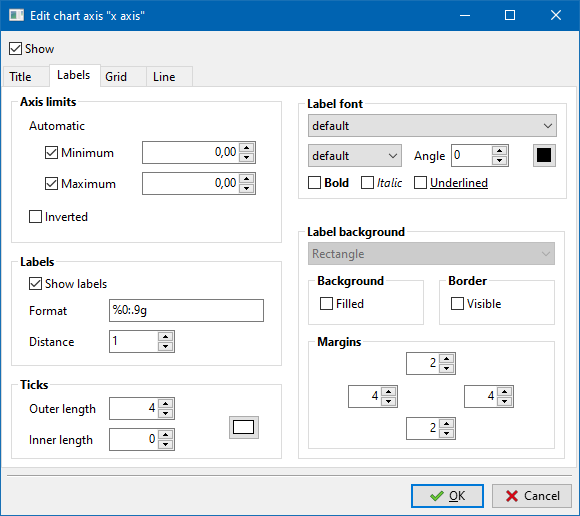 | |
| 84 | + | ||
| 85 | + | [[TAChart Demos|charteditordemo]] | |
| 86 | + | ||
| 87 | + | 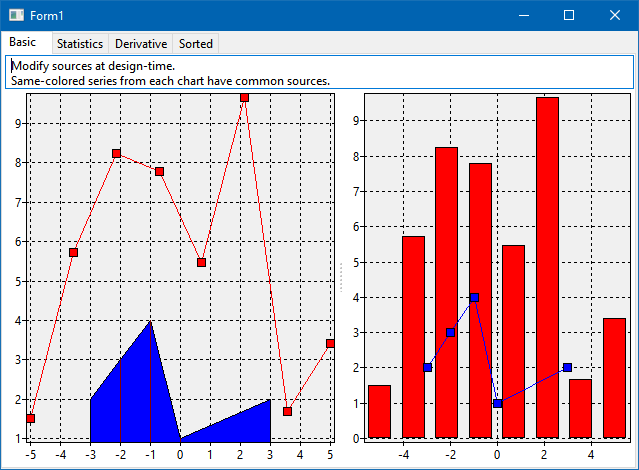 | |
| 88 | + | ||
| 89 | + | [[TAChart Demos|chartsource (Page "Basic")]] | |
| 90 | + | ||
| 91 | + | 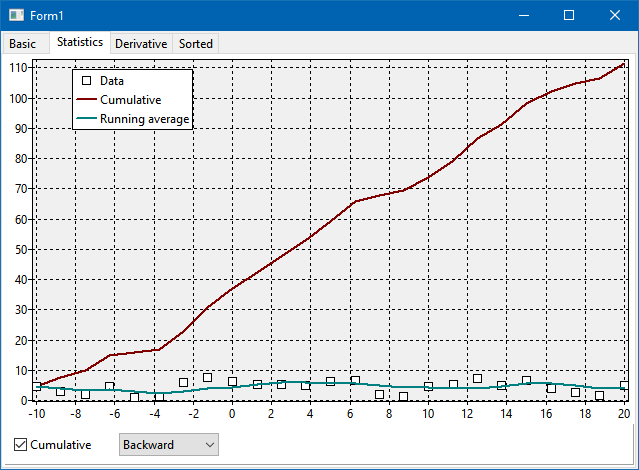 | |
| 92 | + | ||
| 93 | + | [[TAChart Demos|chartsource (Page "Statistics")]] | |
| 94 | + | ||
| 95 | + | 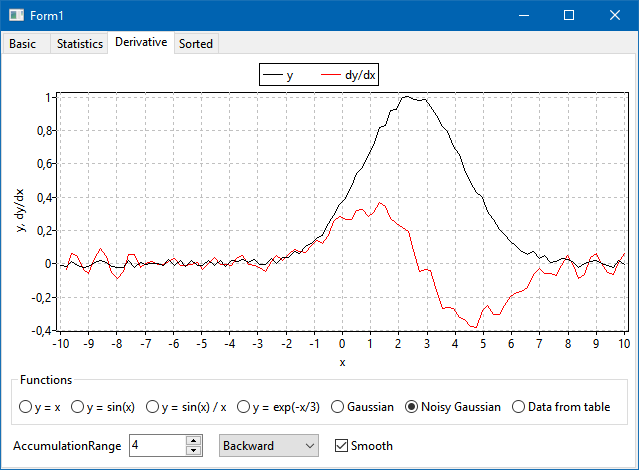 | |
| 96 | + | ||
| 97 | + | [[TAChart Demos|chartsource (Page "Derivative")]] | |
| 98 | + | ||
| 99 | + | 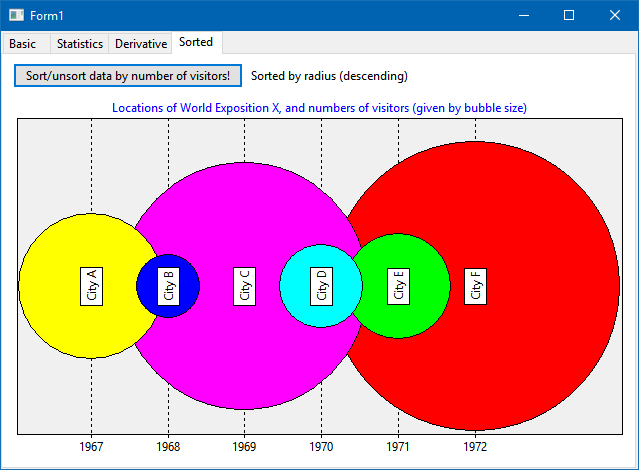 | |
| 100 | + | ||
| 101 | + | [[TAChart Demos|chartsource (Page "Sorting")]] | |
| 102 | + | ||
| 103 | + | 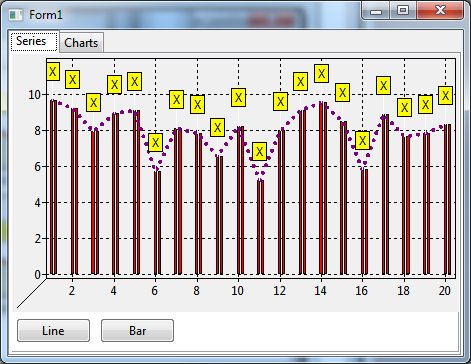 | |
| 104 | + | ||
| 105 | + | [[TAChart Demos|clone (Page "Series")]] | |
| 106 | + | ||
| 107 | + | 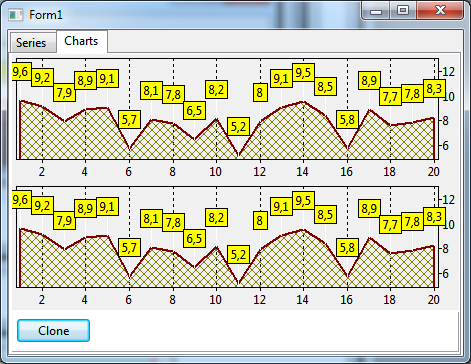 | |
| 108 | + | ||
| 109 | + | [[TAChart Demos|clone (Page "Charts")]] | |
| 110 | + | ||
| 111 | + | 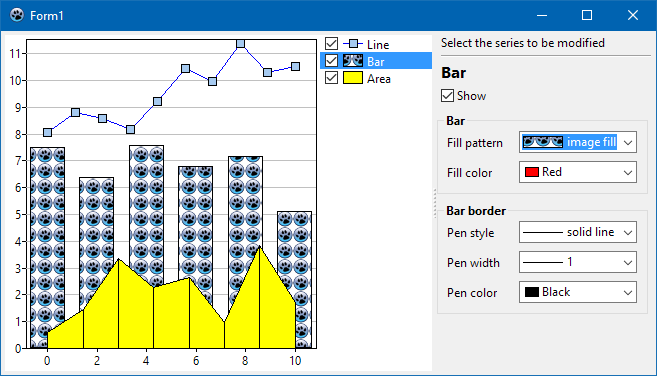 | |
| 112 | + | ||
| 113 | + | [[TAChart Demos|combobox]] | |
| 114 | + | ||
| 115 | + | 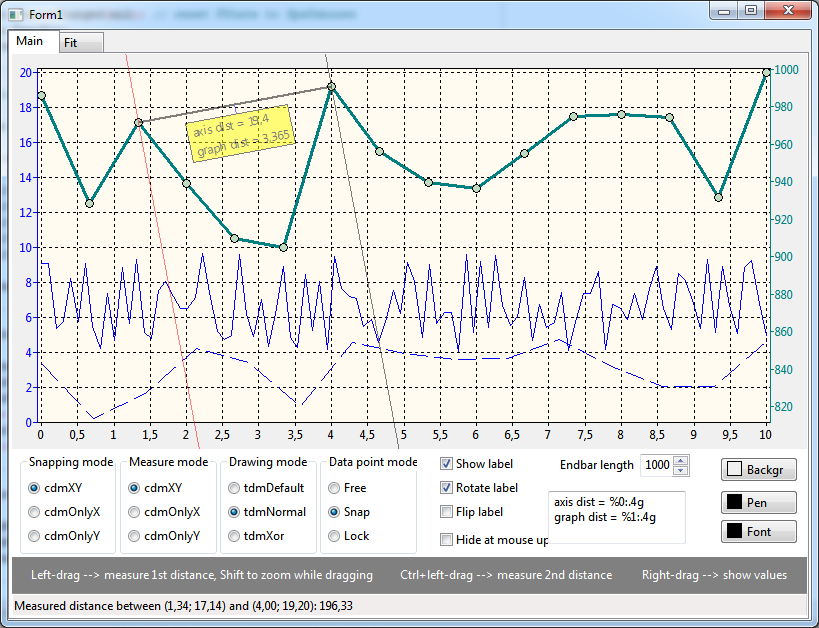 | |
| 116 | + | ||
| 117 | + | [[TAChart Demos|distance (Page "Main")]] | |
| 118 | + | ||
| 119 | + | 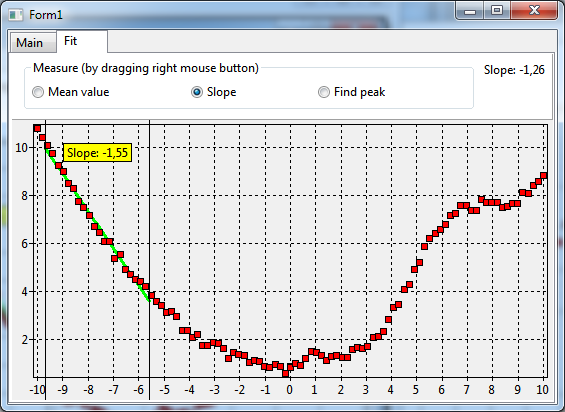 | |
| 120 | + | ||
| 121 | + | [[TAChart Demos|distance (Page "Fit")]] | |
| 122 | + | ||
| 123 | + | 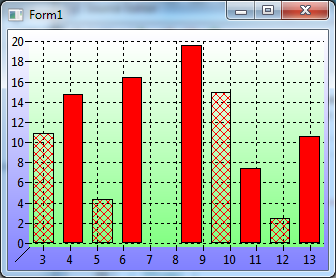 | |
| 124 | + | ||
| 125 | + | [[TAChart Demos|events]] | |
| 126 | + | ||
| 127 | + | 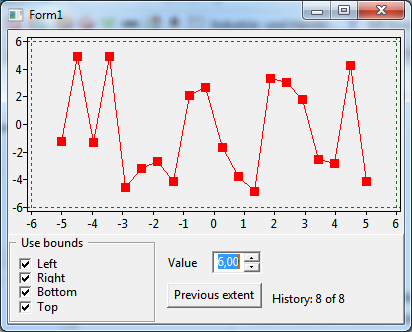 | |
| 128 | + | ||
| 129 | + | [[TAChart Demos|extent]] | |
| 130 | + | ||
| 131 | + | 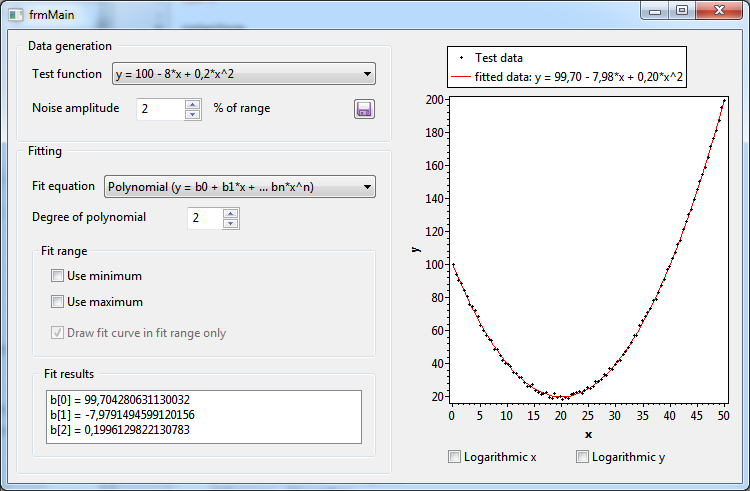 | |
| 132 | + | ||
| 133 | + | [[TAChart Demos|fit]] | |
| 134 | + | ||
| 135 | + | 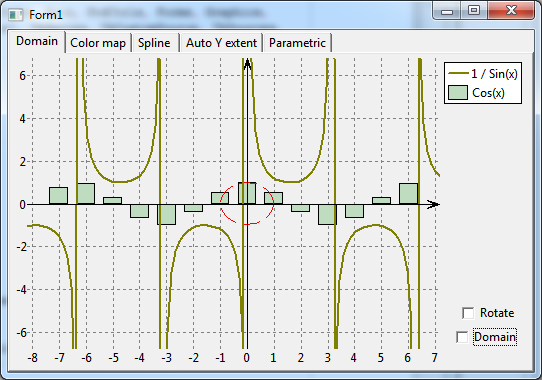 | |
| 136 | + | ||
| 137 | + | [[TAChart Demos|func (Page "Domain")]] | |
| 138 | + | ||
| 139 | + | 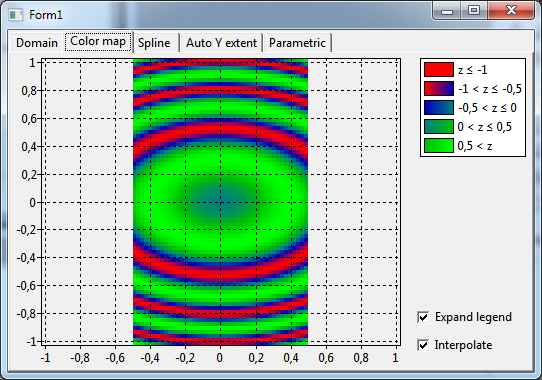 | |
| 140 | + | ||
| 141 | + | [[TAChart Demos|func (Page "Color map")]] | |
| 142 | + | ||
| 143 | + | 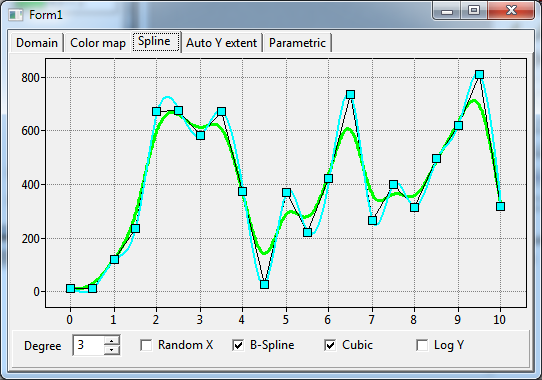 | |
| 144 | + | ||
| 145 | + | [[TAChart Demos|func (Page "Spline")]] | |
| 146 | + | ||
| 147 | + | 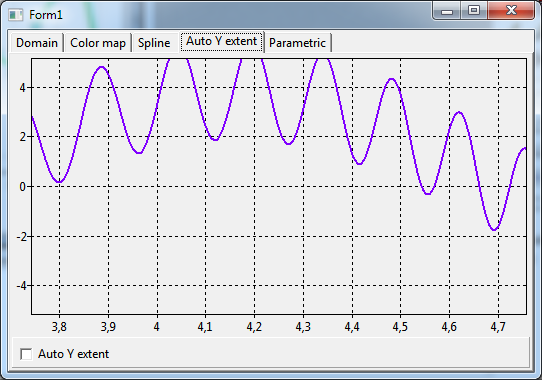 | |
| 148 | + | ||
| 149 | + | [[TAChart Demos|func (Page "Auto y extent")]] | |
| 150 | + | ||
| 151 | + | 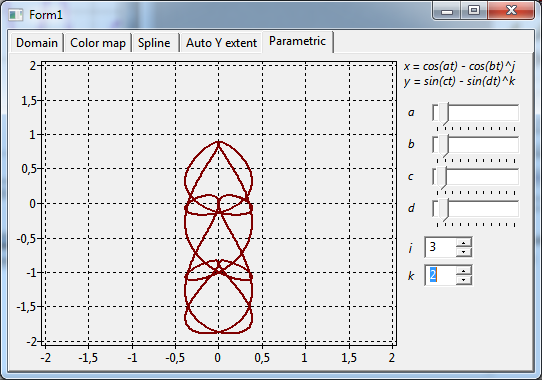 | |
| 152 | + | ||
| 153 | + | [[TAChart Demos|func (Page "Parametric")]] | |
| 154 | + | ||
| 155 | + | 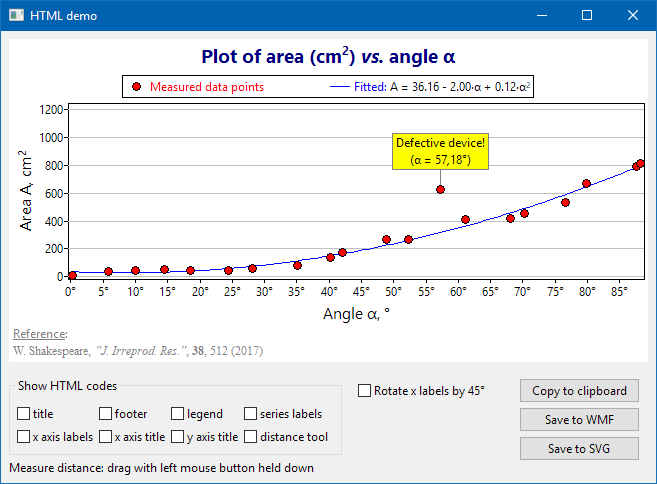 | |
| 156 | + | ||
| 157 | + | [[TAChart Demos|html]] | |
| 158 | + | ||
| 159 | + | 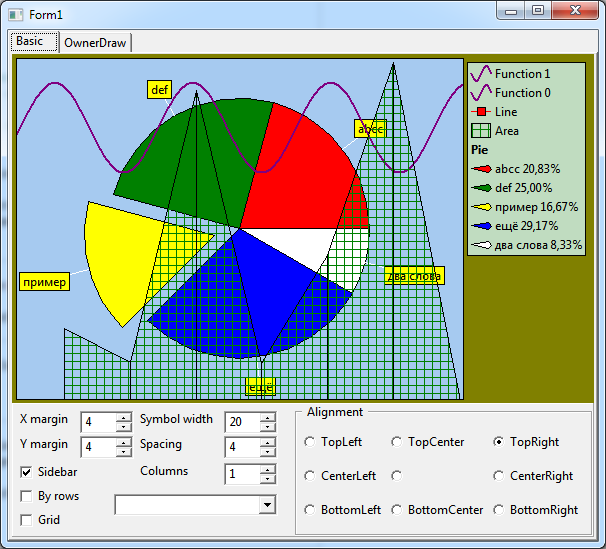 | |
| 160 | + | ||
| 161 | + | [[TAChart Demos|legend (Page "Basics")]] | |
| 162 | + | ||
| 163 | + | 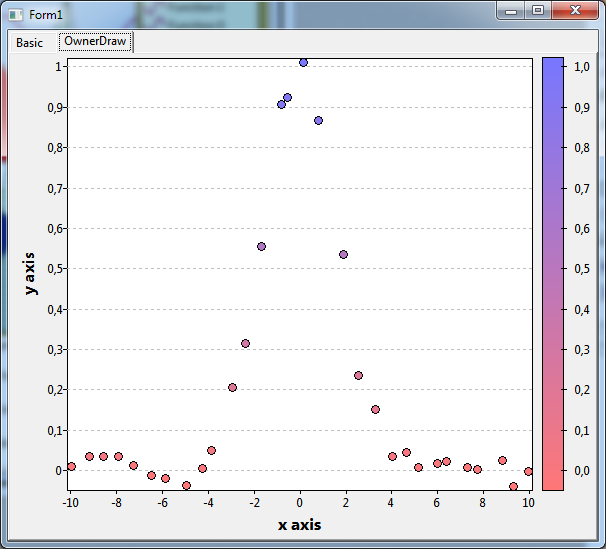 | |
| 164 | + | ||
| 165 | + | [[TAChart Demos|legend (Page "OwnerDrawn"]] | |
| 166 | + | ||
| 167 | + | 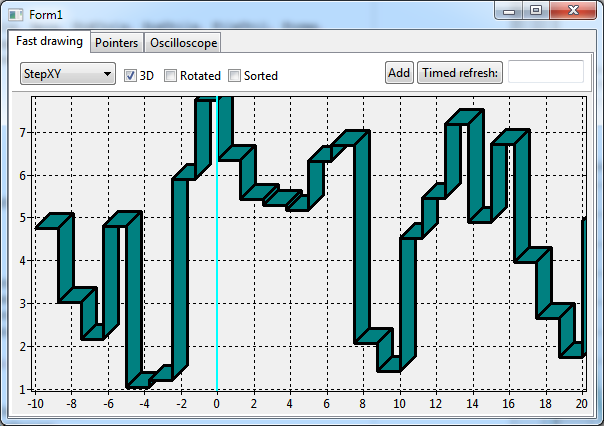 | |
| 168 | + | ||
| 169 | + | [[TAChart Demos|line (Page "Fast drawing")]] | |
| 170 | + | ||
| 171 | + | 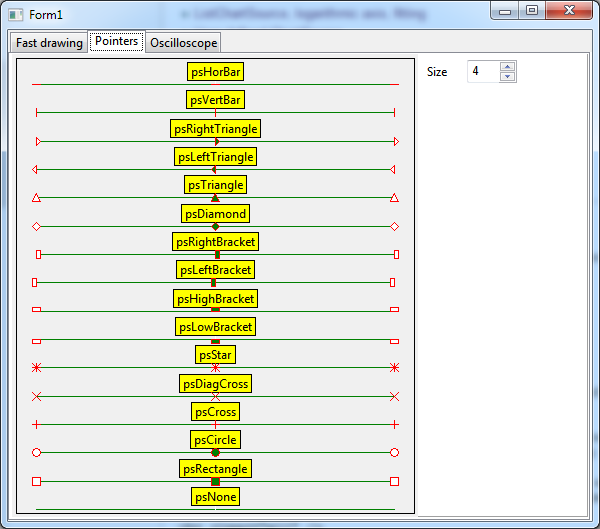 | |
| 172 | + | ||
| 173 | + | [[TAChart Demos|line (Page "Pointers")]] | |
| 174 | + | ||
| 175 | + | 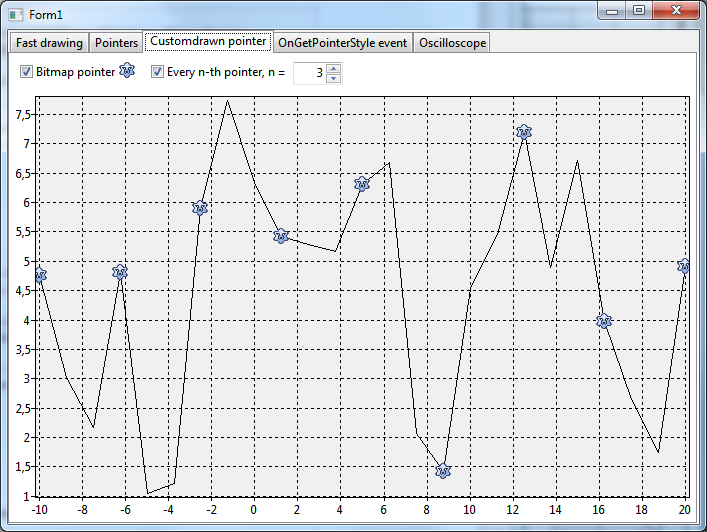 | |
| 176 | + | ||
| 177 | + | [[TAChart Demos|line (Page "Customdrawn pointer")]] | |
| 178 | + | ||
| 179 | + | 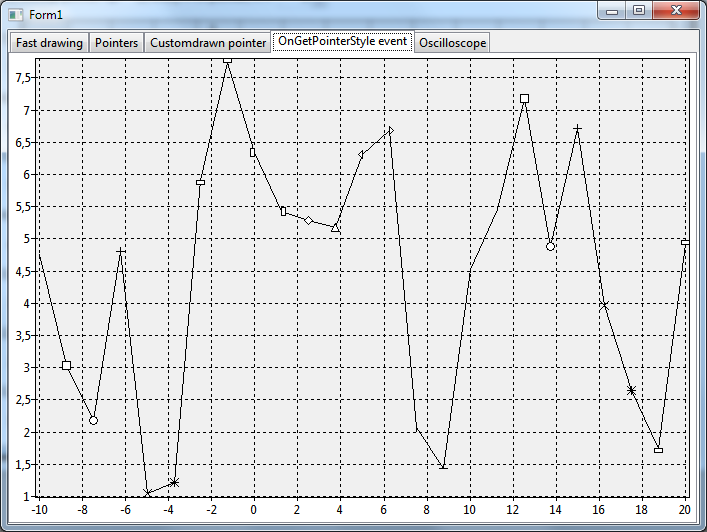 | |
| 180 | + | ||
| 181 | + | [[TAChart Demos|line (Page "OnGetPointerStyle event")]] | |
| 182 | + | ||
| 183 | + | 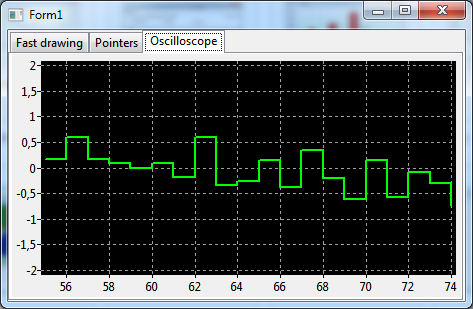 | |
| 184 | + | ||
| 185 | + | [[TAChart Demos|line (Page "Oscilloscope")]] | |
| 186 | + | ||
| 187 | + | 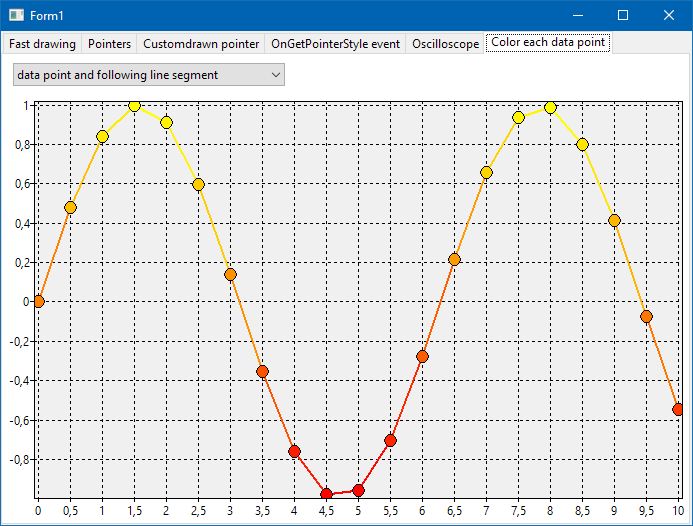 | |
| 188 | + | ||
| 189 | + | [[TAChart Demos|line (Page "Color each data point")]] | |
| 190 | + | ||
| 191 | + | 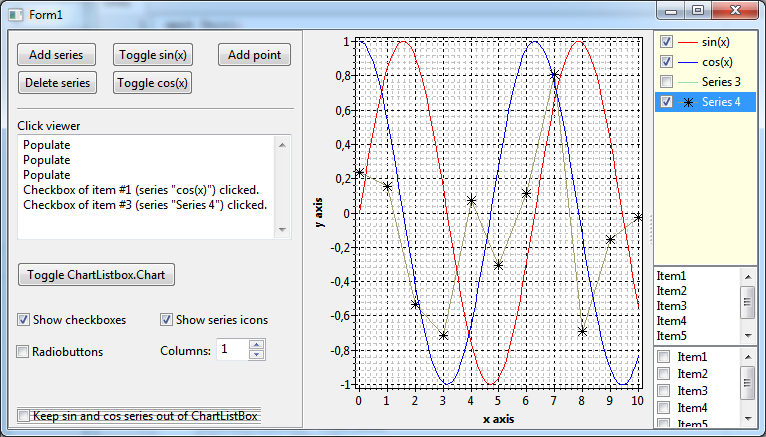 | |
| 192 | + | ||
| 193 | + | [[TAChart Demos|listbox]] | |
| 194 | + | ||
| 195 | + | 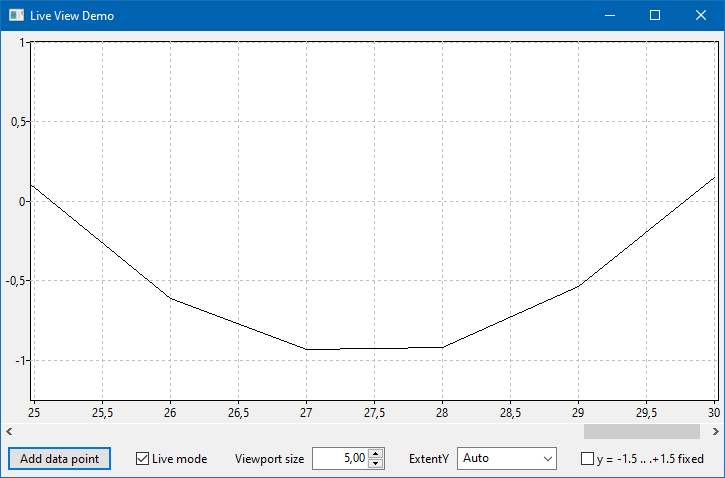 | |
| 196 | + | ||
| 197 | + | [[TAChart Demos|liveview, liveview-paned]] | |
| 198 | + | ||
| 199 | + | 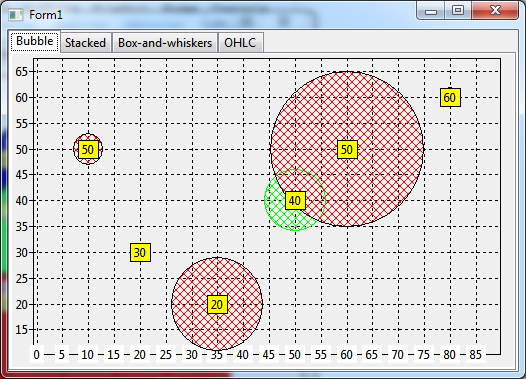 | |
| 200 | + | ||
| 201 | + | [[TAChart Demos|multi (Page "Bubble")]] | |
| 202 | + | ||
| 203 | + | 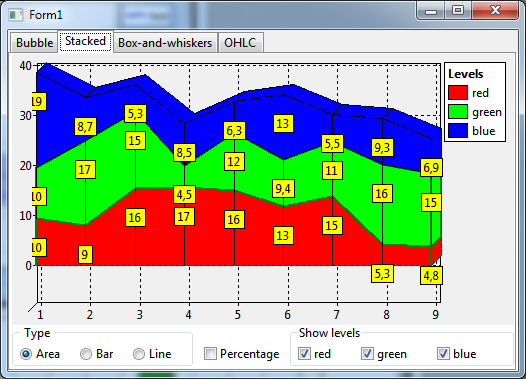 | |
| 204 | + | ||
| 205 | + | [[TAChart Demos|multi (Page "Stacked")]] | |
| 206 | + | ||
| 207 | + | 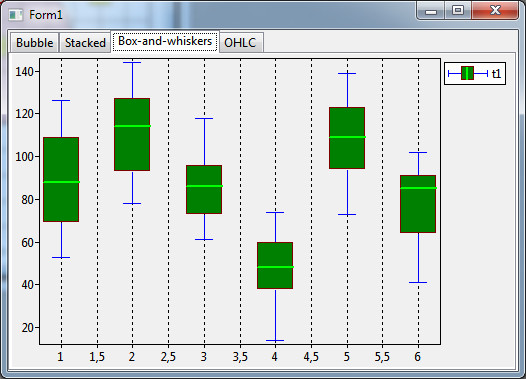 | |
| 208 | + | ||
| 209 | + | [[TAChart Demos|multi (Page "Box-and-Whiskers")]] | |
| 210 | + | ||
| 211 | + | 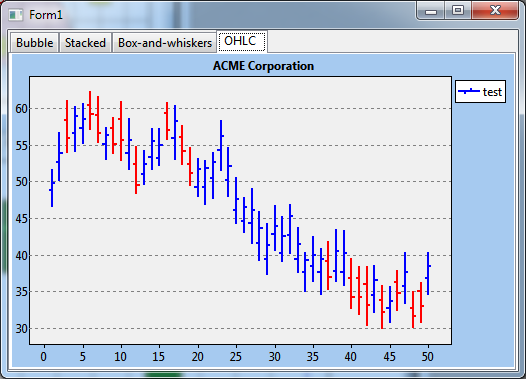 | |
| 212 | + | ||
| 213 | + | [[TAChart Demos|multi (Page "OHLC")]] | |
| 214 | + | ||
| 215 | + | 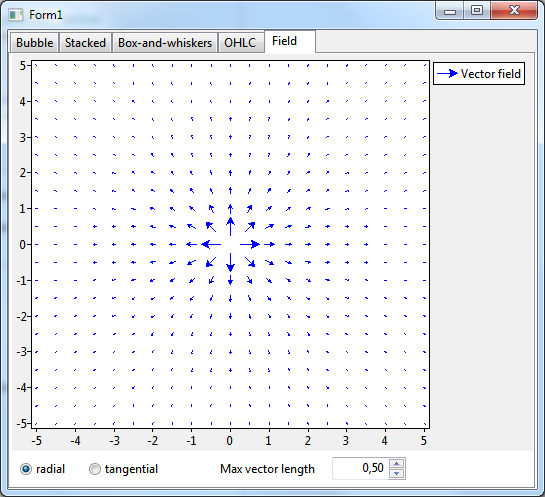 | |
| 216 | + | ||
| 217 | + | [[TAChart Demos|multi (Page "Field")]] | |
| 218 | + | ||
| 219 | + | 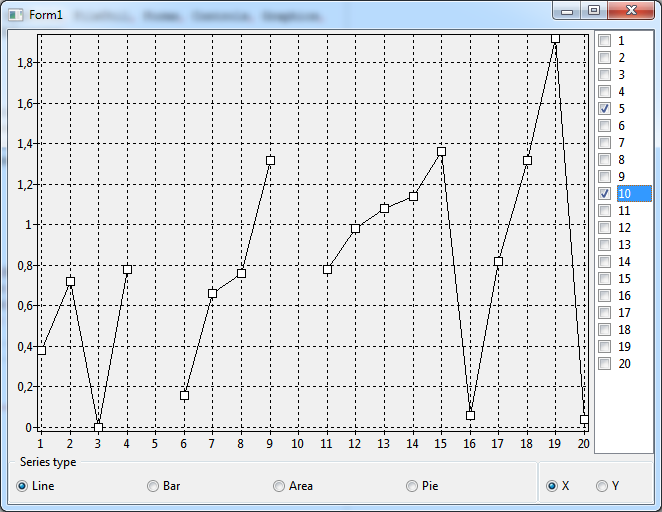 | |
| 220 | + | ||
| 221 | + | [[TAChart Demos|nan]] | |
| 222 | + | ||
| 223 | + | 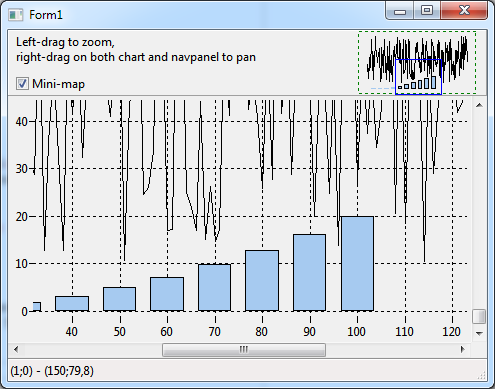 | |
| 224 | + | ||
| 225 | + | [[TAChart Demos|navigate]] | |
| 226 | + | ||
| 227 | + | 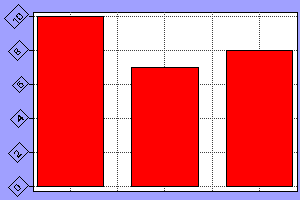 | |
| 228 | + | ||
| 229 | + | [[TAChart Demos|nogui]] | |
| 230 | + | ||
| 231 | + | 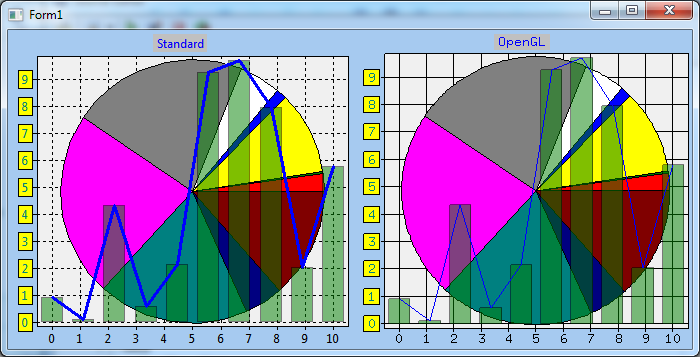 | |
| 232 | + | ||
| 233 | + | [[TAChart Demos|opengl]] | |
| 234 | + | ||
| 235 | + | 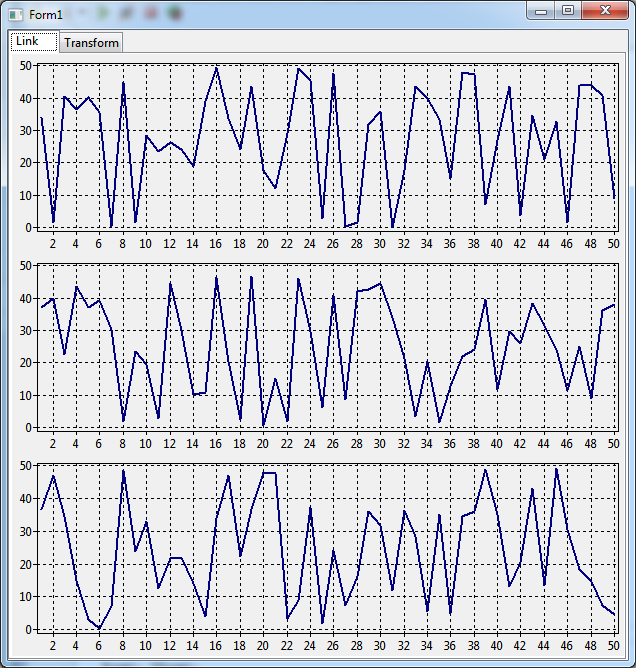 | |
| 236 | + | ||
| 237 | + | [[TAChart Demos|panes]] | |
| 238 | + | ||
| 239 | + | 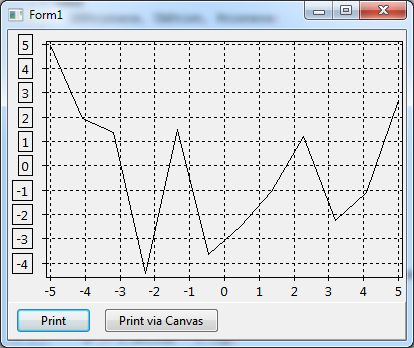 | |
| 240 | + | ||
| 241 | + | [[TAChart Demos|print]] | |
| 242 | + | ||
| 243 | + | 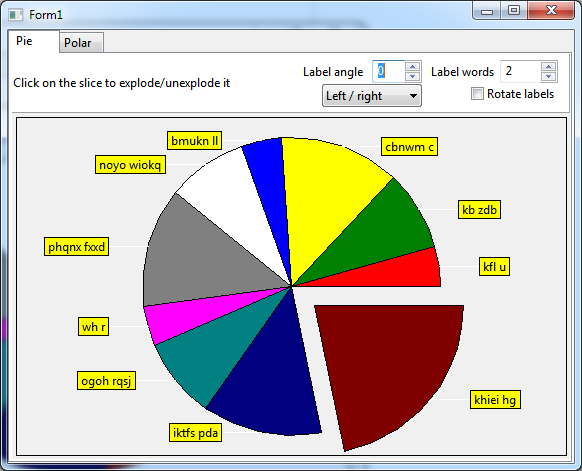 | |
| 244 | + | ||
| 245 | + | [[TAChart Demos|radial (page "Pie")]] | |
| 246 | + | ||
| 247 | + | 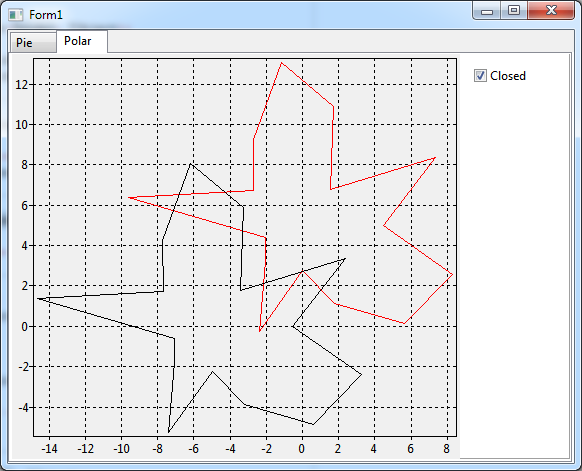 | |
| 248 | + | ||
| 249 | + | [[TAChart Demos|radial (page "Polar")]] | |
| 250 | + | ||
| 251 | + | 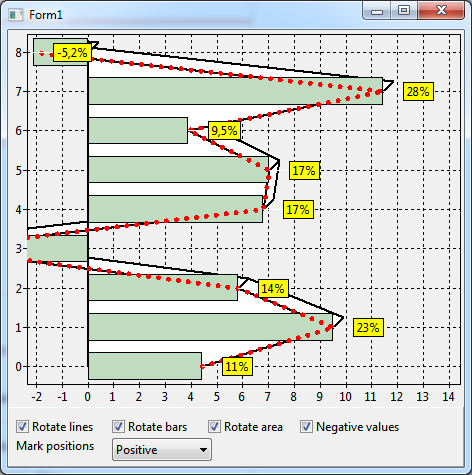 | |
| 252 | + | ||
| 253 | + | [[TAChart Demos|rotate]] | |
| 254 | + | ||
| 255 | + | 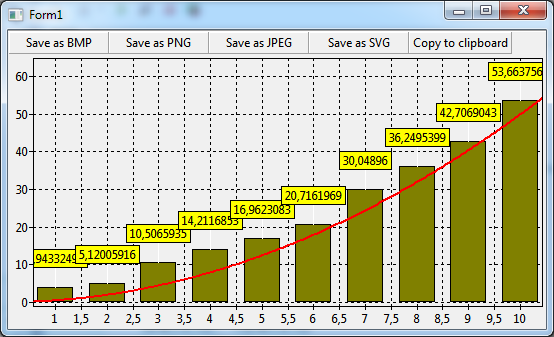 | |
| 256 | + | ||
| 257 | + | [[TAChart Demos|save]] | |
| 258 | + | ||
| 259 | + | 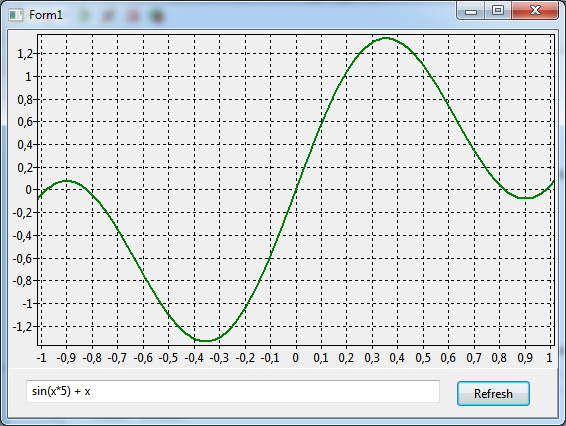 | |
| 260 | + | ||
| 261 | + | [[TAChart Demos|script]] | |
| 262 | + | ||
| 263 | + | 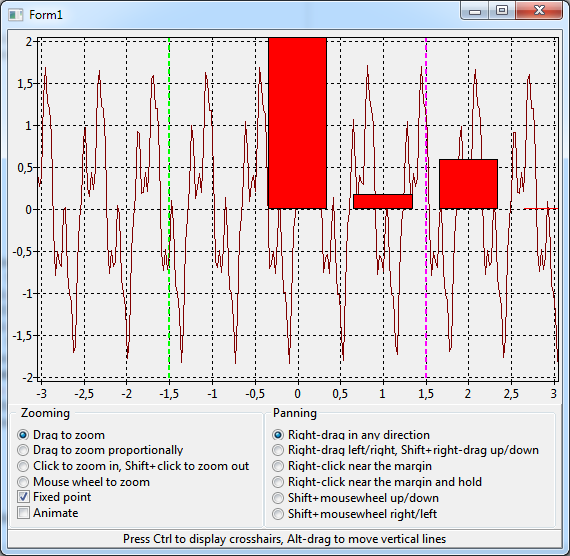 | |
| 264 | + | ||
| 265 | + | [[TAChart Demos|tools]] | |
| 266 | + | ||
| 267 | + | 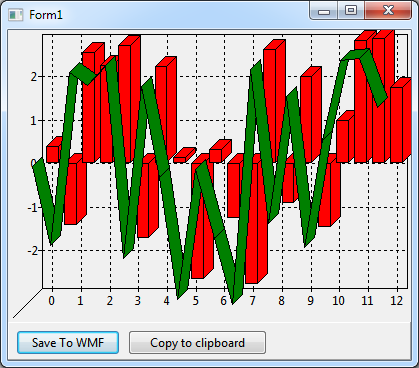 | |
| 268 | + | ||
| 269 | + | [[TAChart Demos|wmf]] | |
| 270 | + | ||
| 77 | 271 | ## Demo folders | |
| 78 | 272 | ||
| 79 | 273 | ### 3d | |
| 80 | 274 | ||
| 81 | 275 | [thumbnail|upright 1.5](/wiki-images/4/4d/Zdemo.png) The project **`zdemo`** in the folder `3d` illustrates creation of a simple 3d effect in TAChart. Some series types have a property `Depth` allowing to extrude the series into the third dimension. Using the property `ZPosition` the series can be "shifted" back and forth into the depth dimension. The same property allows to move the axes and the grid to the front.\ | |
| 82 | 276 | ||
| 83 | 277 | ### aggpas | |
| 84 | 278 | ||
| 85 | 279 | [thumbnail|upright 1.5](/wiki-images/1/1a/Aggpasdemo.png) For improved rendering quality, TAChart can take advantage of the fast and powerful [AggPas](http://www.crossgl.com/aggpas/) library with anti-aliased drawing and subpixel accuracy. The project `aggpasdemo` shows the necessary code to achieve this: | |
| 86 | 280 | ||
| 87 | 281 | - Add a `TChartGUIConnectorAggPas` to the form and assign it to the property `GUIConnector` of the form | |
| 88 | 282 | - Or, use a `TPaintbox` and use the code given in `TForm1.PaintBox1Paint` in its `OnPaint` event. | |
| 89 | 283 | ||
| 90 | 284 | Note that this feature is not yet available in Lazarus 1.2 and requires the trunk version. Packages `AggPasLCL` and `TACharstAggPas` are needed to compile the demo.\ | |
| 91 | 285 | ||
| 92 | 286 | ### animate | |
| 93 | 287 | ||
| 94 | 288 | [thumbnail|upright 1.5](/wiki-images/a/a3/TAChart_Animate_Demo.jpg) The **`animatedemo`** presents animation of a bar chart. The main animation work is done by a `TCustomAnimatedChartSource` created at runtime and its `OnGetItem` event.\ | |
| 95 | 289 | ||
| 96 | 290 | ### axis | |
| 97 | 291 | ||
| 98 | 292 | [thumbnail|upright 1.5](/wiki-images/8/8b/Axis_customized_marks.png) The project "axis" shows some fundamental and advanced aspects of axis formatting and layout in a multi-page form: | |
| 99 | 293 | ||
| 100 | 294 | Page **Customized marks** demonstrates how painting of the marks of an axis can be controlled by modifying their properties, such as `Marks.LabelBrush`, `Marks.Frame`, or `Marks.LabelFont`. Highlighting of individual marks can be done by assigning a handler to the axis event `OnMarksToText`: | |
| 101 | 295 | ||
| 102 | 296 | ``` pascal | |
| 103 | 297 | procedure TForm1.ChartCustomMarksAxisList1MarkToText(var AText: String; AMark: Double); | |
| 104 | 298 | begin | |
| 105 | 299 | if AMark = 3 then | |
| 106 | 300 | AText := '*' + AText + '*'; | |
| 107 | 301 | end; | |
| 108 | 302 | ``` | |
| 109 | 303 | ||
| 110 | 304 | [thumbnail|upright 1.5](/wiki-images/6/6a/Axis_axis_groups.png) In page **Axis groups** it is shown how a chart layout with multiple axes can be created. The [[TAChart Tutorial: Multiple Panes in one Chart]] explains the required steps in detail. | |
| 111 | 305 | ||
| 112 | 306 | In the demo, the axes and required axis transformations are created at runtime.\ | |
| 113 | 307 | [thumbnail|upright 1.5](/wiki-images/3/3d/Axis_submarks.png) In the next page, **Submarks**, a minor axis is used along the x axis, and smaller labels are drawn for each tick of the minor axis. This effect is achieved by adding an additional axis to the property `Minors`. Minor axes have their own set of marks and labels.\ | |
| 114 | 308 | [thumbnail|upright 1.5](/wiki-images/7/73/Axis_date_and_time.png) Displaying an axis with date and time data is the subject of page **Date and time**. The series displays random data for every hour in a 10-year date range. Zoom in by clicking with the left, zoom out by clicking with the right mouse button. For every zoom level the **TDateTimeIntervalChartSource** manages to displays reasonable labels along the x axis.\ | |
| 115 | 309 | [thumbnail|upright 1.5](/wiki-images/f/ff/Axis_intervals.png) The most prominent feature of the demo in page **Intervals** is that the same y data are displayed on several axes with different settings of the `Intervals` property. The x axis demonstrates how the range of displayed labels can be limited by means of the axis property `Marks.Range`.\ | |
| 116 | 310 | [thumbnail|upright 1.5](/wiki-images/6/66/Axis_position.png) Page **Position** demonstrates that axes do not have to be at the edge of a chart. In plots of mathematical function, for examples, the axes usually run through the origin at x=0 and y=0. Modifying the property `Position` of an axis allows to place it at any position. The demo shows also how an additional axis can be added at the chart edge. | |
| 117 | 311 | ||
| 118 | 312 | ### axisalign | |
| 119 | 313 | ||
| 120 | 314 | [thumbnail|upright 1.5](/wiki-images/8/86/Axisalign.png) In new TAChart versions after Lazarus 1.2.6, the chart axis has a new property `LabelSize` which - if different from `0` - overrides the automatic axis positioning mechanism. Therefore, this property can be used to align the axis lines of charts which are stacked or positioned side-by-side and in which the axis labels have different lengths.\ | |
| 121 | 315 | ||
| 122 | 316 | ### axistransf | |
| 123 | 317 | ||
| 124 | 318 | [thumbnail|upright 1.5](/wiki-images/9/97/Axistransf_linear.png) The subject of the project "axistransf" are axis transformations which are the key to non-linear or distorted axis scales. Several charts are combined into a multi-paged form. | |
| 125 | 319 | ||
| 126 | 320 | The chart on page **Linear** shows two temperature curves which are displaced for better clarity. The summer temperatures are shown as a red curve, the labels are at the left y axis; the winter temperatures are shown as a blue curve (and overlayed bar series) and have their labels on the right y axis. Both axes cover only part of the available space to separate the data. | |
| 127 | 321 | ||
| 128 | 322 | This effect can be achieved by using **auto-scale axis transformations**. | |
| 129 | 323 | ||
| 130 | 324 | [thumbnail|upright 1.5](/wiki-images/f/f4/Axistransf_indep_scale.png) The demo **Independent scale** covers the same subject. | |
| 131 | 325 | ||
| 132 | 326 | See [[TAChart Tutorial: Multiple Panes in one Chart]] for a detailed explanation of the steps required.\ | |
| 133 | 327 | [thumbnail|upright 1.5](/wiki-images/2/2b/Axistransf_logarithm.png) A plot with logarithmic axis is displayed on page **Logarithm**. The striped background layout is achieved by means of a `TChartStyles` component.\ | |
| 134 | 328 | [thumbnail|upright 1.5](/wiki-images/7/73/Axistransf_normal_dist.png) Page **Normal distribution** shows a series with random data, their statistical distribution follows a Normal Distribution. Using a `TCumulNormDistrAxisTransform` the cumulated probability distribution can be distorted to follow a straight line.\ | |
| 135 | 329 | [thumbnail|upright 1.5](/wiki-images/c/ce/Axistransf_userdefined.png) The chart on page **User defined** contains a purple vertical line which acts like a magnifier: The series is zoomed horizontally in the vicinity around this line. Dragging the line allows to blow up any part of the series. | |
| 136 | 330 | ||
| 137 | 331 | This local zoom effect is achieved by means of a `TUserDefinedAxisTransform`. In this transform, the axis transformation is defined by the handler of the event `OnAxisToGraph`.\ | |
| 138 | 332 | ||
| 139 | 333 | ### barseriesshapes | |
| 140 | 334 | ||
| 141 | 335 | [thumbnail|upright 1.5](/wiki-images/e/e4/Barshapesdemo.png) Demonstrates usage of alternative bar shapes in 3D TBarSeries.\ | |
| 142 | 336 | ||
| 143 | 337 | ### basic | |
| 144 | 338 | ||
| 145 | 339 | [thumbnail|upright 1.5](/wiki-images/3/3d/Basicdemo.png) Basic operation with charts and series is demonstrated in the `basicdemo` project. The demo shows | |
| 146 | 340 | ||
| 147 | 341 | - how to create a series at runtime and add it to the chart | |
| 148 | 342 | - how to add data to a series (`series.AddXY(...)`) | |
| 149 | 343 | - how to clear series (`Chart1.ClearSeries`) | |
| 150 | 344 | - how to change the z position of a series (`TForm1.BringToFront`) | |
| 151 | 345 | - how to show/hide axes, axis grid, titles and the legend | |
| 152 | 346 | - how to invert the axis direction | |
| 153 | 347 | - how to show a crosshair marker. Note, however, that usage of the reticule is deprecated now, use [[TAChart documentation|zoom tools]] instead. | |
| 154 | 348 | ||
| 155 | 349 | ### bgra | |
| 156 | 350 | ||
| 157 | 351 | [thumbnail|upright 1.5](/wiki-images/4/4e/Bgrademo.png) For improved rendering quality, TAChart can take advantage of the fast and powerful [[BGRABitmap]] library with anti-aliased drawing and subpixel accuracy. The project `bgrademo` shows the necessary code to achieve this: | |
| 158 | 352 | ||
| 159 | 353 | - Add a `TChartGUIConnectorBGRA` to the form and assign it to the property `GUIConnector` of the form | |
| 160 | 354 | - Or, use a `TPaintbox` and use the code given in `TForm1.PaintBox1Paint` in its `OnPaint` event. | |
| 161 | 355 | ||
| 162 | 356 | Packages `bgrabitmappack` and `TAChartBgra` are needed to compile the demo. | |
| 163 | 357 | ||
| 164 | 358 | > **Note:** There is a special wiki page [[BGRABitmap tutorial TAChart|BGRABitmap Tutorial TAChart]] giving step-by-step instructions how to create a chart like the one in the image at the right. | |
| 165 | 359 | ||
| 166 | 360 | ### charteditordemo | |
| 167 | 361 | ||
| 168 | 362 | [thumbnail|upright 1.5](/wiki-images/f/f0/Charteditor_dialog.png) The **charteditordemo** project shows a gui how the user could interactively change most elements of a chart. Besides the `TDataPointClickTool`, the project relies strongly on the dedicated chart tools `TTitleFootClickTool`, `TAxisClickTool` and `TLegendClickTool` which were introduced in Lazarus v2.1.\ | |
| 169 | 363 | ||
| 170 | 364 | ### chartsource | |
| 171 | 365 | ||
| 172 | 366 | The demo project **chartsource** illustrates various use cases for chart source components [thumbnail|upright 1.5](/wiki-images/4/45/Chartsource_basic.png) Page **Basic'' demonstrates that the same chartsource can be attached to several series and be used in several charts. In this example data are provided by means of a `TListChartSource` and a `TRandomChartSource`.\ | |
| 173 | 367 | [thumbnail|upright 1.5](/wiki-images/b/b5/Chartsource_statistics.png) Page**Statistics**illustrates some applications of the `TCalculatedChartSoruce`: cumulative sums and moving average\ | |
| 174 | 368 | [thumbnail|upright 1.5](/wiki-images/4/4e/Chartsource_derivative.png) Page**Derivative**highlights numerical calculation and plotting of derivatives of data series using the `TCalculatedChartSource`.\ | |
| 175 | 369 | [thumbnail|upright 1.5](/wiki-images/4/4d/Chartsource_sorting.png) Page**Sorting''' shows how the data values of a `TUserDefinedChartSource` can be sorted by means of a `TSortedChartSource` having it as `Origin`. This is an interesting application for a `TBubbleSeries`: when the data points are sorted by radius (y value with y index 1) in descending order the bubble are drawn from back to front. Therefore, it is not possible that bubbles are completely covered by anothers.\ | |
| 176 | 370 | ||
| 177 | 371 | ### clone | |
| 178 | 372 | ||
| 179 | - | ||
| 373 | + |  \ | |
| 180 | 374 | Page **Series** of the "clonedemo" demonstrates how a series can be duplicated ("cloned"): | |
| 181 | 375 | ||
| 182 | 376 | ``` pascal | |
| 183 | 377 | bs := TBarSeries.Create(Self); | |
| 184 | 378 | bs.Assign(ChartSeries.Series[i]); | |
| 185 | 379 | bs.BarOffsetPercent := bs.BarOffsetPercent + 20; | |
| 186 | 380 | ChartSeries.AddSeries(bs); | |
| 187 | 381 | ``` | |
| 188 | 382 | ||
| 189 | 383 | Cloning of a chart, on page **Charts**, is even simpler: | |
| 190 | 384 | ||
| 191 | 385 | ``` pascal | |
| 192 | 386 | ch := Chart1.Clone; | |
| 193 | 387 | ``` | |
| 194 | 388 | ||
| 195 | 389 | ### combobox | |
| 196 | 390 | ||
| 197 | 391 | [thumbnail|upright 1.5](/wiki-images/7/7b/Combodemo.png) Application of the `TChartCombobox` is demonstrated by project "combodemo". It contains a chart with a line, bar and area series and has a sidebar for editing the appearance of these series. Brush and pen styles, pen widths and line series pointer styles can be changed by using this decicated multi-featured combobox. The standard `TColorBox` is used for modifying colors.\ | |
| 198 | 392 | ||
| 199 | 393 | ### distance | |
| 200 | 394 | ||
| 201 | 395 | [thumbnail|upright 1.5](/wiki-images/1/1b/Distancedemo-main.png) The [[TAChart documentation|TDataPointDistanceTool]] was designed to measure the distance of data points in a chart. The **`distancedemo`** demonstrates is application. | |
| 202 | 396 | ||
| 203 | 397 | Page **Main** allows to play with the main parameters of the tool. Use the left button to drag a measurement bar across the screen. The mouse-down event determines the starting point, while during dragging the end point is defined by the current mouse position. The distance is displayed in a label above the measurement line. The label can be turned off by setting the tool's `Marks.Visible` to `false`. Rotation of the label along with the measurement bar is controlled by some of the tool's `Options`. The properties `DataPointModeStart` and `DataPointModeEnd` determine whether the measurements starts or ends, respectively, at arbitrary points in the chart (`dpmFree`), or only at data points (`dpmSnap` or `dpmLock`, where `dpmLock` means that the measurement line is only visible when the mouse is near data points, in case of `dpmSnap` it is always visible but jumps to the next data point when the mouse gets close enough). | |
| 204 | 398 | ||
| 205 | 399 | Press the `SHIFT` key while the left mouse button is down to zoom into the chart by a given factor; zoom returns when `SHIFT` is released (code in `TForm1.ctDistance1BeforeKeyDown`). | |
| 206 | 400 | ||
| 207 | 401 | [thumbnail|upright 1.5](/wiki-images/1/1e/Distancedemo-fit.png) Page **Fit** shows a more advanced application of the distance tool. It uses its `OnGetDistanceText` event to fit a polynomial to the data between the start and end points of the measurement line. Fitting is done by means of a `TFitSeries`. The radiobuttons at the top ("Mean", "slope", "find peak") determine the degree of the fitted polynomial (0, 2, or 2, respectively). The fitted curved is drawn between the end points of the measurement line. For the code, see `TForm1.ctFitDataPointDistanceTool1GetDistanceText`. | |
| 208 | 402 | ||
| 209 | 403 | This kind of measurement is initiated by dragging with the right mouse button, while the left-drag controls a standard zooming process. | |
| 210 | 404 | ||
| 211 | 405 | (Note that this part of the demo is not working properly in Lazarus 1.2). | |
| 212 | 406 | ||
| 213 | 407 | ### events | |
| 214 | 408 | ||
| 215 | 409 | [thumbnail|upright 1.5](/wiki-images/3/31/Eventsdemo.png) TAChart exposes several events to control the appearence of the chart beyond the properties provided in the object inspector. The project `eventdemo` shows the effect of three typical events: | |
| 216 | 410 | ||
| 217 | 411 | - `TChart.OnBeforeDrawBackground` is called before painting the entire background rectangle of the chart. The demo shows how the background can be drawn as a gradient. | |
| 218 | 412 | - `TChart.OnBeforeDrawBackWall` is a possibilty to replace painting of the backwall of the chart by a user-provided procedure (the "backwall" is the rectangle enclosed by the chart axes). Here, the backwall is drawn as another gradient. | |
| 219 | 413 | - `BarSeries.OnBeforeDrawBar` allows to intercept the drawing process of a bar series. In the demo every other bar is drawn in a different fill style. | |
| 220 | 414 | ||
| 221 | 415 | All events provide a parameter `ADoDefaultDrawing` to skip the built-in drawing procedure if set to `false`. In the BarSeries example the 5th bar is dropped by this way.\ | |
| 222 | 416 | ||
| 223 | 417 | ### extent | |
| 224 | 418 | ||
| 225 | 419 | [thumbnail|upright 1.5](/wiki-images/b/b6/Extentdemo.png) The project `extentdemo` shows how the extent of a chart, i.e. the start and end of each axis, can be modified (properties `Chart.Extent.XMin`, `Chart.Extent.UseXMin`, etc.). | |
| 226 | 420 | ||
| 227 | 421 | In addition the demo provides code how to setup an extent history which is interesting for undoing extent changes by zooming and panning (see tutorial on "[[TAChart Tutorial: ColorMapSeries, Zooming|ColorMapSeries, zooming]]").\ | |
| 228 | 422 | ||
| 229 | 423 | ### fit | |
| 230 | 424 | ||
| 231 | 425 | [thumbnail|upright 1.5](/wiki-images/1/1f/Fitdemo.png) Basic fitting of equations to data by means of `TFitSeries` is illustrated by project **`fitdemo`**. The demo shows | |
| 232 | 426 | ||
| 233 | 427 | - how to select the fitting function and the number of fitting parameters (`TFitSeries.FitEquation`, `TFitSeries.ParamCount`). | |
| 234 | 428 | - how to restrict the data range for fitting (`TFitSeries.FitRange`) | |
| 235 | 429 | - how to extract the values of the fitted parameters (`TFitSeries.Param[]`) | |
| 236 | 430 | ||
| 237 | 431 | In addition, the usage of logarithmic x and/or y axes is demonstrated. | |
| 238 | 432 | ||
| 239 | 433 | > **Note:** These topics are explained in some detail in the tutorial on [[TAChart Tutorial: ListChartSource, Logarithmic Axis, Fitting|ListChartSource, logarithmic axis and fitting]]. | |
| 240 | 434 | ||
| 241 | 435 | ### func | |
| 242 | 436 | ||
| 243 | 437 | [thumbnail|upright 1.5](/wiki-images/5/5a/Funcdemo-domain.png) The project **`funcdemo`** gives examples of the usage of function series. | |
| 244 | 438 | ||
| 245 | 439 | The first page of this multi-tab project, **Domain**, demonstrates the [[TAChart documentation|TFuncSeries]]. This series plots a mathematical function. The function values are passed to the series by means of an event handler for `OnCalculate`. This series type has the advantage that the plot is always smooth independent of zooming. The function `y=1/sin(x)` drawn in the screenshot at the right is not defined for integer multiples of `pi`. Therefore, standard output draws vertical connection lines at these points. This artefact can be avoided by adding the points with undefined function values to the `DomainExclusions` of the series. Click at "Domain" to see this effect.\ | |
| 246 | 440 | [thumbnail|upright 1.5](/wiki-images/b/b6/Funcdemo-colormap.png) The [[TAChart documentation|TColorMapSeries]] shown on page **Color map** is similar to `TFuncSeries`, however, it requires an x and y value to calculate the function value z which is encoded as a color. The calculation is done again in the event handler for `OnCalculate`. The colors are assigned to the z values by means of a ListChartSource which is assigned to the `ColorSource` property of the series. | |
| 247 | 441 | ||
| 248 | 442 | > **Note:** The tutorial [[TAChart Tutorial: ColorMapSeries, Zooming|ColorMapSeries, Zoomin]] explains in detail how the ColorMapSeries is applied. | |
| 249 | 443 | ||
| 250 | 444 | [thumbnail|upright 1.5](/wiki-images/0/0c/Funcdemo-parametric.png) Page **Parametric** shows another function series requiring an `OnCalculate` event handler, the `TParametricCurveSeries`. Here, a single parameter (`t`) is used to calculate the `x` and `y` values. The example shows the parametric function defined by\ | |
| 251 | 445 | `x(t) = cos(a*t) - cos(b*t)^j`\ | |
| 252 | 446 | `y(t) = sin(c*t) - sin(d*d)^k`.\ | |
| 253 | 447 | [thumbnail|upright 1.5](/wiki-images/4/4b/Funcdemo-spline.png) The [[TAChart documentation|TCubicSplineSeries]] shown on page **Spline** is similar to a standard `TLineSeries` (black), but the data points are not connected by straight line segments, but by smooth cubic [spline](http://en.wikipedia.org/wiki/Spline_%28mathematics%29) curves (bright blue). The [[TAChart documentation|TBSplineSeries]] (green) is similar, but the spline does not pass through the data points and, therefore, achieves even better smoothing.\ | |
| 254 | 448 | [thumbnail|upright 1.5](/wiki-images/6/6d/Funcdemo-autoyextent.png) Page **Auto y extent** gives a solution to the problem that it is normally not possible to automatically adjust the y axis to the extent of data values. `TFuncSeries` was equipped with a property `ExtentAutoY` which has to be enabled for this purpose.\ | |
| 255 | 449 | ||
| 256 | 450 | ### html | |
| 257 | 451 | ||
| 258 | 452 | [thumbnail|upright 1.5](/wiki-images/5/50/Html_demo.png) Embedding of html tags and entities in TAChart text elements is demonstrated by the project **`html`**. This feature is activated by setting the `TextFormat` of the corresponding text element to `tfHTML`. The codes used can be show by checking the corresponding checkboxes; the title of the x axis, for example, is written as `'Angle α, °`'. | |
| 259 | 453 | ||
| 260 | 454 | The buttons "Copy to clipboard", "Save to WMF" and "Save to SVG" demonstrate that this special formatting is retained when copying a chart to the clipboard or when saving it to a graphics file. | |
| 261 | 455 | ||
| 262 | 456 | ### legend | |
| 263 | 457 | ||
| 264 | 458 | [thumbnail|upright 1.5](/wiki-images/3/35/Legenddemo-page1.png%E2%80%8E) The project **`legenddemo`** demonstrates how the legend of the TChart component can be used and modified. (Please note that after Lazarus version 1.2 the project window contains two pages; in older versions, only the first page is available). | |
| 265 | 459 | ||
| 266 | 460 | Page **Basic** demonstrates fundamental work with the legend: | |
| 267 | 461 | ||
| 268 | 462 | - showing series names (`series.Legend.Multiplicity = lmSingle`) | |
| 269 | 463 | - showing series data (`series.Legend.Multiplicity = lmPoint`, demonstrated for the pie series) | |
| 270 | 464 | - owner-drawing series icons for the legend by means of the event `OnDrawLegend` of a series (see `procedure Chart1FuncSeries1DrawLegend`) | |
| 271 | 465 | - using legend group titles (`Chart.Legend.GroupTitles`) | |
| 272 | 466 | - manually adding legend items (event `series.Legend.OnCreate`, demonstrated for `Chart1FuncSeries1`). Note the workaround for a bug in `FormCreate`. | |
| 273 | 467 | - run-time modification of properties for positioning of the legend. | |
| 274 | 468 | ||
| 275 | 469 | [thumbnail|upright 1.5](/wiki-images/e/ee/Legenddemo-page2.png%E2%80%8E) The second page (**OwnerDraw**) explains how the legend can be drawn as a gradient bar. For this purpose an event handler must be written for the chart's event `OnDrawLegend`. The gradient is drawn by calling the following procedure: | |
| 276 | 470 | ||
| 277 | 471 | ``` pascal | |
| 278 | 472 | procedure DrawGradient(ADrawer: IChartDrawer; ARect: TRect; | |
| 279 | 473 | AStartColor, AEndColor: TColor); | |
| 280 | 474 | var | |
| 281 | 475 | y,h: Integer; | |
| 282 | 476 | c: TColor; | |
| 283 | 477 | begin | |
| 284 | 478 | h := ARect.Bottom - ARect.Top; | |
| 285 | 479 | if h <= 0 then exit; | |
| 286 | 480 | for y := ARect.Bottom-1 downto ARect.Top do begin | |
| 287 | 481 | c := InterpolateRGB(AStartColor, AEndColor, (ARect.Bottom - y) / h); | |
| 288 | 482 | ADrawer.SetPenParams(psSolid, c); | |
| 289 | 483 | ADrawer.Line(ARect.Left, y, ARect.Right, y); | |
| 290 | 484 | end; | |
| 291 | 485 | end; | |
| 292 | 486 | ``` | |
| 293 | 487 | ||
| 294 | 488 | ### line | |
| 295 | 489 | ||
| 296 | 490 | [thumbnail|upright 1.5](/wiki-images/a/a8/Linedemo-fast.png) The `linedemo` illustrates some aspects of line series. | |
| 297 | 491 | ||
| 298 | 492 | Page **Fast drawing**: | |
| 299 | 493 | ||
| 300 | 494 | - Change the selection of the combobox to switch between different `LineType`s of the series. The screen shot at the right is created with the setting `LineType = ltStepXY`. | |
| 301 | 495 | - Create a 3D look by checking the option "3D". | |
| 302 | 496 | - Interchange the `x` and `y` axes by checking "Rotated". | |
| 303 | 497 | - Quickly add 600,000 data points and measure the time for a refresh. | |
| 304 | 498 | ||
| 305 | 499 | [thumbnail|upright 1.5](/wiki-images/7/7c/Linedemo-pointers.png) | |
| 306 | 500 | ||
| 307 | 501 | Page **Pointers** shows a list of all pointers that are available for data point markers. The chart is created by using a lineseries with three data points for each pointer `Style`. The name of the style and a different color have been assigned to the center data point in the AddXY method of the series. The size of the pointers can be changed at runtime.\ | |
| 308 | 502 | [thumbnail|upright 1.5](/wiki-images/a/a9/Linedemo-customdrawnpointer.png) | |
| 309 | 503 | ||
| 310 | 504 | Page **OnCustomdrawn pointer** demonstrates how a bitmap can be used as a data pointer, and how only every n-th pointer can be drawn. This is done by means of the event `OnCustomDrawPointer`.\ | |
| 311 | 505 | [thumbnail|upright 1.5](/wiki-images/4/4c/Linedemo-ongetpointerstyle.png) | |
| 312 | 506 | ||
| 313 | 507 | Using the event `OnGetPointerStyle` the pointers of individual data points of a line series can be changed. This is demonstrated on page **OnGetPointerStyle**..\ | |
| 314 | 508 | [thumbnail|upright 1.5](/wiki-images/d/d3/Linedemo-oscilloscope.png) | |
| 315 | 509 | ||
| 316 | 510 | Page **Oscilloscope**: Driven by a timer, more and more data points are added to the line series. The oldest data point is deleted once the series contains more than 20 points. The series is updated continously and is drawn using `LineType=ltStepXY`. The `OnTimer` event handler of the timer contains code to allow zooming into various parts of the chart while preserving the "oscilloscope" behavior.\ | |
| 317 | 511 | [thumbnail|upright 1.5](/wiki-images/9/92/Linedemo-coloreach.png) | |
| 318 | 512 | ||
| 319 | 513 | Page **Color each data point** applies the lineseries property `ColorEach` for colorizing individual datapoints and/or the adjacent line segments. The color is passed as the 4th parameter of the series method `AddXY(x, y, text, color)`.\ | |
| 320 | 514 | ||
| 321 | 515 | ### listbox | |
| 322 | 516 | ||
| 323 | 517 | [thumbnail|upright 1.5](/wiki-images/4/4a/Listboxdemo.png) `TChartListbox` is a useful add-on to TAChart for interactively turning selected series on and off. Just add a `TChartListbox` to the form and link its `Chart` property to the chart of interest. The project `listboxdemo` demonstrates that there is a two-way communication between chart and listbox: when listbox items are checked/unchecked the corresponding series are shown/hidden. Conversely, when series are added/deleted/shown/hidden in the chart the changes are reflected in the listbox automatically.\ | |
| 324 | 518 | ||
| 325 | 519 | ### liveview, liveview-paned | |
| 326 | 520 | ||
| 327 | 521 | [thumb|upright 1.0](/wiki-images/7/7e/Liveview.png) [thumb|upright 1.0](/wiki-images/9/91/Liveview-paned.png) These two projects demonstrate usage of the `TChartLiveView` component which displays, in a scrolling viewport, only the most recent data points arriving from some external source. | |
| 328 | 522 | ||
| 329 | 523 | In order to apply a `TChartLiveView` set its `Chart` property to the chart to be controlled. Set `Active` to `true` to activate the live view. Property `ViewportSize` determines the width of the scrolling window in axis units. | |
| 330 | 524 | ||
| 331 | 525 | While the `liveview` project applies to a normal chart with a single y axis, usage of several y axes is demonstrated in the `liveview-paned` project. The creation of a "paned chart" with several axes is the subject of the demo panes.\ | |
| 332 | 526 | ||
| 333 | 527 | ### multi | |
| 334 | 528 | ||
| 335 | 529 | [thumbnail|upright 1.5](/wiki-images/9/94/Multidemo-bubble.png) Usage of series with multiple y values is the subject of project **`multidemo`**. `TListChartSource` provides storage for additional y values in the array `YList[]`. | |
| 336 | 530 | ||
| 337 | 531 | See [[TAChart documentation]] of more details. | |
| 338 | 532 | ||
| 339 | 533 | Page **Bubble** shows a chart with a [[TAChart documentation|bubble series]]. This series draws data points as circles of variable radius centered at the data points. In addition to the standard `x`/`y` coordinates there must be a second y value to specify the radius. Since - as usual - a color value can be assigned to a data point bubble charts can show four-dimensional data.\ | |
| 340 | 534 | [thumbnail|upright 1.5](/wiki-images/4/48/Multidemo-stacked.png) Page **Stacked** shows stacked area, bar, or line series charts. Stacked series must provide a y value for the each stack levels. The `TChartStyles` component is used to define the color of the stacks. | |
| 341 | 535 | ||
| 342 | 536 | > **Note:** A detailed description how to create stacked charts is given in the tutorial [[TAChart Tutorial: Stacked BarSeries|"Stacked bar series"]]. | |
| 343 | 537 | ||
| 344 | 538 | [thumbnail|upright 1.5](/wiki-images/7/76/Multidemo-boxwhisker.png) A chart with a [[TAChart documentation|Box-and-Whiskers-Series]] is displayed in page **Box-and-Whiskers**. This series type represents data as rectangles ("box") with a medium line and two T-shaped protrusions in both directions ("whiskers") . It requires five y values: | |
| 345 | 539 | ||
| 346 | 540 | - Lower whisker | |
| 347 | 541 | - Lower box edge | |
| 348 | 542 | - Medium line | |
| 349 | 543 | - Upper box edge | |
| 350 | 544 | - Upper whisker | |
| 351 | 545 | ||
| 352 | 546 | [thumbnail|upright 1.5](/wiki-images/2/29/Multidemo-ohlc.png) Page **OHLC** shows a chart with a [[TAChart documentation|Open-high-low-close series]] which represents data as a vertical lines with two ticks and requires four y values: | |
| 353 | 547 | ||
| 354 | 548 | - Lower point of line = "Low" value | |
| 355 | 549 | - Left-facing tick position = "Open" value | |
| 356 | 550 | - Right-facing tick position = "Close" value | |
| 357 | 551 | - Upper point of line = "High" value | |
| 358 | 552 | ||
| 359 | 553 | [thumbnail|upright 1.5](/wiki-images/9/96/Multidemo-field.png) A simple [[TAChart documentation|field plot]] is demonstrated on page **Field**. This series type draws short arrows at the data points to highlight the directions of a vector field. It requires two x and two y values per data point.\ | |
| 360 | 554 | ||
| 361 | 555 | ### nan | |
| 362 | 556 | ||
| 363 | 557 | [thumbnail|upright 1.5](/wiki-images/e/e5/Nandemo.png) The project **`nandemo`** shows how values can be skipped from a series. Click on an x value in the checklistbox at the right to replace the x or y value of the corresponding data point by NaN. In a line series, a NaN value introduces a break in the originally continuous curve. In other series types, the effect is similar. See [[TAChart documentation]] of more details.\ | |
| 364 | 558 | ||
| 365 | 559 | ### navigate | |
| 366 | 560 | ||
| 367 | 561 | [thumbnail|upright 1.5](/wiki-images/0/0b/Navigatedemo.png) For navigation in a zoomed chart, TAChart provides the components [[TAChart documentation|TChartNavScrollbar]] and [[TAChart documentation|TChartNavPanel]]. Usage of these components is demonstarted in the **`navigatedemo`** project. | |
| 368 | 562 | ||
| 369 | 563 | The chart in which the navigation occurs must be assigned to this corresponding property. Note the property `MiniMap` which displays a reduced view of the chart and draws the current viewport as a highlighted rectangle.\ | |
| 370 | 564 | ||
| 371 | 565 | ### nogui | |
| 372 | 566 | ||
| 373 | 567 | [thumbnail|upright 1.5](/wiki-images/c/c2/Noguidemo.png) **`noguidemo`** demonstrates that TAChart can also be used for creating graphics output from console (no-gui) programs. This project creates a chart and a simple bar series at runtime and stores the output to a png file without a user-interface showing up. | |
| 374 | 568 | ||
| 375 | 569 | Note that, for Windows, the `freetype-6.dll` and `zlib1.dll` are required in the exe folder in order to run the demo.\ | |
| 376 | 570 | ||
| 377 | 571 | ### opengl | |
| 378 | 572 | ||
| 379 | 573 | [thumbnail|upright 1.5](/wiki-images/a/ac/Opengldemo.png) **`opengldemo`** presents code how to use OpenGL for improved rendering quality of the chart by means of `TOpenGLDrawer`. See [[TAChart documentation]] for details on this drawer. In addition, the demo illustrates also the usage of [[TAChart documentation|series transparency]]. | |
| 380 | 574 | ||
| 381 | 575 | Note that the package `LazOpenGLContext` needs to be installed to compile this demo.\ | |
| 382 | 576 | ||
| 383 | 577 | ### panes | |
| 384 | 578 | ||
| 385 | 579 | [thumbnail|upright 1.5](/wiki-images/d/df/Panesdemo.png) When working with multiple charts in the same window it sometimes required to use common axes. The **`panes`** demo projects shows two possibilities how to achieve this: | |
| 386 | 580 | ||
| 387 | 581 | In page **Link** there are three charts, each with one series. The axes of the charts are linked by means of a `TChartExtentLink` component. The axes to be coupled are specified by the `Mode` property. Zoom in one of the chart by dragging a zoom rectangle with the left mouse button, and the other charts will follow. | |
| 388 | 582 | ||
| 389 | 583 | In page **Transform** there is only one chart, but with three series. Each series covers a third of the vertical chart area with its individual y axis. This effect can be achieved by means of three vertical axes and three [[TAChart documentation|AutoScaleAxisTransforms]]. | |
| 390 | 584 | ||
| 391 | 585 | > **Note:** Step-by-step instructions are given in the tutorial "[[TAChart Tutorial: Multiple Panes in one Chart|Multiple panes in the same chart]]". | |
| 392 | 586 | ||
| 393 | 587 | ||
| 394 | 588 | ||
| 395 | 589 | [thumbnail|upright 1.5](/wiki-images/f/f8/Printdemo.png) **`printdemo`** illustrates two ways of printing charts: | |
| 396 | 590 | ||
| 397 | 591 | - using direct painting on the printer's canvas by clicking on button "Print via canvas", | |
| 398 | 592 | ||
| 399 | 593 | ``` pascal | |
| 400 | 594 | Chart1.PaintOnCanvas(Printer.Canvas, ARect) | |
| 401 | 595 | ``` | |
| 402 | 596 | ||
| 403 | 597 | - or using a dedicated drawer for printing (by clicking on button "Print") which generally yields better quality. Package `TAChartPrint` is necessary to use `TPrinterDrawer`. See [[TAChart documentation]] for details on [[TAChart documentation|TPrinterDrawer]]. | |
| 404 | 598 | ||
| 405 | 599 | ``` pascal | |
| 406 | 600 | Chart1.Draw(TPrinterDrawer.Create(Printer), ARect); | |
| 407 | 601 | ``` | |
| 408 | 602 | ||
| 409 | 603 | In general, printer support requires the package `Printer4Lazarus`. The demo also shows how axis marks can be highlighted by a border (`Chart1.LeftAxis.Marks.Frame.Visible := true`).\ | |
| 410 | 604 | ||
| 411 | 605 | ### radial | |
| 412 | 606 | ||
| 413 | 607 | [thumbnail|upright 1.5](/wiki-images/8/86/Radialdemo_pie.png) The **`radialdemo`** project introduces two series, the [[TAChart documentation|TPieSeries]] and the [[TAChart documentation|TPolarSeries]]. Both interpret the x/y coordinates as angle and distance from center, but in an opposite way. | |
| 414 | 608 | ||
| 415 | 609 | `TPieSeries` shown on page **Pie** assumes that the y value of the chart source is the angle of the pie, and the x coordinate corresponds to the distance of the slice from the center. Therefore, the effect of the "exploded" slice can be achieved by increasing the x value (if property `Exploded` is set). In addition, the demo allows to play with some properties of the pie series: | |
| 416 | 610 | ||
| 417 | 611 | - `MarkPositions` | |
| 418 | 612 | - `RotateLabels` | |
| 419 | 613 | - `Marks.LabelFont.Rotation` | |
| 420 | 614 | ||
| 421 | 615 | See section [[TAChart documentation|Pie series]] in the [[TAChart documentation|documentation]].\ | |
| 422 | 616 | [thumbnail|upright 1.5](/wiki-images/a/a7/Radialdemo_polar.png) The second page **Polar** shows two polar series. In a polar series, the x value is interpreted as the angle in radians, and the y value corresponds to the distance of the point from the center. | |
| 423 | 617 | ||
| 424 | 618 | Both series are linked to the same ChartSource. They are offset with respect to each other because the properties `OriginX` and `OriginY` are different. The checkbox "Closed" allows to close the polygons (property `CloseCircle`) by connecting the first data point with the last one. | |
| 425 | 619 | ||
| 426 | 620 | See section [[TAChart documentation|Polar series]] in the [[TAChart documentation|documentation]].\ | |
| 427 | 621 | ||
| 428 | 622 | ### rotate | |
| 429 | 623 | ||
| 430 | 624 | [thumbnail|upright 1.5](/wiki-images/c/cc/Rotatedemo.png) "Rotate" in the context of project **`rotatedemo`** means "rotation of a series with respect to the x and y axes", i.e. painting of a series with x and y axes interchanged. | |
| 431 | 625 | ||
| 432 | 626 | The demo starts with a line series, a bar series and a 3d area series in the regular arrangement of x along the horizontal and y along the vertical axis. After checking the checkbox assigned to a series, its x values are drawn along the vertical and the y values along the horizontal axes. In the rotated configuration the bars of a bar series are drawn horizontally. | |
| 433 | 627 | ||
| 434 | 628 | In TAChart, this kind of rotation is achieved by assigning the property `AxisIndexX` to the index of the vertical axis, and `AxisIndexY` to that of the horizontal axis. | |
| 435 | 629 | ||
| 436 | 630 | In addition to rotation, the demo project allows also to play with the position of the series marks by changing the property `MarkPositions` of the red dotted line series.\ | |
| 437 | 631 | ||
| 438 | 632 | ### save | |
| 439 | 633 | ||
| 440 | 634 | [thumbnail|upright 1.5](/wiki-images/d/da/Savedemo.png) The project **`savedemo`** shows code how to save a chart to an external graphics file (.bmp, .png, .jpg, .svg) | |
| 441 | 635 | ||
| 442 | 636 | ``` pascal | |
| 443 | 637 | Chart1.SaveToBitmapFile('test.bmp'); | |
| 444 | 638 | ``` | |
| 445 | 639 | ||
| 446 | 640 | or to copy it to the clipboard | |
| 447 | 641 | ||
| 448 | 642 | ``` pascal | |
| 449 | 643 | Chart1.CopyToClipboardBitmap; | |
| 450 | 644 | ``` | |
| 451 | 645 | ||
| 452 | 646 | ### script | |
| 453 | 647 | ||
| 454 | 648 | [thumbnail|upright 1.5](/wiki-images/f/f3/Scriptdemo.png) The project **`scriptdemo`** applies [[Pascal Script|PascalScript]] to define the mathematical function shown in a [[TAChart documentation|TFuncSeries]]. In this way a mathematical function plotter can be created. | |
| 455 | 649 | ||
| 456 | 650 | A tutorial on usage of TFuncSeries can be found [[TAChart Tutorial: Function Series|here]].\ | |
| 457 | 651 | ||
| 458 | 652 | ### tools | |
| 459 | 653 | ||
| 460 | 654 | [thumbnail|upright 1.5](/wiki-images/e/ea/Toolsdemo.png) Project **`toolsdemo`** gives the opportunity to play with TAChart's zooming and panning tools. Follow the instructions on the screen to activate the individual tools. | |
| 461 | 655 | ||
| 462 | 656 | Internally, the work is done by the `TChartTool` components. Have a look at chapter [[TAChart documentation|Tools]] in the [[TAChart documentation]] or the tutorial "[[TAChart Tutorial: Chart Tools|Chart tools]]" to learn details on this powerful add-on to TAChart.\ | |
| 463 | 657 | ||
| 464 | 658 | ### wmf | |
| 465 | 659 | ||
| 466 | 660 | [thumbnail|upright 1.5](/wiki-images/b/bc/Wmfdemo.png) **`wmfdemo`** saves a chart to a windows metafile (.wmf): | |
| 467 | 661 | ||
| 468 | 662 | ``` pascal | |
| 469 | 663 | with Chart1 do | |
| 470 | 664 | Draw(TWindowsMetafileDrawer.Create('test.wmf'), Rect(0, 0, Width, Height)); | |
| 471 | 665 | ||
| 472 | 666 | // or, after r46404: | |
| 473 | 667 | Chart1.SaveToWMF('test.wmf'); | |
| 474 | 668 | ``` | |
| 475 | 669 | ||
| 476 | 670 | Since r46396, a chart can be **copied to the clipboard** as a windows metafile (windows-only); use an empty file name string in above `Draw` code for this purpose. After r46404, the simpler `Chart1.CopyToClipboardMetafile` has the same effect. | |
| 477 | 671 | ||
| 478 | 672 | > **Note:** wmf support in TAChart is very limited. In particular, it is available only on the Windows platform. Package `TAChartWMF` is required to compile this demo. | |
| 479 | 673 | ||
| 480 | 674 | ## Related documents | |
| 481 | 675 | ||
| 482 | 676 | **Main documentation:** | |
| 483 | 677 | ||
| 484 | 678 | - [[TAChart documentation]] | |
| 485 | 679 | ||
| 486 | 680 | **Tutorials:** | |
| 487 | 681 | ||
| 488 | 682 | - [[TAChart Tutorial: Getting started|Getting started]] | |
| 489 | 683 | - [[TAChart Tutorial: BarSeries|Bar series]] | |
| 490 | 684 | - [[TAChart Tutorial: Stacked BarSeries|Stacked bar series]] | |
| 491 | 685 | - [[TAChart Tutorial: ListChartSource, Logarithmic Axis, Fitting|ListChartSource, logarithmic axis, fitting]] | |
| 492 | 686 | - [[TAChart Tutorial: Userdefined ChartSource|User-defined ChartSource]] | |
| 493 | 687 | - [[TAChart Tutorial: Dual y axis, Legend|Dual y axis, legend]] | |
| 494 | 688 | - [[TAChart Tutorial: Chart Tools|Chart tools]] | |
| 495 | 689 | - [[TAChart Tutorial: Function Series|Function series]] | |
| 496 | 690 | - [[TAChart Tutorial: ColorMapSeries, Zooming|ColorMapSeries, zooming]] | |
| 497 | 691 | - [[TAChart Tutorial: Multiple Panes in one Chart|Multiple panes in the same chart]] | |
| 498 | 692 | - [[TAChart Tutorial: Background design|Background design]] | |
| 499 | 693 | - [[BGRABitmap tutorial TAChart]] | |
| 500 | 694 | ||
| 501 | 695 | --- | |
| 502 | 696 | *From the Free Pascal wiki, page "TAChart Demos", as it stood on 2021-08-09 after a change by Wp, out of the wiki's dump of 2024-05-26. Copyright stays with the author who wrote it, according to the old wiki's [[Licensing]] page. If you have concerns about this material, [message the admin](/wiki-contact).* | |
| 503 | 697 | Category: Components | |
| 504 | 698 | Category: Lazarus | |
| 505 | 699 | Category: TAChart |