

Projects using Lazarus - Medical and Scientific software: what changed
Revision 0 to 1. Removed lines have a minus sign; added lines have a plus sign.
Title: Projects using Lazarus - Medical and Scientific software
| Old | New | Line | |
|---|---|---|---|
| 1 | + | ## CapaCalc | |
| 2 | + | ||
| 3 | + | The little application [CapaCalc](https://github.com/wp-xyz/CapaCalc) calculates the electrical capacitance of a variety of conductor arrangements: | |
| 4 | + | ||
| 5 | + | - Parallel plate capacitor | |
| 6 | + | - Spherical capacitor | |
| 7 | + | - Cylindrical capacitor | |
| 8 | + | - Capacitance between rectangular conductor and conducting plane | |
| 9 | + | - Capacitance between cylindrical conductor and conducting plane | |
| 10 | + | - Capacitance between two cylinders | |
| 11 | + | ||
| 12 | + | Moreover, the program calculates the | |
| 13 | + | ||
| 14 | + | - effective capacitance of capacitors in series and in parallel, as well as the | |
| 15 | + | - capacitance of a semiconductor p/n junction. | |
| 16 | + | ||
| 17 | + | <figure> | |
| 18 | + | <img src="capacalc_screenshot.png" title="capacalc_screenshot.png" width="400" /> | |
| 19 | + | <figcaption>capacalc_screenshot.png</figcaption> | |
| 20 | + | </figure> | |
| 21 | + | ||
| 22 | + | ## CheckMol/Matchmol | |
| 23 | + | ||
| 24 | + | [Checkmol](http://merian.pch.univie.ac.at/~nhaider/cheminf/cmmm.html) is a command-line utility program that reads molecular structure files in different formats and analyzes the input molecule for the presence of various functional groups and structural elements. At present, approximately 200 different functional groups are recognized. GPL licensed. | |
| 25 | + | ||
| 26 | + | [Matchmol](http://merian.pch.univie.ac.at/~nhaider/cheminf/cmmm.html) complements the capabilities of checkmol. It compares two (or more) molecular structures and determines whether one of them is a substructure of the other one. GPL licensed. | |
| 27 | + | ||
| 28 | + | ## Corona | |
| 29 | + | ||
| 30 | + | [Corona](https://github.com/wp-xyz/corona) downloads daily accumulated case counts of the corona virus disease from the 2019 Novel Coronavirus COVID-19 (2019-nCoV) data repository by Johns Hopkins University CSSE, and from Robert-Koch-Institut, Germany. | |
| 31 | + | ||
| 32 | + | - Displays the world-wide infection data in a color-coded map. | |
| 33 | + | - Scrolls through previous dates using the scrollbar below the map. | |
| 34 | + | - Plots the data as a function of time: confirmed, death, recovered, sick counts. Cumulative cases, new cases per day. | |
| 35 | + | - Estimates characteristic pandemic numbers: doubling time, reproduction number. (Disclaimer: due to various calculation methods, these numbers may differ from official data). | |
| 36 | + | ||
| 37 | + | <figure> | |
| 38 | + | <img src="corona-1.2.png" title="corona-1.2.png" width="400" /> | |
| 39 | + | <figcaption>corona-1.2.png</figcaption> | |
| 40 | + | </figure> | |
| 41 | + | ||
| 42 | + | ## CyberUnits | |
| 43 | + | ||
| 44 | + | [[CyberUnits]] is a collection of cross-platform units for medical cybernetics and systems biology. It supports [[Object Pascal]], S and Matlab. | |
| 45 | + | ||
| 46 | + | ## DataLogger | |
| 47 | + | ||
| 48 | + | [DataLogger](https://github.com/wp-xyz/datalogger) is a small application which reads measured values from a digital multimeter and plots them as a function of time. | |
| 49 | + | ||
| 50 | + | - Interfaces to some digital multimeters with digital output via serial port. Use a serial/usb converter if your computer does not have a serial input any more. | |
| 51 | + | - Supported models: Conrad VC630, VC820, VC830, VC840, VC850, or "user-defined" (based on the DMM chips FS9721_LP3 (seven-segment output) and FS9922-DMM4 (digit output) by Fortune Semiconductor) Measurement interval: a few measurements per second, or slower. Interval can be varied during the measurement. | |
| 52 | + | - Transformations: User-provided equation to convert the measured quantity to some other quantity. The application initially was written to convert the analog voltage output of a pressure meter to pressure in mBar. | |
| 53 | + | - Linear or logarithmic display of the measured quantity. | |
| 54 | + | - Add comments during the measurement to mark special events. The comments are displayed along with the measured data. | |
| 55 | + | - Save measured curve as xml, csv or spreadsheet files. Re-load and overlay previously measured curves. | |
| 56 | + | ||
| 57 | + | <figure> | |
| 58 | + | <img src="datalogger-main.png" title="datalogger-main.png" width="400" /> | |
| 59 | + | <figcaption>datalogger-main.png</figcaption> | |
| 60 | + | </figure> | |
| 61 | + | ||
| 62 | + | ## DMV | |
| 63 | + | ||
| 64 | + | [DMV](https://osf.io/4en3b/files/) The Diffusion Model allows for modelling response times. The Diffusion Model Visualizer explores the effect of the seven model parameters (a, z, v, t0, sz, sv, and st0) upon the response time density curves and positive/negative response probabilities. It supports interactive parameter change with immediate update of the diagram. The diagram can be stored to disk for further use (e.g., in an article or educational context). The program is freeware. | |
| 65 | + | ||
| 66 | + | <figure> | |
| 67 | + | <img src="dmv1_1.png" title="dmv1_1.png" width="400" /> | |
| 68 | + | <figcaption>dmv1_1.png</figcaption> | |
| 69 | + | </figure> | |
| 70 | + | ||
| 71 | + | For details regarding technical details and usage see: | |
| 72 | + | ||
| 73 | + | The diffusion model visualizer: an interactive tool to understand the diffusion model parameters. Psychological Research 84(4), 1157–1165. <https://doi.org/10.1007/s00426-018-1112-6> | |
| 74 | + | ||
| 75 | + | Update: A new version DMV 1.1 now also allows for modifying the within variance component s^2 with a slider along with further minor modifications and bug fixes. | |
| 76 | + | ||
| 77 | + | ## eLogSim | |
| 78 | + | ||
| 79 | + | [eLogSim](https://elogsim.sourceforge.io) is a digital circuit simulator with statistical fault simulation capability. | |
| 80 | + | ||
| 81 | + | <figure> | |
| 82 | + | <img src="Dual74161.png" title="Dual74161.png" width="400" /> | |
| 83 | + | <figcaption>Dual74161.png</figcaption> | |
| 84 | + | </figure> | |
| 85 | + | ||
| 86 | + | ## ePnR | |
| 87 | + | ||
| 88 | + | [ePnR](https://sourceforge.net/projects/epnr/) is a simple Integrated Circuit (IC) block standard cell placement & routing tool. ePnR currently supports only circuit blocks using equal height standard cells arranged in one or more channels of user configurable length. Standard cells are described in a simple text based library (compliant with eLogSim). Placement follows initially the cell call order in the SPICE like circuit input netlist. However, a placement optimization, aiming at minimum weighted accumulated wire length, by simulated annealing is available. Routing consists of channel routing as first step. If un-routed connections are left, Maze routing can (optionally) be applied. ePnR does not guarantee completely finished routing. However, un-routed connections will be left with rubberband connections and marked start and end points for subsequent manual routing using a third party layout editor. ePnR outputs in CIF 2.0 format readable by e.g. the free KLayout editor. Read more on [ePnR](https://sourceforge.net/projects/epnr/). | |
| 89 | + | ||
| 90 | + | <img src="64bitCarryAdder_preplaced.png" title="64bitCarryAdder_preplaced.png" width="400" alt="64bitCarryAdder_preplaced.png" /><img src="64bitCarryAdder_fullyrouted.png" title="64bitCarryAdder_fullyrouted.png" width="400" alt="64bitCarryAdder_fullyrouted.png" /> | |
| 91 | + | ||
| 92 | + | ## ezANOVA | |
| 93 | + | ||
| 94 | + | [ezANOVA](http://people.cas.sc.edu/rorden/ezanova/index.html) is a simple tool to calculate Analysis of Variance as well as pairwise comparisons. It is [open source](https://github.com/neurolabusc/ezANOVA). | |
| 95 | + | ||
| 96 | + | <figure> | |
| 97 | + | <img src="ezANOVAx.png" title="ezANOVAx.png" width="400" /> | |
| 98 | + | <figcaption>ezANOVAx.png</figcaption> | |
| 99 | + | </figure> | |
| 100 | + | ||
| 101 | + | ## Fertility Calendar | |
| 102 | + | ||
| 103 | + | [Fertility calendar](http://www.cvrk.com/mk/) with current year expectance, boy or girl presumption. Versions for Windows and MacOS. | |
| 104 | + | ||
| 105 | + | <figure> | |
| 106 | + | <img src="fercal.png" title="fercal.png" width="400" /> | |
| 107 | + | <figcaption>fercal.png</figcaption> | |
| 108 | + | </figure> | |
| 109 | + | ||
| 110 | + | ## Foobot Monitor | |
| 111 | + | ||
| 112 | + | - Foobot(http://foobot.io/) is an InternetOfThings gadget that monitors indoor air quality | |
| 113 | + | - Unfortunately, the company currently only supplies mobile phone apps to access the Foobot | |
| 114 | + | - They do however publish an API which returns JSON data when queried, so I decided to port it to the PC using Lazarus and FPC | |
| 115 | + | - Wiki Page: [[Foobot]] | |
| 116 | + | ||
| 117 | + | What you will need: A Foobot, a Foobot account, a free API Key (get one from the API page: <https://api.foobot.io/apidoc/index.html>) | |
| 118 | + | ||
| 119 | + | <img src="foobotmonitorscreenshot.jpg" title="foobotmonitorscreenshot.jpg" width="400" alt="foobotmonitorscreenshot.jpg" /> <img src="foobotmonitorscreenshot1.jpg" title="foobotmonitorscreenshot1.jpg" width="400" alt="foobotmonitorscreenshot1.jpg" /> | |
| 120 | + | ||
| 121 | + | ## FREE!ship Plus in Lazarus | |
| 122 | + | ||
| 123 | + | [FREE!ship Plus in Lazarus](https://github.com/markmal/freeship-plus-in-lazarus) is further development of the *FREE!ship Plus* Windows program based on the free source code FREE!ship v3.x under GNU GPL license. This *FREE!ship Plus* application is migrated into free open source Lazarus / Free Pascal environment to promote further development in various platforms and for various platforms (OS and architectures). | |
| 124 | + | ||
| 125 | + | *FREE!ship Plus* is designed for the full parametric analysis of resistance and power prediction for a ship and other calculations of hydrodynamics of vessels and underwater vehicles. *FREE!ship Plus* allows the designer to simulate and analyze condition of balance of a complex completely hull - rudders - keels - engine - propellers in different regimes and of service conditions of a ship. The analyzable system includes a hull, appendages, a propeller and the engine (i.e. resistance, power, a thrust and a torque), and also various service conditions (heaving, a wind, a shallow-water effect, a regime of tow / pushing, etc...). | |
| 126 | + | ||
| 127 | + | <figure> | |
| 128 | + | <img src="FreeShip+qt.png" title="FreeShip+qt.png" width="500" /> | |
| 129 | + | <figcaption>FreeShip+qt.png</figcaption> | |
| 130 | + | </figure> | |
| 131 | + | ||
| 132 | + | ## Grid InQuest II Coordinate Transformer | |
| 133 | + | ||
| 134 | + | The [Grid InQuest II](https://bitbucket.org/PaulFMichell/gridinquestii/downloads) desktop application and command line tools provide a means of transforming coordinates between global geodetic coordinates (ETRS89/WGS84) and the national systems of Great Britain and Ireland. It provides a fully three-dimensional transformation incorporating the latest geoid model (OSGM15) and the appropriate polynomial transformation model (OSTN15 or OSi/OSNI) for each of the projected coordinate systems. This was developed in Free Pascal and Lazarus by [Michell Computing](http://michellcomputing.co.uk/). It was commissioned jointly by the Land and Property Service of Northern Ireland, the Ordnance Survey of the Republic of Ireland and the Ordnance Survey of Great Britain. | |
| 135 | + | ||
| 136 | + | <figure> | |
| 137 | + | <img src="GIQ2.png" title="GIQ2.png" width="400" /> | |
| 138 | + | <figcaption>GIQ2.png</figcaption> | |
| 139 | + | </figure> | |
| 140 | + | ||
| 141 | + | ## GroundCAD | |
| 142 | + | ||
| 143 | + | [GroundCAD](https://sourceforge.net/projects/groundcad03/) is new 2D CAD software for land surveying. working under windows and linux. | |
| 144 | + | ||
| 145 | + | <img src="groundcad.jpg" title="groundcad.jpg" width="400" alt="groundcad.jpg" /> <img src="layermanager.jpg" title="layermanager.jpg" width="400" alt="layermanager.jpg" /> | |
| 146 | + | ||
| 147 | + | ## Harmonux | |
| 148 | + | ||
| 149 | + | [Harmonux 0.1.4](http://wiki.freepascal.org/User:MaxBorges) Harmonic Analysis. Enter a table and get the harmonic function for the table. With the graphic of the points of the table and the function. Open Source GNU/GPL, pre-compiled for Linux and Windows. | |
| 150 | + | ||
| 151 | + | <figure> | |
| 152 | + | <img src="hamonux14.png" title="hamonux14.png" width="400" /> | |
| 153 | + | <figcaption>hamonux14.png</figcaption> | |
| 154 | + | </figure> | |
| 155 | + | ||
| 156 | + | ## i6z Toolkit | |
| 157 | + | ||
| 158 | + | The [i6z Toolkit](https://github.com/pdudis/i6zToolkit) is a Graphical User Interface (GUI) application for handling IUCLID 6 archives (i6z). The IUCLID (International Uniform ChemicaL Information Database) software application is developed by the European Chemicals Agency (ECHA) in association with the Organisation for Economic Co-operation and Development (OECD). The **i6z Toolkit** allows users to manipulate such archives, mainly in the areas of previewing and file management/organisation. Conveniently, this is done without the need to run the IUCLID 6 application. | |
| 159 | + | ||
| 160 | + | <img src="i6zToolkit-Main_Window.png" title="i6zToolkit-Main_Window.png" width="600" alt="i6zToolkit-Main_Window.png" />. <img src="i6zToolkit-XML_Tree_View.png" title="i6zToolkit-XML_Tree_View.png" width="400" alt="i6zToolkit-XML_Tree_View.png" /> | |
| 161 | + | ||
| 162 | + | The **i6z Toolkit** is available for MS Windows, macOS, and Linux. | |
| 163 | + | ||
| 164 | + | ## LazBacterias | |
| 165 | + | ||
| 166 | + | [LazBacterias](http://code.google.com/archive/p/lazbacterias/) is a program to simulate the growth of bacterial cultures using the rules of Conway's Game of Life. | |
| 167 | + | ||
| 168 | + | ## LazStats | |
| 169 | + | ||
| 170 | + | [LazStats](https://openstat.info/LazStatsMain.htm) is a free statistical analysis program written in Lazarus by Bill Miller. It contains a large variety of parametric, nonparametric, multivariate, measurement, statistical process control, financial and other procedures. One can also simulate a variety of data for tests, theoretical distributions, multivariate data, etc. | |
| 171 | + | ||
| 172 | + | The most recent sources are available at [the Lazarus Code and Component Repository](https://sourceforge.net/p/lazarus-ccr/svn/HEAD/tree/applications/lazstats/). | |
| 173 | + | ||
| 174 | + | <figure> | |
| 175 | + | <img src="LazStats_ccr.png" title="LazStats_ccr.png" width="400" /> | |
| 176 | + | <figcaption>LazStats_ccr.png</figcaption> | |
| 177 | + | </figure> | |
| 178 | + | ||
| 179 | + | ## MRIcron | |
| 180 | + | ||
| 181 | + | [MRIcron](https://www.nitrc.org/projects/mricron/) is a NIH-funded opensource project that allows users to visualize and volume render medical images (MRI, CT, PET). It includes tools for lesion mapping, non parametric statistical analysis ([npm](http://www.mricro.com/npm/)), and conversion from the medical DICOM format to the scientific NIfTI format ([dcm2nii](http://www.mricro.com/mricron/dcm2nii.html)). It is available for Windows, Linux and macOS. | |
| 182 | + | ||
| 183 | + | <figure> | |
| 184 | + | <img src="mricron.jpg" title="mricron.jpg" width="400" /> | |
| 185 | + | <figcaption>mricron.jpg</figcaption> | |
| 186 | + | </figure> | |
| 187 | + | ||
| 188 | + | ## MRIcroGL | |
| 189 | + | ||
| 190 | + | [MRIcroGL](http://www.mccauslandcenter.sc.edu/mricrogl/) is an opensource project that uses the graphics card (using OpenGL) to visualize and volume render medical images. It is hosted on the [National Institutes of Health (NIH) Neuroimaging Informatics Tools and Resources Clearinghouse (NITRC)](http://www.nitrc.org/projects/mricrogl/). It can view images saved in NIfTI (.nii, .nii.gz, .hdr/.img), Bio-Rad Pic (.pic), NRRD, Philips (.par/.rec), ITK MetaImage (.mhd, .mha), AFNI (.head/.brik), Freesurfer (.mgh, .mgz), and many DICOM (extensions vary) formats. It is available for Windows, Linux and macOS. | |
| 191 | + | ||
| 192 | + | <img src="mricrogl_overlay.png" title="mricrogl_overlay.png" width="400" alt="mricrogl_overlay.png" /> <img src="mricrogl_visiblehuman.jpg" title="mricrogl_visiblehuman.jpg" width="400" alt="mricrogl_visiblehuman.jpg" /> | |
| 193 | + | ||
| 194 | + | ## Nest-o-Patch | |
| 195 | + | ||
| 196 | + | [Nest-o-Patch](https://sourceforge.net/projects/nestopatch/?source=navbar), software for the analysis of patch-clamp, two-electrode-voltage clamp and other electrophysiological data. Directly works with files created by HEKA Pulse or Patch-Master data aquisition software or with CSV and text files. Designed mostly for the analysis of single channel recordings, was nevertheless successfully used for whole-cell data analysis. Several academic papers were published with the use of this software. | |
| 197 | + | ||
| 198 | + | <img src="nest-o-patch_trace.png" title="nest-o-patch_trace.png" width="400" alt="nest-o-patch_trace.png" /> <img src="nest-o-patch_levels_analysis.png" title="nest-o-patch_levels_analysis.png" width="400" alt="nest-o-patch_levels_analysis.png" /> | |
| 199 | + | ||
| 200 | + | ## OctaveGUI | |
| 201 | + | ||
| 202 | + | [OctaveGUI](http://code.google.com/p/octave-gui/) is a(nother) GUI frontend for GNU Octave written fully in Free Pascal with Lazarus IDE, with the following feature goals: Cross platform (CPU, OS, and widgetset) - Portable - Small size - Fast execution & low memory consumption - Close interface to MATLAB. | |
| 203 | + | ||
| 204 | + | ## OpenSIMPLY | |
| 205 | + | ||
| 206 | + | [Project homepage](http://opensimply.org) OpenSIMPLY is an open source free simulation software based on discrete event simulation approach. The concept is suitable for a person of a different programming and simulation experience. Both blocks simulation and Simula-like simulation styles are available. Simula-models with some adaptation can be used as well. The project is supplied with detailed documentation, pop-up help and tutorial with executable examples. OpenSIMPLY can be used as a traffic simulation software, network simulation software and much more. 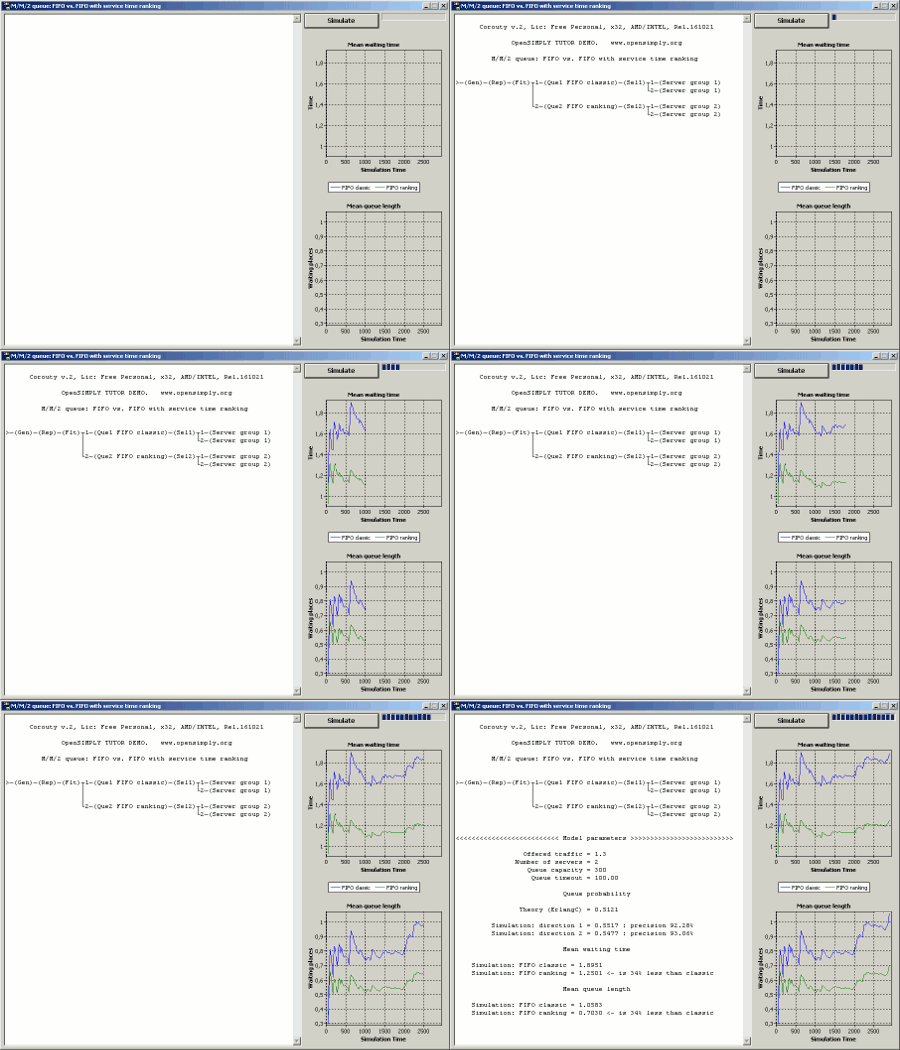 | |
| 207 | + | ||
| 208 | + | ## ProofTools | |
| 209 | + | ||
| 210 | + | [ProofTools](http://creativeandcritical.net/prooftools/) automatically and graphically generates semantic tableaux, also known as proof trees, semantic trees and analytic tableaux, generally used to test whether a formula is a logical truth, or whether a proof/argument is deductively valid. ProofTools can generate proof trees for propositional, predicate and (normal) modal logic. It is available for Windows, Linux and macOS. | |
| 211 | + | ||
| 212 | + | <figure> | |
| 213 | + | <img src="ProofTools.png" title="ProofTools screenshot|400px" /> | |
| 214 | + | <figcaption>ProofTools screenshot|400px</figcaption> | |
| 215 | + | </figure> | |
| 216 | + | ||
| 217 | + | ## SimSEE | |
| 218 | + | ||
| 219 | + | [SimSEE](https://simsee.org/simsee/simsee/) is a platform for Simulation of Systems of Electrical Energy. Using SimSEE we can simulate the optimal operation of systems with hydroelectrical plants, hydro-reservoirs, fuel fired plants, wind farms and interconnections with other countries. The platform has a very sophisticated tool for modelling stochastic processes like river inflows, fuel prices, wind speed, etc. The software was developed in Spanish but we are working to support other languages (help is welcome). | |
| 220 | + | ||
| 221 | + | ## SimThyr | |
| 222 | + | ||
| 223 | + | [SimThyr](http://simthyr.sourceforge.net/) is a simulation program for the pituitary thyroid feedback control that is based on a parametrically isomorphic model of the overall system. It aims in a better insight into the dynamics of thyrotropic feedback. Applications of this program cover research, including development of hypotheses, and education of students in biology and medicine, nurses and patients. | |
| 224 | + | ||
| 225 | + | <img src="Simthyr_mac_os_x_leopard.png" title="SimThyr for macOS" width="320" alt="SimThyr for macOS" /> <img src="pr.simthyr_suse_linux_11.jpg" title="SimThyr for Linux" width="320" alt="SimThyr for Linux" /> <img src="SimThyr_Win7.png" title="SimThyr for Windows" width="320" alt="SimThyr for Windows" /> | |
| 226 | + | ||
| 227 | + | ## SimulaBeta | |
| 228 | + | ||
| 229 | + | [SimulaBeta](https://sourceforge.net/projects/simulabeta/) is a numeric simulation program for insulin-glucose homeostasis. It uses the [[CyberUnits]] framework for simulating the biological information processing structure. SimulaBeta can be used to predict the evolution of insulin and glucose concentrations in steady-state fasting conditions, to study the effects of changes in structure parameters of the feedback loop (e.g. in certain diabetes mellitus types or other diseases) and to simulate the response of the processing structure to special function tests (e.g. intravenous and oral glucose tolerance testing). | |
| 230 | + | ||
| 231 | + | <img src="SimulaBeta_on_macOS_Ventura.jpeg" title="SimulaBeta for macOS" width="320" alt="SimulaBeta for macOS" /> <img src="SimulaBeta_3.1.2_on_macOS_Ventura.jpg" title="SimulaBeta 3.1.2 with LOREMOS on macOS Ventura" width="320" alt="SimulaBeta 3.1.2 with LOREMOS on macOS Ventura" /> | |
| 232 | + | ||
| 233 | + | ## SmallMap | |
| 234 | + | ||
| 235 | + | [SmallMap](http://akarwowski.pl/index.php?page=smallmap&lang=en) is a tool for creating vector maps using raster data as well as for processing spatial information. The application is based on Firebird database. It allows you to collect and process raster images and vector layers. Currently, the program works with spatial data in WGS84 system and WebMercator projection. It operates in two modes: preview and edition of objects. The default unit set in the program is one meter. | |
| 236 | + | ||
| 237 | + | <img src="FPW_SmallMap_02_1.png" title="FPW_SmallMap_02_1.png" width="400" alt="FPW_SmallMap_02_1.png" /> <img src="FPW_SmallMap_03_2.png" title="FPW_SmallMap_03_2.png" width="400" alt="FPW_SmallMap_03_2.png" /> | |
| 238 | + | ||
| 239 | + | ## SPINA | |
| 240 | + | ||
| 241 | + | [SPINA](http://spina.medical-cybernetics.de/en/) is software for determining constant structure-parameters of endocrine feedback control systems from hormone levels obtained in vivo. The first version of this cybernetic approach allows for evaluating the functional status of the thyroid gland. | |
| 242 | + | ||
| 243 | + | <figure> | |
| 244 | + | <img src="SPINA_Thyr_3.3_for_Mac_2.png" title="SPINA Thyr for macOS" width="400" /> | |
| 245 | + | <figcaption>SPINA Thyr for macOS</figcaption> | |
| 246 | + | </figure> | |
| 247 | + | ||
| 248 | + | ## SysLinea | |
| 249 | + | ||
| 250 | + | [SysLinea 0.1.2](http://wiki.freepascal.org/User:MaxBorges) Solves Linear Systems and calculates Linear and Non linear Regression. It gives the Pearson and Spearman coefficients of correlation and the t-test. Open Source GNU/GPL, pre-compiled for Linux and Windows. | |
| 251 | + | ||
| 252 | + | <figure> | |
| 253 | + | <img src="syslinea12.png" title="SysLinea 1.2 - Linear regression and non linear regression" width="400" /> | |
| 254 | + | <figcaption>SysLinea 1.2 - Linear regression and non linear regression</figcaption> | |
| 255 | + | </figure> | |
| 256 | + | ||
| 257 | + | ## Traverse Pro | |
| 258 | + | ||
| 259 | + | Traversing is the type of survey in which a number of connected survey lines form the framework and the directions and lengths of the survey lines are measured with the help of an angle measuring instrument respectively. Traverse Pro is a freeware for calculation of single loop traverse. Traverse Pro desktop application especially designed for Civil / Surveyor. [Download](https://www.priabroy.name/archives/sdm_downloads/traverse-pro-v2-63-build-6230-windows-64-bit). | |
| 260 | + | ||
| 261 | + | <img src="Traverse_Pro.png" title="Traverse_Pro.png" width="400" alt="Traverse_Pro.png" /> <img src="Traverse_Pro2.png" title="Traverse_Pro2.png" width="400" alt="Traverse_Pro2.png" /> | |
| 262 | + | ||
| 263 | + | ## Unified Life Models | |
| 264 | + | ||
| 265 | + | [ULM (Unified Life Models)](http://www.biologie.ens.fr/~legendre/ulm/ulm.html) is an open-source software enabling the simulation and analysis of deterministic and stochastic discrete time dynamical systems for population dynamics modeling. It works natively on Windows, Linux and macOS. | |
| 266 | + | ||
| 267 | + | Models are described using a simple declaration language, close to the mathematical formulation. The system can be studied interactively by means of simple commands, producing convenient graphics and numerical results. | |
| 268 | + | ||
| 269 | + | <figure> | |
| 270 | + | <img src="screenshot_ulm.png" title="screenshot_ulm.png" width="400" /> | |
| 271 | + | <figcaption>screenshot_ulm.png</figcaption> | |
| 272 | + | </figure> | |
| 273 | + | ||
| 274 | + | ## UnitConv | |
| 275 | + | ||
| 276 | + | [UnitConv](https://github.com/wp-xyz/UnitConv) converts units of measurement data: Length, area, volume, mass, time, speed, acceleration, force, flow rate, pressure, temperature, energy, power, magnetic field, ozone concentration, angle, data volume. | |
| 277 | + | ||
| 278 | + | <figure> | |
| 279 | + | <img src="UnitConv.png" title="UnitConv.png" width="400" /> | |
| 280 | + | <figcaption>UnitConv.png</figcaption> | |
| 281 | + | </figure> | |
| 282 | + | ||
| 283 | + | ## Woodland Potential Calculator | |
| 284 | + | ||
| 285 | + | The Forestry Commission and Natural England commissioned a bespoke data collection and presentation tool for calculating the potential for increasing the extent of tree cover across England. It is written entirely in FreePascal using the Lazarus IDE, the LCL and the Graphics32 library. WoodlandCalc is released under the LGPL v2 open source licence and freely available for download from SourceForge. [More info...](http://www.michellcomputing.co.uk/woodlandcalc.html). Application [Download](http://sourceforge.net/projects/woodlandcalc/files/latest/download). | |
| 286 | + | ||
| 287 | + | <figure> | |
| 288 | + | <img src="woodlandcalcoverview.jpg" title="woodlandcalcoverview.jpg" width="400" /> | |
| 289 | + | <figcaption>woodlandcalcoverview.jpg</figcaption> | |
| 290 | + | </figure> | |
| 291 | + | ||
| 292 | + | ## Xoctave | |
| 293 | + | ||
| 294 | + | [Xoctave](http://www.xoctave.com/) is a Human interface to GNU Octave. Xoctave encapsulates GNU Octave uses pipes and provides extra useful tools to make GNU Octave more easier to use. XOctave is written in Pascal using Lazarus front-end and Free Pascal (aka FPK Pascal) libraries. It uses synedit for syntax highlighting, and uses the Lazarus Component Library (LCL) is a set of visual and non-visual component classes over a Widget toolkit-dependent layer with multi-language support (English-Turkish) | |
| 295 | + | ||
| 296 | + | <figure> | |
| 297 | + | <img src="xoctave.png" title="xoctave.png" width="400" /> | |
| 298 | + | <figcaption>xoctave.png</figcaption> | |
| 299 | + | </figure> | |
| 300 | + | ||
| 301 | + | --- | |
| 302 | + | *From the Free Pascal wiki, page "Projects using Lazarus - Medical and Scientific software", as it stood on 2023-06-30 after a change by Jwdietrich, out of the wiki's dump of 2024-05-26. Copyright stays with the author who wrote it, according to the old wiki's [[Licensing]] page. If you have concerns about this material, [message the admin](/wiki-contact).* | |
| 303 | + | Category: Lazarus | |
| 304 | + | Category: Promotion | |
| 305 | + | Category: Software created with Lazarus | |
| 306 | + | Category: Software written in Free Pascal |