

Profiling: what changed
Revision 3 to 4. Removed lines have a minus sign; added lines have a plus sign.
| Old | New | Line | |
|---|---|---|---|
| 1 | 1 | **Profiling** is a performance analysis technique that can be used to find bottlenecks in your application. In particular it encompasses measuring the frequency and duration of function calls. | |
| 2 | 2 | ||
| 3 | 3 | ## Profiling and optimization | |
| 4 | 4 | ||
| 5 | 5 | Profiling can help to identify “critical” parts of your code, whose optimization could seriously improve the performance of your program. It is done best at times when you are preparing for a release and having a feature-freeze for your code. It is a waste of time and resources to optimize something that will be thrown away the next day during some code restructuring. | |
| 6 | 6 | ||
| 7 | 7 | Be careful not to over-optimize your program. It is seldom worth it to spent days on getting only a 2% performance gain. It is mostly cutting down run-time with 30% in just half an hour of coding a few optimizations that will pay off. | |
| 8 | 8 | ||
| 9 | 9 | Of course optimizing code that is reused very often is worth a little more effort for performance gain. | |
| 10 | 10 | ||
| 11 | 11 | ## Free Pascal profiler support | |
| 12 | 12 | ||
| 13 | 13 | Free Pascal has built-in support for generating executables suitable for (at least) two profilers: | |
| 14 | 14 | ||
| 15 | 15 | - **gprof**, the Gnu Profiler: enable with `-pg`. | |
| 16 | 16 | - **Availability**: Most FPC target platforms | |
| 17 | 17 | - **Notes**: | |
| 18 | 18 | - Support for using gprof under Linux is broken in FPC 2.2.0-2.4.0; it is fixed in FPC 2.6+ | |
| 19 | 19 | - Under Windows, additional libraries are required to get gprof support working; | |
| 20 | 20 | - **Valgrind**, using the plug-in Callgrind: enable with `-gv`. | |
| 21 | 21 | - **Availablility**: Linux, Mac OS X 10.5 (10.6 in Valgrind development versions), and some other UNIXes. | |
| 22 | 22 | - **Notes** | |
| 23 | 23 | - Should work fine on all platforms supported by Valgrind, as it does not require any compiler support (other than that the profiled program should be dynamically linked, and that the compiler should not generate certain kinds of debug information -- both issues are taken care of by the `-gv` option) | |
| 24 | 24 | - The `-gv` option implicitly includes the [[CMem]] unit; thus you need to remove it from your uses clause | |
| 25 | 25 | ||
| 26 | 26 | There's also an FPC native profiler project called [[FPProfiler]]. Because the profiler is native to FPC it should work on all platforms that FPC supports. | |
| 27 | 27 | ||
| 28 | 28 | A Lazarus IDE addon which enables you to profile your project with one click is also available: [[LazProfiler]] | |
| 29 | 29 | ||
| 30 | 30 | ## Using Valgrind/Callgrind | |
| 31 | 31 | ||
| 32 | 32 | Valgrind was originally only a memory debugger, but now it also supports e.g. profiling using the Callgrind plug-in (which has replaced the Calltree plugin). To install Valgrind with Callgrind on Debian, run e.g. | |
| 33 | 33 | ||
| 34 | - | ||
| 34 | + | ```text | |
| 35 | + | aptitude install valgrind valgrind-callgrind | |
| 36 | + | ``` | |
| 35 | 37 | ||
| 36 | 38 | To profile your program, you need to do three steps: | |
| 37 | 39 | ||
| 38 | 40 | - Compile your program with the `-gv` switch. | |
| 39 | 41 | - Run your program using `valgrind` | |
| 40 | 42 | - Analyze the output with `valgrind_annotate` or the GUI tool `KCacheGrind` | |
| 41 | 43 | ||
| 42 | 44 | Compile your program with | |
| 43 | 45 | ||
| 44 | - | ||
| 46 | + | ```text | |
| 47 | + | fpc -gv myprogram.pas | |
| 48 | + | ``` | |
| 45 | 49 | ||
| 46 | 50 | Run Valgrind using e.g. | |
| 47 | 51 | ||
| 48 | - | ||
| 52 | + | ``` pascal | |
| 53 | + | valgrind --tool=callgrind ./myprogram --options --to --my --program | |
| 54 | + | ``` | |
| 49 | 55 | ||
| 50 | 56 | You can also profile only specific parts of your program. For example you can start the program with | |
| 51 | 57 | ||
| 52 | - | ||
| 58 | + | ``` pascal | |
| 59 | + | valgrind --tool=callgrind --instr-atstart=no ./myprogram --options --to --my --program | |
| 60 | + | ``` | |
| 53 | 61 | ||
| 54 | 62 | At the moment you want actual profiling to start, run | |
| 55 | 63 | ||
| 56 | - | ||
| 64 | + | ```text | |
| 65 | + | callgrind_control -i on | |
| 66 | + | ``` | |
| 57 | 67 | ||
| 58 | 68 | To stop the profiling, run the same command with `off` instead of `on`. To get only profiling information when you are inside a particular function, you can pass the `--toggle-collect=funcNamePrefix` option to valgrind. Refer to the Valgrind documentation for further details. | |
| 59 | 69 | ||
| 60 | 70 | Callgrind has created a trace file with a typical name like `callgrind.out.12345`. To get a human-readable statistical report, run e.g. | |
| 61 | 71 | ||
| 62 | - | ||
| 72 | + | ```text | |
| 73 | + | callgrind_annotate callgrind.out.12345 | |
| 74 | + | ``` | |
| 63 | 75 | ||
| 64 | 76 | Of course you can also experiment with the other tool plug-ins that ship with Valgrind. Cachegrind, for example, profiles the cache use. Other plug-ins can be used to profile or debug memory allocation or detect data race conditions. | |
| 65 | 77 | ||
| 66 | 78 | ## Using KCacheGrind | |
| 67 | 79 | ||
| 68 | 80 | Though the output of `callgrind_annotate` can definitely shed some light on the performance characteristics of your program, the GUI tool KCacheGrind can give you even more interesting information, presented in different forms: caller/callee lists, caller/callee maps ans call graphs. To install it on Debian, run | |
| 69 | 81 | ||
| 70 | - | ||
| 82 | + | ```text | |
| 83 | + | aptitude install kcachegrind graphviz | |
| 84 | + | ``` | |
| 71 | 85 | ||
| 72 | 86 | (The `graphviz` package is required if you want KCacheGrind to generate call graphs.) | |
| 73 | 87 | ||
| 74 | 88 | 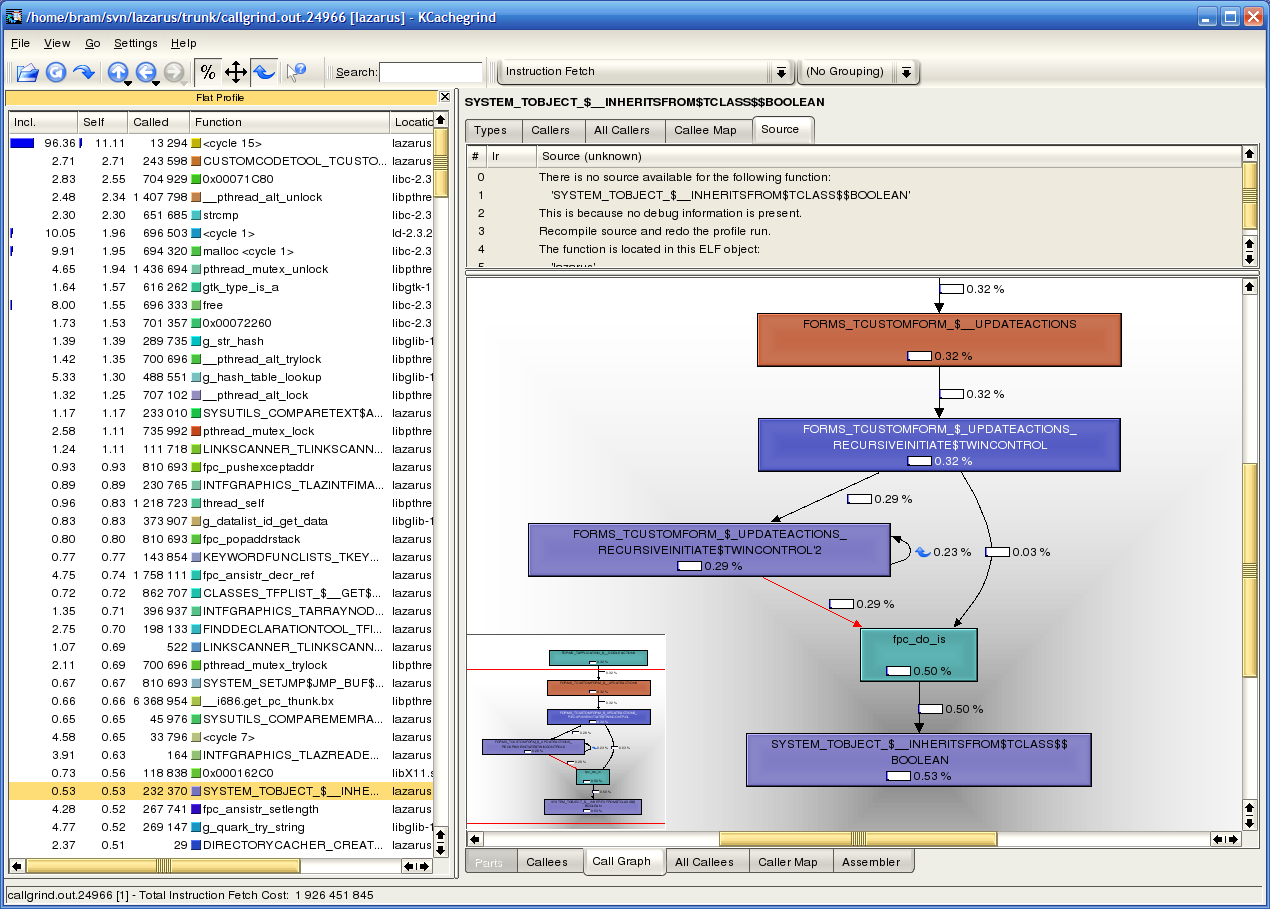 | |
| 75 | 89 | ||
| 76 | 90 | Run KCachegrind with a simple call to `kcachegrind`. You can now open a trace file using the GUI and all should be self-explanatory. | |
| 77 | 91 | ||
| 78 | 92 | On the left, you will see a 'flat profile', which list for each function (in the top 100) | |
| 79 | 93 | ||
| 80 | 94 | - Incl: amount of time spent in the function, *including* callees (functions called by the function). | |
| 81 | 95 | - Self: amount of time spent within the function itself, *excluding* callees. | |
| 82 | 96 | - Called: the number of the times the function has been called. | |
| 83 | 97 | ||
| 84 | 98 | *Note:* if you click on one of the column headers to sort the list, you might need to do a reload (F5) to ensure that the top 100 *with respect to that column* will be shown. Another hint: in the configuration options, you can make the list longer than only the top 100. | |
| 85 | 99 | ||
| 86 | 100 | > **Note:** "Time" in valgrind/callgrind is based on instructions/cycles executed. It is not exact. A CPU executing a function in real life (outside the profiler) may sometimes spent less time for more cycles. | |
| 87 | 101 | ||
| 88 | 102 | On the right, you'll see a number of tabs, allowing you to see lists and maps of callers and callees, as well as a caller graph, which is very useful to see in a glance who calls whom the most. | |
| 89 | 103 | ||
| 90 | 104 | ## Memory Profiling | |
| 91 | 105 | ||
| 92 | 106 | ### Heaptrc, LineInfo | |
| 93 | 107 | ||
| 94 | 108 | To spot memory leaks, simply compile with -gh. This will compile as if you added the **heaptrc** unit as first unit to the uses section of your program. Heaptrc links into the memory manager of fpc and checks various things. Together with the -gl option (adding the lineinfo unit) it will give you useful information and backtraces, where a memory block was allocated. It supports some options that can be controlled via environment option *HEAPTRC* containing keywords: | |
| 95 | 109 | ||
| 96 | 110 | - keepreleased: Any freed memory, is kept and checked if overwritten. | |
| 97 | 111 | - disabled: disable tracing. This is useful for program compiled with heaptrc and should work normally. | |
| 98 | 112 | - nohalt: normally heaptrc stops on the first error it finds. Add this keyword if the program should continue (as it would normally do without heaptrc). | |
| 99 | 113 | - haltonnotreleased: Normally heaptrc prints for every not freed block a backtrace, which can take a long time. Add this keyword to stop after first reported mem leak. | |
| 100 | 114 | - log=\<filename\>: Instead of writing to stdout, you can give a log filename. | |
| 101 | 115 | ||
| 102 | 116 | Note: **heaptrc** will conflict with **cmem** if you have to debug external libraries. Valgrind should be used in this case. | |
| 103 | 117 | ||
| 104 | 118 | ### Valgrind Memcheck | |
| 105 | 119 | ||
| 106 | 120 | There are mem leaks which heaptrc does not find. The valgrind program has a tool called memcheck, which does a lot more bookkeeping than heaptrc and finds some more bugs. The drawback is that valgrind is snail slow, so do this only if heaptrc could not help you. Here is an example: | |
| 107 | 121 | ||
| 108 | - | ||
| 122 | + | ```text | |
| 123 | + | valgrind --tool=memcheck --leak-check=summary --log-file=log.txt ./project1 | |
| 124 | + | ``` | |
| 109 | 125 | ||
| 110 | 126 | The log.txt will almost always find something, because it tries to check the used external libraries too and some common libraries are badly coded. | |
| 111 | 127 | ||
| 112 | 128 | To get even more information run with | |
| 113 | 129 | ||
| 114 | - | ||
| 130 | + | ```text | |
| 131 | + | valgrind --tool=memcheck --leak-check=full --log-file=log.txt --show-reachable=yes --num-callers=50 ./project1 | |
| 132 | + | ``` | |
| 115 | 133 | ||
| 116 | 134 | How to run massif: | |
| 117 | 135 | ||
| 118 | - | ||
| 136 | + | ```text | |
| 137 | + | valgrind --tool=massif --run-libc-freeres=no ./project1 | |
| 138 | + | ``` | |
| 119 | 139 | ||
| 120 | 140 | ## On macOS | |
| 121 | 141 | ||
| 122 | 142 | Most of what is said above for Linux also applies on macOS. gprof is however not supported by FPC on Darwin/i386 and on Darwin/ARM at this time. | |
| 123 | 143 | ||
| 124 | 144 | ### Instruments | |
| 125 | 145 | ||
| 126 | 146 | Instruments is a powerful performance analysis and testing tool that's part of Xcode toolset. Instruments can help you profile your apps on all platforms - iOS, macOS, watchOS, tvOS - in order to better understand and optimize their behavior and performance. | |
| 127 | 147 | ||
| 128 | 148 | From Xcode's product menu, choose Profile. Although Instruments is embedded within and is often used with Xcode, Instruments is a separate app which may be used independently as needed. For example: | |
| 129 | 149 | ||
| 130 | - | ||
| 150 | + | ```text | |
| 151 | + | open -a /Applications/Xcode.app/Contents/Applications/Instruments.app | |
| 152 | + | ``` | |
| 131 | 153 | ||
| 132 | 154 | Apple documentation links: | |
| 133 | 155 | ||
| 134 | 156 | - [Instruments Help](https://help.apple.com/instruments/mac/current/). | |
| 135 | 157 | - [Getting Started with Instruments](https://developer.apple.com/videos/play/wwdc2019/411/) - WWDC 2019 Video | |
| 136 | 158 | - [Creating Custom Instruments](https://developer.apple.com/videos/play/wwdc2018/410/) - WWDC 2018 Video | |
| 137 | 159 | ||
| 138 | 160 | ### Shark | |
| 139 | 161 | ||
| 140 | 162 | > **Note:** Since macOS Lion 10.7, Shark is not on the Apple site any more and was replaced by Instruments above. | |
| 141 | 163 | ||
| 142 | 164 | Shark is a sampling-based profiler. It supports time profiles, profiles based on performance counters (such as L2 cache misses), application-specific profiles and whole-system profiles. By default, it's installed at /Developer/Applications/Performance Tools/Shark.app | |
| 143 | 165 | ||
| 144 | 166 | If you compile the profiled code with debug information (either Stabs or DWARF), Shark will display the (Pascal) source code in addition to the assembler code. | |
| 145 | 167 | ||
| 146 | 168 | Shark only works for i386 and PowerPC. For 64 bit platforms, you have to use Instruments.app instead, which offers similar functionality. | |
| 147 | 169 | ||
| 148 | 170 | ### spindump | |
| 149 | 171 | ||
| 150 | 172 | The macOS `spindump` utility can be used with the `-timeline` option to sample and profile your application in order to determine which QoS class applies as a specific portion of code executes at a given time. For more details, see the manual page by opening an Applications \> Utilities \> Terminal and typing `man spindump`. | |
| 151 | 173 | ||
| 152 | 174 | ### Valgrind | |
| 153 | 175 | ||
| 154 | 176 | Valgrind has been ported to AMD64/macOS 10.12 (Sierra). There is also preliminary support for X86/macOS 10.13, AMD64/macOS 10.13 (High Sierra). For current details, check valgrind's [homepage](http://valgrind.org/). | |
| 155 | 177 | ||
| 156 | 178 | If you experience the following issue: | |
| 157 | 179 | ||
| 158 | - | ||
| 180 | + | ```text | |
| 181 | + | valgrind: ./test: cannot execute binary file | |
| 182 | + | ``` | |
| 159 | 183 | ||
| 160 | 184 | Chances are that your valgrind only supports 64 bit while your FPC program is compiled for 32 bit. To make your application compatible simply add the switch **-Px86_64**. | |
| 161 | 185 | ||
| 162 | 186 | ### FPProfiler | |
| 163 | 187 | ||
| 164 | 188 | FPProfiler has been ported to macOS as a fink package. For details see here: [[FPProfiler]] | |
| 165 | 189 | ||
| 166 | 190 | ## Simple profiling using ifdefs and timing routines | |
| 167 | 191 | ||
| 168 | 192 | Another, simpler, way of profiling is simply adding ifdefs and time counting. For counting the time the simples way is just using Now() from SysUtils. Other possibilities are NowUTC() from lazutf8sysutils or [[EpikTimer]]. | |
| 169 | 193 | ||
| 170 | 194 | For example, to profile the following procedure: | |
| 171 | 195 | ||
| 172 | 196 | ``` pascal | |
| 173 | 197 | procedure TMyClass.DoSomething; | |
| 174 | 198 | begin | |
| 175 | 199 | ReallyDoSomething; | |
| 176 | 200 | end; | |
| 177 | 201 | ``` | |
| 178 | 202 | ||
| 179 | 203 | One would add the following extra code around it: | |
| 180 | 204 | ||
| 181 | 205 | ``` pascal | |
| 182 | 206 | function DateTimeToMilliseconds(aDateTime: TDateTime): Int64; | |
| 183 | 207 | var | |
| 184 | 208 | TimeStamp: TTimeStamp; | |
| 185 | 209 | begin | |
| 186 | 210 | {Call DateTimeToTimeStamp to convert DateTime to TimeStamp:} | |
| 187 | 211 | TimeStamp:= DateTimeToTimeStamp (aDateTime); | |
| 188 | 212 | {Multiply and add to complete the conversion:} | |
| 189 | 213 | Result:= TimeStamp.Time; | |
| 190 | 214 | end; | |
| 191 | 215 | ||
| 192 | 216 | procedure TMyClass.DoSomething; | |
| 193 | 217 | var | |
| 194 | 218 | {$IFDEF VerboseProfiler} | |
| 195 | 219 | lTimeStart: TDateTime; | |
| 196 | 220 | {$ENDIF} | |
| 197 | 221 | ... | |
| 198 | 222 | begin | |
| 199 | 223 | {$IFDEF VerboseProfiler} | |
| 200 | 224 | lTimeStart := Now(); | |
| 201 | 225 | {$ENDIF} | |
| 202 | 226 | ||
| 203 | 227 | ReallyDoSomething; | |
| 204 | 228 | ||
| 205 | 229 | {$IFDEF VerboseProfiler} | |
| 206 | 230 | DebugLn(Format('[TMyClass.DoSomething] Duration: %d ms', [DateTimeToMilliseconds(Now() - lTimeStart)])); | |
| 207 | 231 | {$ENDIF} | |
| 208 | 232 | end; | |
| 209 | 233 | ``` | |
| 210 | 234 | ||
| 211 | 235 | Activate the define to get the debug info in the [[DebugLn]] target. | |
| 212 | 236 | ||
| 213 | 237 | --- | |
| 214 | 238 | *From the Free Pascal wiki, page "Profiling", as it stood on 2021-11-07 after a change by Trev, out of the wiki's dump of 2024-05-26. Copyright stays with the author who wrote it, according to the old wiki's [[Licensing]] page. If you have concerns about this material, [message the admin](/wiki-contact).* |