

PlotPanel: what changed
Revision 1 to 2. Removed lines have a minus sign; added lines have a plus sign.
| Old | New | Line | |
|---|---|---|---|
| 1 | 1 | > **Warning:** Currently, PlotPanel is not in active development and is maintained for compatibility only. Please consider using [[TAChart documentation|Functional series]] of [[TAChart]] package instead. | |
| 2 | 2 | ||
| 3 | 3 | ## Plotpanel | |
| 4 | 4 | ||
| 5 | 5 | PlotPanel is a component for Lazarus to replace (more or less) the TChart component. With some modification it can also be used with Kylix, Delphi 5, 6 or 7. | |
| 6 | 6 | ||
| 7 | 7 | With PlotPanel you can draw line- , dot- and bar-graphs. Animated graphs are also possible. | |
| 8 | 8 | ||
| 9 | 9 | This software is presented as is, without any written warranty. So use the software at your own risk. | |
| 10 | 10 | ||
| 11 | 11 | ### Screenshot | |
| 12 | 12 | ||
| 13 | - | ||
| 14 | - | ||
| 15 | - | ||
| 16 | - | ||
| 13 | + | 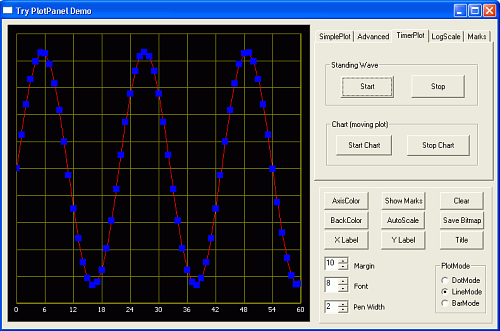 | |
| 17 | 14 | ||
| 18 | 15 | ## Installation | |
| 19 | 16 | ||
| 20 | 17 | To Install the PlotPanel component in Lazarus you have to do the following: | |
| 21 | 18 | ||
| 22 | 19 | - Download the PlotPanelpackage (plotpanel.zip) from: <http://science4all.nl/?Programming:MICAM:Lazarus> or from [Lazarus CCR SourceForge site](http://sourceforge.net/project/showfiles.php?group_id=92177&package_id=181065). | |
| 23 | 20 | - Unzip plotpanel.zip in a directory of your choice. | |
| 24 | 21 | - Start Lazarus | |
| 25 | 22 | - Perform the necessairy actions to intall the package (see [[Install Packages]]). | |
| 26 | 23 | ||
| 27 | 24 | After you have done that all, there must be a new Tab in the component palet with the name "Extra". You can use the Plotpanel now | |
| 28 | 25 | ||
| 29 | 26 | Run the PlotPanelDemo to explore the features of PlotPanel. N.B. You can try PlotPanel without installing the component by running TryPlotPanel! | |
| 30 | 27 | ||
| 31 | 28 | '''There was a problem with Plotpanel in Lazarus 0.9.28.x | |
| 32 | 29 | ||
| 33 | 30 | **On my website (http://science4all.nl/?Programming:MICAM:Lazarus) you can find the updated version: PlotPanel-0.97** | |
| 34 | 31 | ||
| 35 | 32 | ## Description of the PlotPanel component | |
| 36 | 33 | ||
| 37 | 34 | This is a very rude description of the component. See the examples for an explanation of how to use the component. The PlotPanel component is derived from the TCustomPanel-component. To this Panel plotting capabilities are added. | |
| 38 | 35 | ||
| 39 | 36 | ## Properties inherited from TCustomPanel | |
| 40 | 37 | ||
| 41 | 38 | ||
| 42 | 39 | Align, Anchors, Autosize, BevelInner / Outer / Width | |
| 43 | 40 | ||
| 44 | 41 | Borderspacing, BorderStyle, Borderwidth | |
| 45 | 42 | ||
| 46 | 43 | Color is the color of the border of the plot | |
| 47 | 44 | ||
| 48 | 45 | Constraints, Cursor, Dragmode, Enabled | |
| 49 | 46 | ||
| 50 | 47 | Font is the font of the title of the plot | |
| 51 | 48 | ||
| 52 | 49 | Height, HelpContext, HelpKeyword, HelpType, Hint | |
| 53 | 50 | ||
| 54 | 51 | Left, Name, ParenColor, Parentfont, ParentShowHint | |
| 55 | 52 | ||
| 56 | 53 | PopupMenu, ShowHint, TabOrder, TabStop | |
| 57 | 54 | ||
| 58 | 55 | Tag, Top, Visible, Width | |
| 59 | 56 | ||
| 60 | 57 | ## The following properties are added | |
| 61 | 58 | ||
| 62 | 59 | ||
| 63 | 60 | **BackColor**This is the background color of the plotting area | |
| 64 | 61 | ||
| 65 | 62 | **GridColor**When you make this the same as Backcolor, the grid is invisible | |
| 66 | 63 | ||
| 67 | 64 | **LayerOption**For easy plotting of a single layer this can be set to False. It is not possible to set this to True directly (see methods) | |
| 68 | 65 | ||
| 69 | 66 | **Margin** The width of the border of the plot in pixels | |
| 70 | 67 | ||
| 71 | 68 | **PlotMode** Three plotmodes are possible: pmBar, pmLine and pmDot | |
| 72 | 69 | ||
| 73 | 70 | **PlotPen** Properties of the plotting pen. If LayerOption is False, then all sub-properties can be set. If LayerOption is True, then information about the plotting pen is transferred via the LayerOptions method (methods) | |
| 74 | 71 | ||
| 75 | 72 | **Title** The Title is at the top center of the plot and uses the Font property | |
| 76 | 73 | ||
| 77 | 74 | **PlotBMP** This is a bitmap holding the whole graph (see demo for its use) | |
| 78 | 75 | ||
| 79 | 76 | **The X-axis properties:** | |
| 80 | 77 | ||
| 81 | 78 | ||
| 82 | 79 | **XLabel** Label at the X-axis | |
| 83 | 80 | ||
| 84 | 81 | **XMarks** When True, the X-axis has marks | |
| 85 | 82 | ||
| 86 | 83 | **XMarksFont** Font used for the XMarks | |
| 87 | 84 | ||
| 88 | 85 | **XMarksInterval** Interval between to lines in the grid (applies for linear scales only) | |
| 89 | 86 | ||
| 90 | 87 | **XMax** Maximum value of X that is visible | |
| 91 | 88 | ||
| 92 | 89 | **XMin**Minimal value of X that is visible | |
| 93 | 90 | ||
| 94 | 91 | **XScaleLog**When TRUE the scale is logarithmic (the interval is determined by the component) | |
| 95 | 92 | ||
| 96 | 93 | **For the Y-axis the same applies.** | |
| 97 | 94 | ||
| 98 | 95 | ## Methods: | |
| 99 | 96 | ||
| 100 | 97 | **AddXY(X,Y:Extended)** | |
| 101 | 98 | ||
| 102 | 99 | ` With this method you can add points (or lines) to the plot`\ | |
| 103 | 100 | ` Example`\ | |
| 104 | 101 | ` for i:= -10 to 10 do`\ | |
| 105 | 102 | ` PlotPanel1.AddXY(i,i*i)`\ | |
| 106 | 103 | ` This plots a parbola .The line is plotted with the PlotPen properties`\ | |
| 107 | 104 | ` Note you can only plot a single layer.` | |
| 108 | 105 | ||
| 109 | 106 | **AddXY(X,Y:Extended, Color:Tcolor,Layer:Integer)** | |
| 110 | 107 | ||
| 111 | 108 | ` With this method it is possible to plot up to 8 lines in different colors,`\ | |
| 112 | 109 | ` plotmodes and penwidths (see LayerOptions how to set linewidth and plotmodes)` | |
| 113 | 110 | ||
| 114 | 111 | **LayerOptions(Layer:Integer;PlotMode:TPlotMode;PenWidth:Integer)** | |
| 115 | 112 | ||
| 116 | 113 | ` Every Layer can use a different Plotmode and PenWidth`\ | |
| 117 | 114 | ` When you call this method LayerOPtion will be set TRUE. When you want`\ | |
| 118 | 115 | ` to use a single Layer again you have to set LayerOption False!` | |
| 119 | 116 | ||
| 120 | 117 | **Autoscale(Layer:Integer)** | |
| 121 | 118 | ||
| 122 | 119 | ` With this method you can adjust the size of the plot automaticly` | |
| 123 | 120 | ||
| 124 | 121 | **ClearData** | |
| 125 | 122 | ||
| 126 | 123 | ` Clears the data on the plot.` | |
| 127 | 124 | ||
| 128 | 125 | **ConvertS2W(x,y: Extended; var WX,WY : Extended)** | |
| 129 | 126 | ||
| 130 | 127 | ` Converts the screen-coordinates in X,Y to the real coordinates WX,WY. When`\ | |
| 131 | 128 | ` X and Y are out of bounds, the function returns False, otherwise True` | |
| 132 | 129 | ||
| 133 | 130 | **Freeze(Boolean)** | |
| 134 | 131 | ||
| 135 | 132 | ` When Freeze(True) is executed all plotting is done on a invisible bitmap.`\ | |
| 136 | 133 | ` After a Freeze(False) the whole plot is displayed. This produces flicker-free`\ | |
| 137 | 134 | ` animations.` | |
| 138 | 135 | ||
| 139 | 136 | **HideLayer(Layer:Integer)** | |
| 140 | 137 | ||
| 141 | 138 | ` Use this to hide a single layer in the plot` | |
| 142 | 139 | ||
| 143 | 140 | **UnHideLayer(Layer:Integer)** | |
| 144 | 141 | ||
| 145 | 142 | ` Shows the hidden layer again`\ | |
| 146 | 143 | ` N.B. When you add points to a hidden layer, the old layer is deleted and the`\ | |
| 147 | 144 | ` new points are the only points in this layer!` | |
| 148 | 145 | ||
| 149 | 146 | **Paint** | |
| 150 | 147 | ||
| 151 | 148 | ` Repaints the whole Graph (is done automaticly by the system when necessairy)` | |
| 152 | 149 | ||
| 153 | 150 | Marien van Westen | |
| 154 | 151 | ||
| 155 | 152 | --- | |
| 156 | 153 | *From the Free Pascal wiki, page "PlotPanel", as it stood on 2016-07-18 after a change by Arent, out of the wiki's dump of 2024-05-26. Copyright stays with the author who wrote it, according to the old wiki's [[Licensing]] page. If you have concerns about this material, [message the admin](/wiki-contact).* | |
| 157 | 154 | Category: Charting | |
| 158 | 155 | Category: Components | |
| 159 | 156 | Category: Graphics |