

PlotPanel/zh CN: what changed
Revision 1 to 2. Removed lines have a minus sign; added lines have a plus sign.
| Old | New | Line | |
|---|---|---|---|
| 1 | 1 | ## Plotpanel | |
| 2 | 2 | ||
| 3 | 3 | *目前,PlotPanel不在积极开发和维护,只提供兼容性。* | |
| 4 | 4 | ||
| 5 | 5 | *请考虑使用 [[TAChart/zh CN|TAChart]] 包中的[[TAChart documentation|相应功能]]。* | |
| 6 | 6 | ||
| 7 | 7 | PlotPanel是Lazarusk中用来代替(或多或少)TChart的组件。 通过一些修改可以在Kylix、Delphi 5、6、7中使用。 | |
| 8 | 8 | ||
| 9 | 9 | PlotPanel可以画线、点和条形图。也可以做动画图形。 | |
| 10 | 10 | ||
| 11 | 11 | 软件没有任何书面保证,所以使用时需要您自担风险。 | |
| 12 | 12 | ||
| 13 | 13 | ### 屏幕截图 | |
| 14 | 14 | ||
| 15 | - | ||
| 16 | - | ||
| 17 | - | ||
| 18 | - | ||
| 15 | + | 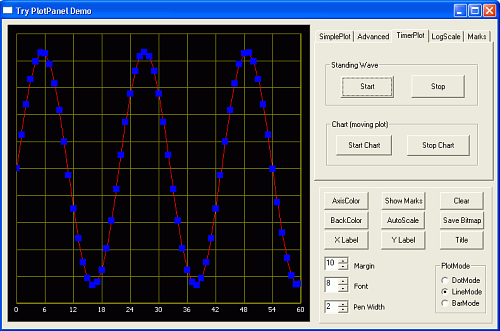 | |
| 19 | 16 | ||
| 20 | 17 | ## 安装 | |
| 21 | 18 | ||
| 22 | 19 | 在Lazarus中安装PlotPanel,你需要做到以下几点: | |
| 23 | 20 | ||
| 24 | 21 | - 下载PlotPanel包 (plotpanel.zip) 在:http://science4all.nl/?Programming:MICAM:Lazarus 或 [Lazarus CCR SourceForge 站点](http://sourceforge.net/project/showfiles.php?group_id=92177&package_id=181065)。 | |
| 25 | 22 | - 解压plotpanel.zip到你选择的目录中。 | |
| 26 | 23 | - 打开Lazarus | |
| 27 | 24 | - 执行安装包时所必须的操作 (参看 [[Install Packages/zh CN|安装包]]). | |
| 28 | 25 | ||
| 29 | 26 | 当你完成上面的操作后,palet组件会在组件工具栏“Extra(额外)”选项卡里。 现在,您可以使用Plotpanel了。 | |
| 30 | 27 | ||
| 31 | 28 | 运行PlotPanelDemo 来探索PlotPanel新功能。N.B.你可以尝试在没有安装PlotPanel 组件的情况下,运行TryPlotPanel! | |
| 32 | 29 | ||
| 33 | 30 | **Plotpanel在Lazarus 0.9.28.x上有个问题** | |
| 34 | 31 | ||
| 35 | 32 | **在我的网站上 (http://science4all.nl/?Programming::Lazarus) 你可以找到更新的版本: PlotPanel-0.97** | |
| 36 | 33 | ||
| 37 | 34 | ## PlotPanel组件描述 | |
| 38 | 35 | ||
| 39 | 36 | 这是一个欠佳的组件描述。示例将演示如何使用组件。 | |
| 40 | 37 | ||
| 41 | 38 | PlotPanel 组件来源于 TCustomPanel组件。 | |
| 42 | 39 | ||
| 43 | 40 | 面板绘图功能被添加。 | |
| 44 | 41 | ||
| 45 | 42 | ## 属性继承自TCustomPanel | |
| 46 | 43 | ||
| 47 | 44 | ||
| 48 | 45 | Align, Anchors, Autosize, BevelInner / Outer / Width | |
| 49 | 46 | ||
| 50 | 47 | Borderspacing, BorderStyle, Borderwidth | |
| 51 | 48 | ||
| 52 | 49 | Color is the color of the border of the plot | |
| 53 | 50 | ||
| 54 | 51 | Constraints, Cursor, Dragmode, Enabled | |
| 55 | 52 | ||
| 56 | 53 | Font is the font of the title of the plot | |
| 57 | 54 | ||
| 58 | 55 | Height, HelpContext, HelpKeyword, HelpType, Hint | |
| 59 | 56 | ||
| 60 | 57 | Left, Name, ParenColor, Parentfont, ParentShowHint | |
| 61 | 58 | ||
| 62 | 59 | PopupMenu, ShowHint, TabOrder, TabStop | |
| 63 | 60 | ||
| 64 | 61 | Tag, Top, Visible, Width | |
| 65 | 62 | ||
| 66 | 63 | ## 添加以下属性 | |
| 67 | 64 | ||
| 68 | 65 | ||
| 69 | 66 | **BackColor** 绘图区域的背景颜色 | |
| 70 | 67 | ||
| 71 | 68 | **GridColor** 网格颜色,当和背景色相同时,会看不到网格 | |
| 72 | 69 | ||
| 73 | 70 | **LayerOption** 对于容易绘制的单层可以设置为假,它是不可能被直接设置为真(参见方法) | |
| 74 | 71 | ||
| 75 | 72 | **Margin** 绘图区边框宽度(单位:像素)。 | |
| 76 | 73 | ||
| 77 | 74 | **PlotMode** 三种模式: pmBar, pmLine 和 pmDot | |
| 78 | 75 | ||
| 79 | 76 | **PlotPen** Properties of the plotting pen. If LayerOption is False, then all sub-properties can be set. If LayerOption is True, then information about the plotting penis transferred via the LayerOptions method (methods) | |
| 80 | 77 | ||
| 81 | 78 | ~~绘图笔属性。如果LayerOption为False,那么所有的子属性可以设置。如果LayerOption为True,则有关绘图笔信息通过LayerOptions方法转移(方法)~~ | |
| 82 | 79 | ||
| 83 | 80 | **Title** 标题在图的顶部居中位置,并使用Font属性 | |
| 84 | 81 | ||
| 85 | 82 | **PlotBMP** 这是一个位图的整体图(见演示使用) | |
| 86 | 83 | ||
| 87 | 84 | **x轴属性:** | |
| 88 | 85 | ||
| 89 | 86 | ||
| 90 | 87 | **XLabel** X轴标签 | |
| 91 | 88 | ||
| 92 | 89 | **XMarks** 为真时,X轴标记 | |
| 93 | 90 | ||
| 94 | 91 | **XMarksFont** 标记字体 | |
| 95 | 92 | ||
| 96 | 93 | **XMarksInterval** 网络线间隔(适用于线性标尺) | |
| 97 | 94 | ||
| 98 | 95 | **XMax** X最大可见值 | |
| 99 | 96 | ||
| 100 | 97 | **XMin** X最小可见值 | |
| 101 | 98 | ||
| 102 | 99 | **XScaleLog** When TRUE the scale is logarithmic (the interval is determined by the component). | |
| 103 | 100 | ||
| 104 | 101 | ~~如果为真线性是对数(间隔由组件来确定)~~ | |
| 105 | 102 | ||
| 106 | 103 | **y轴的相同应用。** | |
| 107 | 104 | ||
| 108 | 105 | ## 方法 | |
| 109 | 106 | ||
| 110 | 107 | **AddXY(X,Y:Extended)** | |
| 111 | 108 | ||
| 112 | 109 | 使用这这个方法,你可以绘制点或线。 | |
| 113 | 110 | ||
| 114 | 111 | 示例 | |
| 115 | 112 | ||
| 116 | 113 | ``` pascal | |
| 117 | 114 | for i:= -10 to 10 do | |
| 118 | 115 | PlotPanel1.AddXY(i,i*i) | |
| 119 | 116 | ``` | |
| 120 | 117 | ||
| 121 | 118 | This plots a parbola .The line is plotted with the PlotPen properties. | |
| 122 | 119 | ||
| 123 | 120 | ~~此绘制了parbola ,PlotPen 属性绘制线。注意你只能绘制单层。~~ | |
| 124 | 121 | ||
| 125 | 122 | **AddXY(X,Y:Extended, Color:Tcolor,Layer:Integer)** | |
| 126 | 123 | ||
| 127 | 124 | 用这种方法,可以绘制多达8条不同颜色的线,plotmodes和penwidths(见LayerOptions如何设置线宽和plotmodes) | |
| 128 | 125 | ||
| 129 | 126 | **LayerOptions(Layer:Integer;PlotMode:TPlotMode;PenWidth:Integer)** | |
| 130 | 127 | ||
| 131 | 128 | 每一层可以使用不同的Plotmode和PenWidth当你调用这个方法LayerOPtion将被设置为TRUE。 | |
| 132 | 129 | ||
| 133 | 130 | 当你想再次使用单层你必须设置LayerOption为假! | |
| 134 | 131 | ||
| 135 | 132 | **Autoscale(Layer:Integer)** | |
| 136 | 133 | ||
| 137 | 134 | 有了这个方法,可以自动调整图形大小。 | |
| 138 | 135 | ||
| 139 | 136 | **ClearData** | |
| 140 | 137 | ||
| 141 | 138 | 清除绘图数据 | |
| 142 | 139 | ||
| 143 | 140 | **ConvertS2W(x,y: Extended; var WX,WY : Extended)** | |
| 144 | 141 | ||
| 145 | 142 | 转换屏幕坐标X,Y为实际坐标WX,WY。当X和Y超出边界时,函数返回False,否则真。 | |
| 146 | 143 | ||
| 147 | 144 | **Freeze(Boolean)** | |
| 148 | 145 | ||
| 149 | 146 | When Freeze(True) is executed all plotting is done on a invisible bitmap. | |
| 150 | 147 | ||
| 151 | 148 | ~~当Freeze(True)时执行所有绘图上完成一个无形位图。~~ | |
| 152 | 149 | ||
| 153 | 150 | After a Freeze(False) the whole plot is displayed. This produces flicker-free animations. | |
| 154 | 151 | ||
| 155 | 152 | ~~当Freeze(False)时,将显示整个绘图。这将产生无闪烁的动画。~~ | |
| 156 | 153 | ||
| 157 | 154 | **HideLayer(Layer:Integer)** | |
| 158 | 155 | ||
| 159 | 156 | 使用这个隐藏单层绘图 | |
| 160 | 157 | ||
| 161 | 158 | **UnHideLayer(Layer:Integer)** | |
| 162 | 159 | ||
| 163 | 160 | 显示隐藏层 N.B. When you add points to a hidden layer, the old layer is deleted and the new points are the only points in this layer! | |
| 164 | 161 | ||
| 165 | 162 | ~~当指向一个隐藏层,老层被删除,新点也是唯一的点在这一层!~~ | |
| 166 | 163 | ||
| 167 | 164 | **Paint** | |
| 168 | 165 | ||
| 169 | 166 | 重绘整图(必要时由系统自动完成) | |
| 170 | 167 | ||
| 171 | 168 | Marien van Westen | |
| 172 | 169 | ||
| 173 | 170 | --- | |
| 174 | 171 | *From the Free Pascal wiki, page "PlotPanel/zh CN", as it stood on 2020-02-23 after a change by Trev, out of the wiki's dump of 2024-05-26. Copyright stays with the author who wrote it, according to the old wiki's [[Licensing]] page. If you have concerns about this material, [message the admin](/wiki-contact).* | |
| 175 | 172 | Category: Charting/zh CN | |
| 176 | 173 | Category: Components/zh CN | |
| 177 | 174 | Category: Graphics/zh CN | |
| 178 | 175 | Category: zh |