

PlotPanel
Deutsch · English · Español · Français · Português · 中文(中国)
Warning: Currently, PlotPanel is not in active development and is maintained for compatibility only. Please consider using Functional series of TAChart package instead.
Plotpanel
PlotPanel is a component for Lazarus to replace (more or less) the TChart component. With some modification it can also be used with Kylix, Delphi 5, 6 or 7.
With PlotPanel you can draw line- , dot- and bar-graphs. Animated graphs are also possible.
This software is presented as is, without any written warranty. So use the software at your own risk.
Screenshot
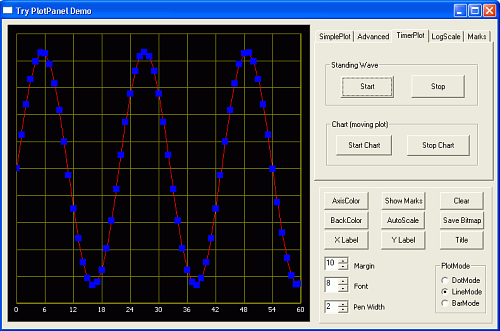
Installation
To Install the PlotPanel component in Lazarus you have to do the following:
- Download the PlotPanelpackage (plotpanel.zip) from: http://science4all.nl/?Programming:MICAM:Lazarus or from Lazarus CCR SourceForge site.
- Unzip plotpanel.zip in a directory of your choice.
- Start Lazarus
- Perform the necessairy actions to intall the package (see Install Packages).
After you have done that all, there must be a new Tab in the component palet with the name "Extra". You can use the Plotpanel now
Run the PlotPanelDemo to explore the features of PlotPanel. N.B. You can try PlotPanel without installing the component by running TryPlotPanel!
'''There was a problem with Plotpanel in Lazarus 0.9.28.x
On my website (http://science4all.nl/?Programming:MICAM:Lazaruss you can find the updated version: PlotPanel-0.97
Description of the PlotPanel component
This is a very rude description of the component. See the examples for an explanation of how to use the component. The PlotPanel component is derived from the TCustomPanel-component. To this Panel plotting capabilities are added.
Properties inherited from TCustomPanel
Align, Anchors, Autosize, BevelInner / Outer / Width
Borderspacing, BorderStyle, Borderwidth
Color is the color of the border of the plot
Constraints, Cursor, Dragmode, Enabled
Font is the font of the title of the plot
Height, HelpContext, HelpKeyword, HelpType, Hint
Left, Name, ParenColor, Parentfont, ParentShowHint
PopupMenu, ShowHint, TabOrder, TabStop
Tag, Top, Visible, Width
The following properties are added
BackColorThis is the background color of the plotting area
GridColorWhen you make this the same as Backcolor, the grid is invisible
LayerOptionFor easy plotting of a single layer this can be set to False. It is not possible to set this to True directly (see methods)
Margin The width of the border of the plot in pixels
PlotMode Three plotmodes are possible: pmBar, pmLine and pmDot
PlotPen Properties of the plotting pen. If LayerOption is False, then all sub-properties can be set. If LayerOption is True, then information about the plotting pen is transferred via the LayerOptions method (methods)
Title The Title is at the top center of the plot and uses the Font property
PlotBMP This is a bitmap holding the whole graph (see demo for its use)
The X-axis properties:
XLabel Label at the X-axis
XMarks When True, the X-axis has marks
XMarksFont Font used for the XMarks
XMarksInterval Interval between to lines in the grid (applies for linear scales only)
XMax Maximum value of X that is visible
XMinMinimal value of X that is visible
XScaleLogWhen TRUE the scale is logarithmic (the interval is determined by the component)
For the Y-axis the same applies.
Methods:
AddXY(X,Y:Extended)
With this method you can add points (or lines) to the plot
Example
for i:= -10 to 10 do
PlotPanel1.AddXY(i,i*i)
This plots a parbola .The line is plotted with the PlotPen properties
Note you can only plot a single layer.
AddXY(X,Y:Extended, Color:Tcolor,Layer:Integer)
With this method it is possible to plot up to 8 lines in different colors,
plotmodes and penwidths (see LayerOptions how to set linewidth and plotmodes)
LayerOptions(Layer:Integer;PlotMode:TPlotMode;PenWidth:Integer)
Every Layer can use a different Plotmode and PenWidth
When you call this method LayerOPtion will be set TRUE. When you want
to use a single Layer again you have to set LayerOption False!
Autoscale(Layer:Integer)
With this method you can adjust the size of the plot automaticly
ClearData
Clears the data on the plot.
ConvertS2W(x,y: Extended; var WX,WY : Extended)
Converts the screen-coordinates in X,Y to the real coordinates WX,WY. When
X and Y are out of bounds, the function returns False, otherwise True
Freeze(Boolean)
When Freeze(True) is executed all plotting is done on a invisible bitmap.
After a Freeze(False) the whole plot is displayed. This produces flicker-free
animations.
HideLayer(Layer:Integer)
Use this to hide a single layer in the plot
UnHideLayer(Layer:Integer)
Shows the hidden layer again
N.B. When you add points to a hidden layer, the old layer is deleted and the
new points are the only points in this layer!
Paint
Repaints the whole Graph (is done automaticly by the system when necessairy)
Marien van Westen
From the Free Pascal wiki, page "PlotPanel", as it stood on 2016-07-18 after a change by Arent, out of the wiki's dump of 2024-05-26. Copyright stays with the author who wrote it, according to the old wiki's Licensing page. If you have concerns about this material, message the admin.
Talk about this page
Nobody has opened a bench for this page yet. Sign in to open one.