

NiceChart: what changed
Revision 1 to 2. Removed lines have a minus sign; added lines have a plus sign.
| Old | New | Line | |
|---|---|---|---|
| 1 | 1 | The following text is based on the *readme.html* file which is included in the *NiceChart* installation directory. It is written by the original author of the component, [[priyatna.org|Priyatna]]. The text was also published on the author's web site which, however, is not available any more. | |
| 2 | 2 | ||
| 3 | 3 | ## Introduction | |
| 4 | 4 | ||
| 5 | - | ||
| 6 | - | ||
| 7 | - | ||
| 8 | - | ||
| 5 | + | 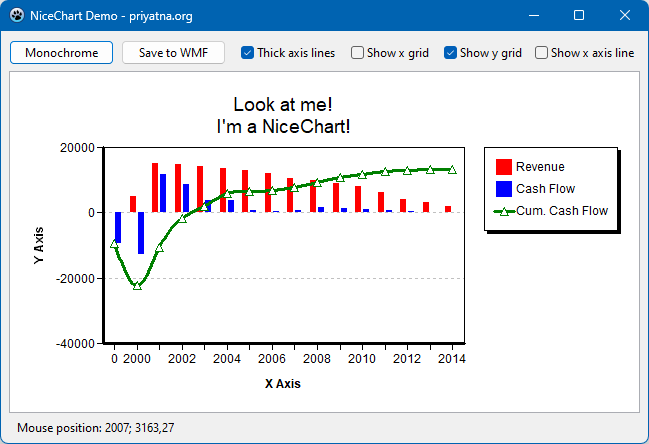 | |
| 9 | 6 | ||
| 10 | 7 | Once I need a chart component that can shows interpolated lines for one of my project. I don't need a sophisticated full-featured chart, I just need a simple one with basic functionalities. Don't find a way to do it with standard Delphi TChart component, I decided to write my own. | |
| 11 | 8 | ||
| 12 | 9 | Currently it has three graph styles: lines, smooth lines with B-Splines, and bars. It has multi-lined title, legend, automatic y-axis, and supports multiple series. It also can produce a monochrome version of the graph using monochromatic brushes. Those features are sufficient for my programming needs. | |
| 13 | 10 | ||
| 14 | 11 | I learned a lot from creating this component. I learned the algorithm to pick axis value range that are aligned to zero from an arbitrary set of values. I also learned some linear interpolation algoritms, although currently only B-splines that is accomodated in this component. And finally I understand why there's only a handful chart component out there. | |
| 15 | 12 | ||
| 16 | 13 | ## Version History | |
| 17 | 14 | ||
| 18 | 15 | ### Version 2.0 | |
| 19 | 16 | ||
| 20 | - | ||
| 17 | + | Released: June 2023 - Ported to Lazarus, cross-platform - Some new properties: ShowXAxisLine, `ShowYAxisLine`, `GridColor`, `AxisLineWidth`, `TickLength`, `NiceSeries.LineWidth` | |
| 21 | 18 | ||
| 22 | 19 | ### Version 1.1 | |
| 23 | 20 | ||
| 24 | 21 | Released: January 12nd, 2008 - bug fixed: title not centered - bug fixed: empty series - soft colors | |
| 25 | 22 | ||
| 26 | 23 | ### Version 1.0 | |
| 27 | 24 | ||
| 28 | 25 | Released: May 26th, 2007 - Initial release | |
| 29 | 26 | ||
| 30 | 27 | ## License | |
| 31 | 28 | ||
| 32 | 29 | This library is released under Mozilla Public License. You can use it in your freeware, shareware or commercial softwares. You can send your modification to me, and if I decide to include it in the main distribution, I will add your name as a contributor. You can read full licensing information in the file "License.txt" in the NiceChart installation folder. | |
| 33 | 30 | ||
| 34 | 31 | ## Download and installation | |
| 35 | 32 | ||
| 36 | 33 | The easiest way for Lazarus users is to get the package from the [[Online Package Manager]] (OPM) which is installed with newer Lazarus versions. Simply open its menu item, check "NiceChart" in the tree list, and click "Install". Then OPM will take care of the download and the installation. | |
| 37 | 34 | ||
| 38 | 35 | Since the OPM version may not always be up-to-date, you can also download the development version from the "Lazarus Component and Code Repository" (CCR) where a zipped snapshot is provided (https://sourceforge.net/p/lazarus-ccr/svn/HEAD/tree/components/nicechart/). Alternatively, if you use SVN you can use the following SVN command in a console window: | |
| 39 | 36 | ||
| 40 | 37 | svn checkout <svn://svn.code.sf.net/p/lazarus-ccr/svn/components/nicechart> nicechart | |
| 41 | 38 | ||
| 42 | 39 | This applies also for Delphi users. | |
| 43 | 40 | ||
| 44 | 41 | In **Lazarus**, open the *NiceChartLaz.lpk* file in the package editor ("Package" \> "Open Package File (.lpk)"), click "Use" \> "Install", and let the IDE recompile itself. | |
| 45 | 42 | ||
| 46 | 43 | In **Delphi**, open *NiceChartD7.dpk* in the IDE and press the "Install" button. Another package is provided in the download for newer Delphi versions, named *NiceChartXE11*; although tested under Delphi XE11 (Alexandria) it should work in other Delphi versions as well. | |
| 47 | 44 | ||
| 48 | 45 | If you switch between several Delphi versions it may be required to delete the `.res` file of your project. | |
| 49 | 46 | ||
| 50 | 47 | The component will appear on the **priyatna.org** component palette tab. | |
| 51 | 48 | ||
| 52 | 49 | ## Documentation | |
| 53 | 50 | ||
| 54 | 51 | ### Methods | |
| 55 | 52 | ||
| 56 | 53 | There are some main methods of the component: | |
| 57 | 54 | ||
| 58 | - | ||
| 55 | + | - `procedure`` BeginUpdate;` | |
| 59 | 56 | ||
| 60 | 57 | ||
| 61 | 58 | Call this method to prevent control updating its content. This is useful when you want to add bulky data to the chart. Don't forget to call \<bb\>EndUpdate\</bb\> when you are done supplying data. | |
| 62 | 59 | ||
| 63 | - | ||
| 60 | + | - `procedure`` EndUpdate;` | |
| 64 | 61 | ||
| 65 | 62 | ||
| 66 | 63 | Call this method to reenable update. You must call `BeginUpdate` prior to call this method. | |
| 67 | 64 | ||
| 68 | - | ||
| 65 | + | - `function`` AddSeries(AKind: TSeriesKind): TNiceSeries;` | |
| 69 | 66 | ||
| 70 | 67 | ||
| 71 | 68 | Add a new series to the chart. A series can be a bar, line or smooth line type. | |
| 72 | 69 | ||
| 73 | - | ||
| 70 | + | - `function`` ClientToChart(``const`` X, Y: Integer; ``var`` AX, AY: Double): Boolean;` | |
| 74 | 71 | ||
| 75 | 72 | ||
| 76 | 73 | Call this function to get X-axis and Y-axis value from mouse position. The X and Y parameters are the mouse position, and the corresponding X-axis and Y-axis values are stored in AX and AY variables. This function returns `True` if the supplied mouse position is within the X-axis and Y-axis range. Otherwise, it returns False. | |
| 77 | 74 | ||
| 78 | - | ||
| 75 | + | - `procedure`` RemoveSeries(ASeries: TNiceSeries);` | |
| 79 | 76 | ||
| 80 | 77 | ||
| 81 | 78 | Removes a series from the chart. | |
| 82 | 79 | ||
| 83 | - | ||
| 80 | + | - `procedure`` Clear;` | |
| 84 | 81 | ||
| 85 | 82 | ||
| 86 | 83 | Removes all series from the chart. | |
| 87 | 84 | ||
| 88 | - | ||
| 85 | + | - `function`` CreateMetafile: TMetafile;` | |
| 89 | 86 | ||
| 90 | 87 | ||
| 91 | 88 | Creates a metafile (WMF) from the chart. This function is useful when you want to save the content of the chart to a file. Not available in the Lazarus version. | |
| 92 | 89 | ||
| 93 | - | ||
| 90 | + | - `procedure`` CopyToClipboard;` | |
| 94 | 91 | ||
| 95 | 92 | ||
| 96 | 93 | Copies the content of the chart to the clipboard. The content can be pasted in any application as a graphic image. Not available in Lazarus. | |
| 97 | 94 | ||
| 98 | 95 | ### Properties | |
| 99 | 96 | ||
| 100 | 97 | These are the main properties of the component: | |
| 101 | 98 | ||
| 102 | - | ||
| 99 | + | - `property`` Series[Index: Integer]: TNiceSeries;` | |
| 103 | 100 | ||
| 104 | 101 | ||
| 105 | 102 | A collection of series that is contained in the chart. | |
| 106 | 103 | ||
| 107 | - | ||
| 104 | + | - `property`` SeriesCount: Integer;` | |
| 108 | 105 | ||
| 109 | 106 | ||
| 110 | 107 | Specifies how many series are in the chart. | |
| 111 | 108 | ||
| 112 | - | ||
| 109 | + | - `property`` ShowLegend: Boolean;` | |
| 113 | 110 | ||
| 114 | 111 | ||
| 115 | 112 | Shows or hides legend. Set to `True` to show the legend, or set to `False` to hide it. | |
| 116 | 113 | ||
| 117 | - | ||
| 114 | + | - `property`` ShowTitle: Boolean;` | |
| 118 | 115 | ||
| 119 | 116 | ||
| 120 | 117 | Shows or hides title. Set to `True` to show the title, or set to `False` to hide it. | |
| 121 | 118 | ||
| 122 | - | ||
| 119 | + | - `property`` ShowXGrid: Boolean;` | |
| 123 | 120 | ||
| 124 | 121 | ||
| 125 | 122 | Shows or hides horizontal grid. Set to `True` to show the grid, or set to `False` to hide it. | |
| 126 | 123 | ||
| 127 | - | ||
| 124 | + | - `property`` ShowYGrid: Boolean;` | |
| 128 | 125 | ||
| 129 | 126 | ||
| 130 | 127 | Shows or hides vertical grid. Set to `True` to show the grid, or set to `False` to hide it. | |
| 131 | 128 | ||
| 132 | - | ||
| 129 | + | - `property`` Title: string;` | |
| 133 | 130 | ||
| 134 | 131 | ||
| 135 | 132 | Specifies title of the chart. You can use a multi-lined title separated by \#13 (carriage return). | |
| 136 | 133 | ||
| 137 | - | ||
| 134 | + | - `property`` TitleFont: TFont;` | |
| 138 | 135 | ||
| 139 | 136 | ||
| 140 | 137 | Specifies title font name, size, color and styles (bold, italic, underline or strike-out). | |
| 141 | 138 | ||
| 142 | - | ||
| 139 | + | - `property`` AxisXTitle: string;` | |
| 143 | 140 | ||
| 144 | 141 | ||
| 145 | 142 | Specifies horizontal axis title. | |
| 146 | 143 | ||
| 147 | - | ||
| 144 | + | - `property`` AxisYTitle: string;` | |
| 148 | 145 | ||
| 149 | 146 | ||
| 150 | 147 | Specifies vertical axis title. | |
| 151 | 148 | ||
| 152 | - | ||
| 149 | + | - `property`` AxisXOnePerValue: Boolean;` | |
| 153 | 150 | ||
| 154 | 151 | ||
| 155 | 152 | Forces the chart to treat each x-axis value as a different value, so all point or bar can be viewed even though they have same x value. | |
| 156 | 153 | ||
| 157 | - | ||
| 154 | + | - `property`` AxisXScale: Single;` | |
| 158 | 155 | ||
| 159 | 156 | ||
| 160 | 157 | You can scale the horizontal axis so it shows different values than the original data. This is useful, for example, if you want to supply the data in real values, but want to show the axis in thousands. In this case, simply set this property to `1000`. | |
| 161 | 158 | ||
| 162 | - | ||
| 159 | + | - `property`` AxisYScale: Single;` | |
| 163 | 160 | ||
| 164 | 161 | ||
| 165 | 162 | Same as the above, but this is for vertical axis. | |
| 166 | 163 | ||
| 167 | - | ||
| 164 | + | - `property`` Monochrome: Boolean;` | |
| 168 | 165 | ||
| 169 | 166 | ||
| 170 | 167 | If set to `True`, the chart will be drawn in monochrome, using different brush pattern for bars. Otherwise, it will be drawn in color. Colors and brush patterns for each series are automatically choosen by the component. | |
| 171 | 168 | ||
| 172 | 169 | **New properties in v2.0** | |
| 173 | 170 | ||
| 174 | - | ||
| 171 | + | - `property`` AxisLineWidth: Integer;` | |
| 175 | 172 | ||
| 176 | 173 | ||
| 177 | 174 | Width of the pen (in pixels) used to draw the labelled x and y axes at the bottom and left sides of the chart, respectively. | |
| 178 | 175 | ||
| 179 | - | ||
| 176 | + | - `property`` ShowXAxisLine: boolean;` | |
| 180 | 177 | ||
| 181 | 178 | ||
| 182 | 179 | If set to `true`, the logical x axis will be drawn as a horizontal line at `y=0`. | |
| 183 | 180 | ||
| 184 | - | ||
| 181 | + | - `property`` ShowYAxisLine: boolean;` | |
| 185 | 182 | ||
| 186 | 183 | ||
| 187 | 184 | If set to `true`, the logical y axis will be drawn as a vertical line at `x=0`. | |
| 188 | 185 | ||
| 189 | - | ||
| 186 | + | - `property`` GridColor: TColor;` | |
| 190 | 187 | ||
| 191 | 188 | ||
| 192 | 189 | Color of the grid lines. | |
| 193 | 190 | ||
| 194 | - | ||
| 191 | + | - `property`` TrickLength: Integer;` | |
| 195 | 192 | ||
| 196 | 193 | ||
| 197 | 194 | Length of the labelled tick marks at the chart axes. | |
| 198 | 195 | ||
| 199 | 196 | ## Contacts | |
| 200 | 197 | ||
| 201 | 198 | Don't hesitate to report any bug or whish to me: | |
| 202 | 199 | ||
| 203 | 200 | Priyatna Bandung - Indonesia | |
| 204 | 201 | ||
| 205 | 202 | <http://www.priyatna.org/> | |
| 206 | 203 | ||
| 207 | 204 | [mailto:me@priyatna.org](mailto:me@priyatna.org) | |
| 208 | 205 | ||
| 209 | 206 | > **Note:** The http address is no longer available. You may report bugs also in the Lazarus bug tracker for the CCR project. | |
| 210 | 207 | ||
| 211 | 208 | --- | |
| 212 | 209 | *From the Free Pascal wiki, page "NiceChart", as it stood on 2023-06-25 after a change by Wp, out of the wiki's dump of 2024-05-26. Copyright stays with the author who wrote it, according to the old wiki's [[Licensing]] page. If you have concerns about this material, [message the admin](/wiki-contact).* |