

LazProfiler
About
LazProfiler is an IDE addon which adds a One-Click-Profiler to Lazarus.
Screenshot
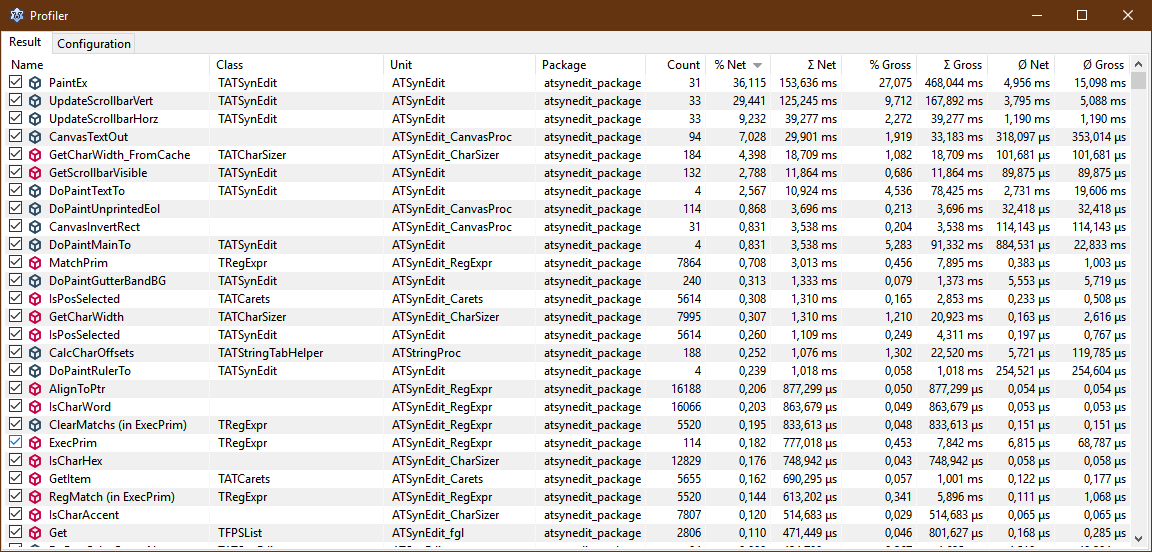 \
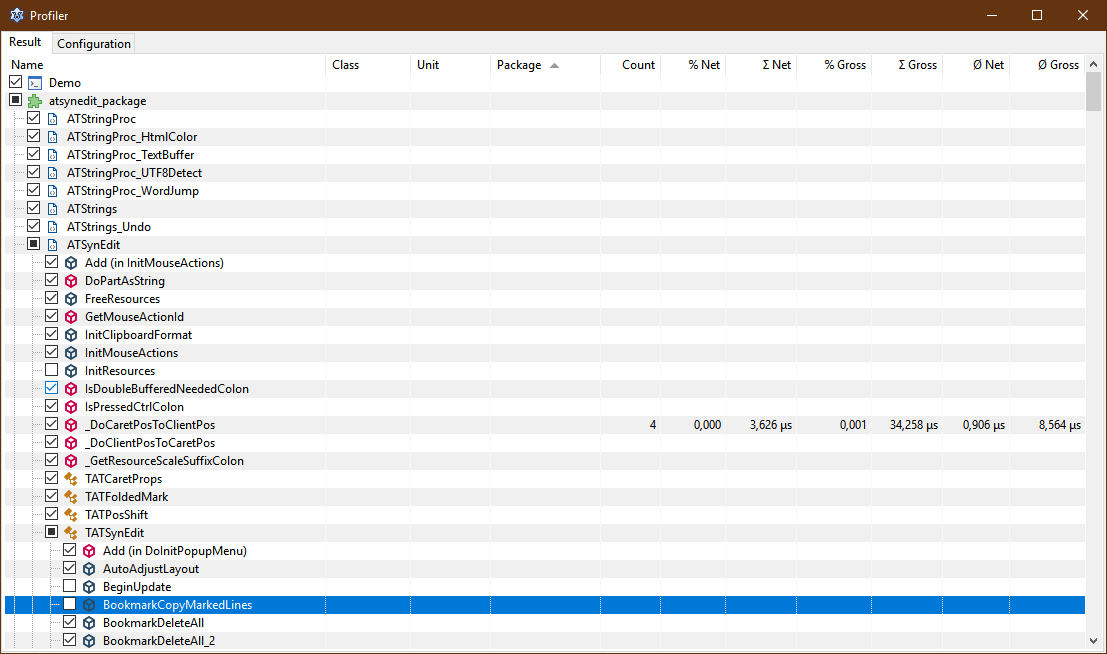
Download
- It's available on GitHub.
System Requirements / Dependencies
- FPC trunk (needs generics and additional PascalParser funktionality) or fixes_3_2
- Lazarus trunk (revision 60719 and above) or fixes_2_0
Installation
Download from here and install manually.
It depends on LCLExtension and EpikTimer.
Support page
http://forum.lazarus.freepascal.org/index.php/topic,38983.0.html
Using LazProfiler
Start profiling
- Open your project (if not done already)
- Activate Profiler:
- Open Configuration:
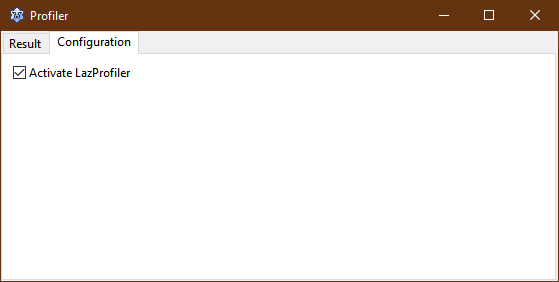
- Check "Activate LazProfiler":
- Open Configuration:
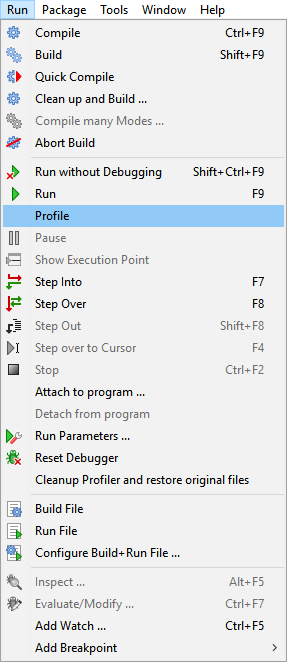
- Choose "Profile" from Run menu:
- Use your program
- Close your program
- study LazProfiler output:
Show output
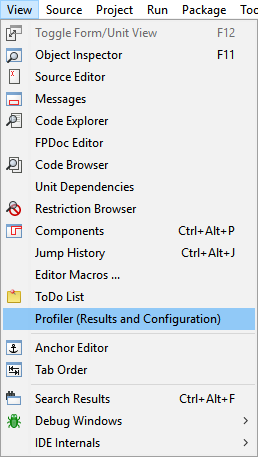
- Choose "Profiler (Results and Configuration)" from View menu:
Cleanup profiler
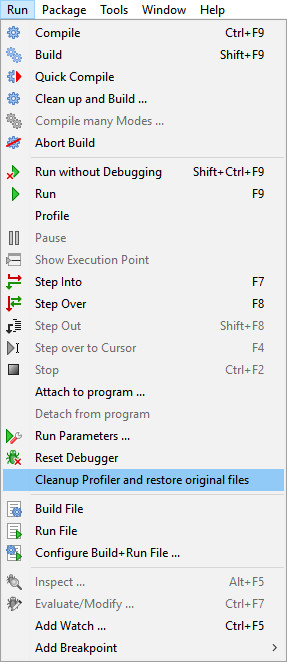
In case the instrumenting of the sources produce not compileable code you can reset the profiler and tidy things up by choosing
"Cleanup Profiler and restore original files" from Run menu:
Influencing profiling
Hints in source code
By default the profiling automatically starts. If you just want to profile some parts of your code you can surround it by two comments:\
// start-profiler
code_to_profile;
// stop-profiler
Disable instrumenting
If you want to exclude procedures/functions/classes/units/packages from beeing instrumented,
just uncheck the checkbox in front of the procedure/function/class/unit/package name
in the profiler output window.
 \
Note: Packages are only visible if tree is sorted by package
Units are onyl visible if tree is sorted by package or unit.
Classes are only visible if tree is sorted by package, unit or class.
How does it work?
When profiling is started the following steps are done:
- project is build to test if project is okay
- all sources in the projects unit and include directories are backuped (except units below fpc and lazarus source directories)
- procedures and funtions in units are instrumented with special profiling code
- project is build with instrumented code
- instumented sources are deleted and backups are restored
- program is run with no debugger
- profiling result is shown when program ends
Known issues
- Profiling does not pause counting at ShowModal, ShowMessage, ...
Version History
- 0.1.0.0
- Initial release
- 0.1.1.0
- leaving sources instrumented if compile after instrumenting fails
- 0.1.2.0
- checking if backup was successfully created before writing instrumented code to original file
- 0.1.3.0
- renamed menu entries
- include IncludePath. Patch by zamtmn.
- minor refactoring
- fixed recognition of declared record in procedure var section
- fixed memory leaks
- 0.2.0.0
- new Result-TreeView
- group by Unit
- group by Object - fixed include handling
- last group and sort column and order is saved to settings file now
- refactoring
- new Result-TreeView
- 0.2.1.0
- fixed recursive directory scan
- do not scan include path
- ignore units belonging to packages
- fixed memory leak
- 0.2.2.0
- Update for Lazarus 2.0
- 0.3.0.0
- profiling of packages (only if outside of Lazarus source directory)
- renamed columns "Net" -> "Σ Net", "Gross" -> "Σ Gross"
- new columns: "% Net", "% Gross", "Ø Net", "Ø Gross"
- fixed parsing of operator functions
- fixed parsing of "START-PROFILER" and "STOP-PROFILER" if inside un-instrumented procedure/function
- Activation of LazProfiler (default is inactive)
From the Free Pascal wiki, page "LazProfiler", as it stood on 2019-10-10 after a change by PascalR, out of the wiki's dump of 2024-05-26. Copyright stays with the author who wrote it, according to the old wiki's Licensing page. If you have concerns about this material, message the admin.
Talk about this page
Nobody has opened a bench for this page yet. Sign in to open one.