

IDE Window: Watch list/de: what changed
Revision 0 to 1. Removed lines have a minus sign; added lines have a plus sign.
Title: IDE Window: Watch list/de
| Old | New | Line | |
|---|---|---|---|
| 1 | + | ## Wichtig | |
| 2 | + | ||
| 3 | + | Sie müssen den [[Debugger Setup|Debugger einrichten]] und das zu untersuchende Projekt starten. Nur dann wird dieses Fenster hilfreich sein. | |
| 4 | + | ||
| 5 | + | ## Liste der überwachten Ausdrücke | |
| 6 | + | ||
| 7 | + | 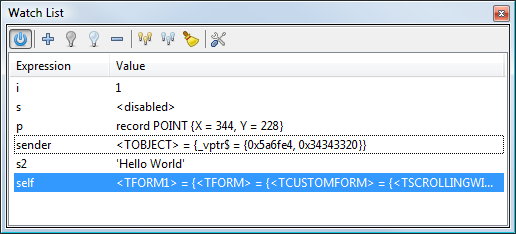 | |
| 8 | + | ||
| 9 | + | The "Watch List" shows the values of variables and expressions ("watches") when the debugged application is paused. (e.g. reached a breakpoint). | |
| 10 | + | ||
| 11 | + | Expressions can be local or global variables, ([[GDB Debugger Tips|certain]]) properties, or pascal expressions (limited support, e.g. "a+1"). [[GDB Debugger Tips|See here for more information]] | |
| 12 | + | ||
| 13 | + | ### Angezeigte Daten | |
| 14 | + | ||
| 15 | + | Die Anzeige besteht aus zwei Spalten: | |
| 16 | + | ||
| 17 | + | - Ausdruck: der zu überwachende Ausdruck oder Variable | |
| 18 | + | - Wert: der aktuelle Wert des Ausdrucks | |
| 19 | + | ||
| 20 | + | Mit einem Doppelklick auf einen Eintrag kann dieser bearbeitet werden. | |
| 21 | + | ||
| 22 | + | #### Scope (Stackframe, Thread, History) | |
| 23 | + | ||
| 24 | + | The values are evaluated according to the scope set in the [[IDE Window: Threads|Thread]] and [[IDE Window: Call Stack|Stack]] dialog. Default is the current Thread and top stack frame. Both (Stack and Frame) dialog offer to change the "current" Frame/Thread. The watch window will follow this selection. | |
| 25 | + | ||
| 26 | + | It is also possible to select previously displayed values, using the [[IDE Window: Debug History|History]] dialog. | |
| 27 | + | ||
| 28 | + | #### Spezielle Werte | |
| 29 | + | ||
| 30 | + | \<invalid\> | |
| 31 | + | Der Wert ist aktuell nicht verfügbar. Can be caused, if the debugger is not active or the debugged app not currently paused. | |
| 32 | + | ||
| 33 | + | \<evaluating\> | |
| 34 | + | Value is currently retrieved. A result will be show soon | |
| 35 | + | ||
| 36 | + | \<disabled\> | |
| 37 | + | The expression is excluded from evaluation. See Disable/Enable buttons (light bulbs) | |
| 38 | + | ||
| 39 | + | Error... | |
| 40 | + | The value could not be evaluated. (Error in Expression or Variable not available in selected scope. | |
| 41 | + | ||
| 42 | + | ### Interface | |
| 43 | + | ||
| 44 | + | Toolbar | |
| 45 | + | ||
| 46 | + |  Power | |
| 47 | + | Enables/Disables all updates. This does not affect the enabled/disabled state of individual watches. This will freeze the current display. | |
| 48 | + | ||
| 49 | + |  Hinzufügen | |
| 50 | + | Add a new expression. This will open the Watch property dialog. (It is also possible to double click an empty line in the list) | |
| 51 | + | ||
| 52 | + |  Aktivieren/ Deaktivieren | |
| 53 | + | Enables/Disables individual watches from evaluation. This can be used to prevent spending time on evaluation, if a watch is not available in the current scope. | |
| 54 | + | ||
| 55 | + |  Löschen | |
| 56 | + | Deletes the selected Watch(es) | |
| 57 | + | ||
| 58 | + |  Alle aktivieren/ Alle deaktivieren | |
| 59 | + | Enables/Disables all watches from evaluation. | |
| 60 | + | ||
| 61 | + |  Alle löschen | |
| 62 | + | Cleans the list | |
| 63 | + | ||
| 64 | + |  Eigenschaften | |
| 65 | + | Change the expression or properties of the current/selected watch. (Also possible by double clicking the watch) | |
| 66 | + | ||
| 67 | + | Kontextmenü 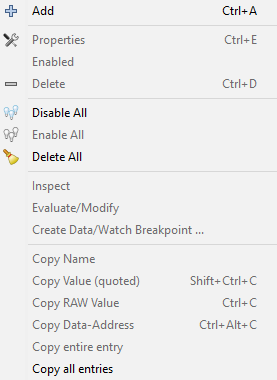 | |
| 68 | + | ||
| 69 | + | Zusätzlich zu den obigen Funktionen erlaubt das Kontextmenü: | |
| 70 | + | ||
| 71 | + | Überprüfung | |
| 72 | + | Opens the current watch in the Debug-Inspector | |
| 73 | + | ||
| 74 | + | Auswerten/Ändern | |
| 75 | + | Opens the current watch in the Evaluate/Modify window | |
| 76 | + | ||
| 77 | + | Datenhaltepunkt erzeugen | |
| 78 | + | Opens the dialog to create a new watchpoint based on the current watch (stop if wachted value is changed or accessed) | |
| 79 | + | ||
| 80 | + | Namen kopieren | |
| 81 | + | kopiert den Ausdruck in die Zwischenablage | |
| 82 | + | ||
| 83 | + | Wert kopieren | |
| 84 | + | kopiert den Wert in die Zwischenablage | |
| 85 | + | ||
| 86 | + | ## Watch Properties | |
| 87 | + | ||
| 88 | + | 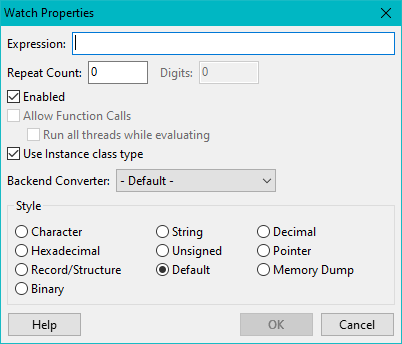 | |
| 89 | + | ||
| 90 | + | Ausdruck | |
| 91 | + | An Expression for which the evaluated value should be shown. Expressions can be local or global variables, ([[GDB Debugger Tips|certain]]) properties, or pascal expressions (limited support, e.g. "a+1"). | |
| 92 | + | ||
| 93 | + | Wiederholungen | |
| 94 | + | nicht implementiert | |
| 95 | + | ||
| 96 | + | Ziffern | |
| 97 | + | nicht implementiert | |
| 98 | + | ||
| 99 | + | Eingeschaltet | |
| 100 | + | See Enable/Disable above | |
| 101 | + | ||
| 102 | + | Funktionsaufrufe zulassen | |
| 103 | + | noch nicht unterstützt | |
| 104 | + | ||
| 105 | + | Use Instance class type | |
| 106 | + | Objects are normally shown according to the declaration of the watched expression. Watching "Sender: TObject" will only show you data that is declared on TObject. However object variables can contain objects of inherited classes. Sender may be a TForm. Using this the debugger will find the actual class of the object and display all data. | |
| 107 | + | ||
| 108 | + | Stil | |
| 109 | + | How to display the data. If a style can not be applied, default will be used. | |
| 110 | + | ||
| 111 | + | "Repeat Count" | |
| 112 | + | ||
| 113 | + | ||
| 114 | + | is implemented in Lazarus 1.1 (SVN, trunk). It can be used to get array slices. The watch specifies the first element of the array "A\[7\]" (must have an index). With a "Repeat count" of 20, this shows A\[7\] to A\[26\]. | |
| 115 | + | ||
| 116 | + | It can also be used with a dynamic array (no index given). Then it specifies haw many elements to show, beginning with DynA\[0\] | |
| 117 | + | ||
| 118 | + | ## Siehe auch | |
| 119 | + | ||
| 120 | + | - Watch-Points (Data-[[IDE Window:Breakpoints|Breakpoints]]) | |
| 121 | + | - [[IDE Window: Evaluate/Modify|Evaluate Window]] | |
| 122 | + | - [[IDE Window: Variable Inspector|Debug Inspector]] | |
| 123 | + | - [[IDE Window: Debug History|Debug History]] | |
| 124 | + | ||
| 125 | + | --- | |
| 126 | + | *From the Free Pascal wiki, page "IDE Window: Watch list/de", as it stood on 2014-05-06 after a change by Swen, out of the wiki's dump of 2024-05-26. Copyright stays with the author who wrote it, according to the old wiki's [[Licensing]] page. If you have concerns about this material, [message the admin](/wiki-contact).* |