

IDE Window: Variable Inspector: what changed
Revision 0 to 1. Removed lines have a minus sign; added lines have a plus sign.
Title: IDE Window: Variable Inspector
| Old | New | Line | |
|---|---|---|---|
| 1 | + | # Important | |
| 2 | + | ||
| 3 | + | You must [[Debugger Setup|setup the debugger]] and start the project to debug it. Only then will this window be useful. | |
| 4 | + | ||
| 5 | + | # Variable Inspector | |
| 6 | + | ||
| 7 | + | Also known as "Debug Inspector" | |
| 8 | + | ||
| 9 | + | 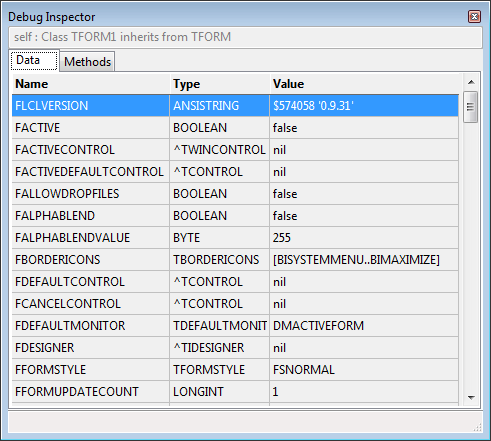 | |
| 10 | + | ||
| 11 | + | This window allows you to watch an expression. If the expression is a structure, then each field is displayed as a separate entry. | |
| 12 | + | ||
| 13 | + | Expressions can be local or global variables, ([[GDB Debugger Tips|certain]]) properties, or Pascal expressions (limited support, e.g. "a+1"). [[GDB Debugger Tips|See here for more information]] | |
| 14 | + | ||
| 15 | + | # Limitations | |
| 16 | + | ||
| 17 | + | - The Variable Inspector does not automatically follow the changes of current Thread or Stack. You can toggle the "use instance class" setting, to refresh the result. | |
| 18 | + | - This dialog is not affected by the [[IDE Window: Debug History|History]] dialog. | |
| 19 | + | - If the result is a structure that has properties, they may not be included. | |
| 20 | + | ||
| 21 | + | # Scope (Stackframe, Thread) | |
| 22 | + | ||
| 23 | + | The values are evaluated according to the scope set in the [[IDE Window: Threads|Thread]] and [[IDE Window: Call Stack|Stack]] dialog at the time you set the expression. The default scope is the current Thread and top stack frame. Both dialogs (Stack and Frame) offer to change the "current" Frame/Thread. | |
| 24 | + | ||
| 25 | + | # Interface | |
| 26 | + | ||
| 27 | + | Setting the value | |
| 28 | + | The interface does not currently provide any method to change the expression from within the dialog. (This was added to Lazarus past version 1.0). | |
| 29 | + | ||
| 30 | + | The value can be set from the [[IDE Window: Watch list|Watch list]] (via context menu of an existing watch) or the [[IDE Window: Evaluate/Modify|Evaluate Window]]. | |
| 31 | + | ||
| 32 | + | Data/Method-Tabs | |
| 33 | + | If the data is a structure with methods, they are displayed separately. | |
| 34 | + | ||
| 35 | + | Context menu | |
| 36 | + | ||
| 37 | + |  | |
| 38 | + | ||
| 39 | + | Use Instance class type | |
| 40 | + | Objects are normally shown according to the declaration of the watched expression. Showing "Sender: TObject" will only show you data, that is declared in TObject. However object variables can contain objects of inherited classes. Sender may be a TForm. Using this the debugger will find the actual class of the object and display all data. | |
| 41 | + | ||
| 42 | + | # See Also | |
| 43 | + | ||
| 44 | + | - [[IDE Window: Watch list|Watch list]] | |
| 45 | + | - [[IDE Window: Evaluate/Modify|Evaluate Window]] | |
| 46 | + | ||
| 47 | + | --- | |
| 48 | + | *From the Free Pascal wiki, page "IDE Window: Variable Inspector", as it stood on 2015-07-01 after a change by FTurtle, out of the wiki's dump of 2024-05-26. Copyright stays with the author who wrote it, according to the old wiki's [[Licensing]] page. If you have concerns about this material, [message the admin](/wiki-contact).* |