

IDE Window: Debugger Options: what changed
Revision 0 to 1. Removed lines have a minus sign; added lines have a plus sign.
Title: IDE Window: Debugger Options
| Old | New | Line | |
|---|---|---|---|
| 1 | + | > **Warning:** This page is outdated. The setting dialog was changed. Options have been moved to new pages and/or the "project settings" | |
| 2 | + | ||
| 3 | + | __toc__ | |
| 4 | + | ||
| 5 | + | ## General | |
| 6 | + | ||
| 7 | + | This article describes the settings in the Tools/Options menu related to debugging. | |
| 8 | + | ||
| 9 | + | In Lazarus 2.2 this frame was replaced by [[IDE Window: DebuggerGeneralOptionsFrame|Debugger General Options]] and [[IDE Window: DebuggerClassOptionsFrame|Debugger Backend Options]] | |
| 10 | + | ||
| 11 | + | 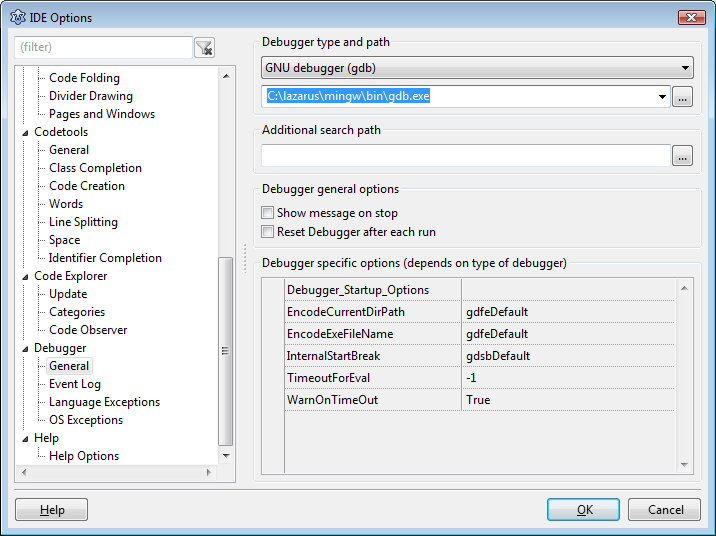 | |
| 12 | + | ||
| 13 | + | ### Debugger type and path | |
| 14 | + | ||
| 15 | + | Choose the debugger. | |
| 16 | + | ||
| 17 | + | None | |
| 18 | + | No debugger. On Run, simply execute the program. | |
| 19 | + | ||
| 20 | + | [[LazDebuggerFp|FpDebug internal Dwarf-debugger]] | |
| 21 | + | ||
| 22 | + | GNU debugger (gdb) | |
| 23 | + | [[GDB]] is not a part of Lazarus. Unless you are using Windows or macOS with Xcode, you must install it yourself. This is the connector to gdb. You must set the path to gdb (for example /usr/bin/gdb) in the field below. | |
| 24 | + | ||
| 25 | + | GNU debugger through SSH | |
| 26 | + | for remote debugging. You can use an SSH connection to another computer and execute gdb there. You need a SSH connection without prompt for password for this. See the SSH documentation on how to do that. This feature has certain limits. [[Remote Debugging|Read more ...]] | |
| 27 | + | ||
| 28 | + | GDB remote debugger (gdbserver) | |
| 29 | + | for remote debugging. | |
| 30 | + | ||
| 31 | + | LLDB Debugger (Alpha) | |
| 32 | + | ||
| 33 | + | LLDB Debugger (with fpdebug) (beta) | |
| 34 | + | ||
| 35 | + | ### Additional search path | |
| 36 | + | ||
| 37 | + | You can add extra directories, where to search for sources, named in the debugging information of the executable. This is used for all projects. | |
| 38 | + | ||
| 39 | + | ### Debugger general options | |
| 40 | + | ||
| 41 | + | Show message on stop | |
| 42 | + | Enable this to show a notification, when programs stops. | |
| 43 | + | ||
| 44 | + | Reset debugger after each run | |
| 45 | + | The IDE keeps GDB running and re-uses it. If you are using a (older) version of GDB that does not support this, then you can start a new GDB instance each time you start a debug session. | |
| 46 | + | ||
| 47 | + | ### Debugger specific options | |
| 48 | + | ||
| 49 | + | Each debugger type has special options. | |
| 50 | + | ||
| 51 | + | #### FpDebug internal Dwarf-debugger | |
| 52 | + | ||
| 53 | + | NextOnlyStopOnStartLine | |
| 54 | + | ||
| 55 | + | #### GNU debugger (gdb) | |
| 56 | + | ||
| 57 | + | Debugger_Startup_Options | |
| 58 | + | Pass extra arguments to GDB. This is not needed for normal usage. This is if you are familiar with GDB and wish to modify it's behaviour. Using this option may interfere with the proper working of the debugger | |
| 59 | + | ||
| 60 | + | DisableLoadSymbolsForLibraries | |
| 61 | + | Prevent loading any symbols from libraries. (Must not be used, if debugging libraries). There are several gdb issues triggered by symbols loaded from libraries. If you get any error mention "solib", try setting this to true. Also see: [[GDB Debugger Tips|GDB_Debugger_Tips#Known_Problems_.2F_Errors_reported_by_the_IDE]] | |
| 62 | + | ||
| 63 | + | EncodeCurrentDirPath/EncodeCurrentFilePath | |
| 64 | + | Experimental. Those option affect the quoting of certain path/filenames when they are given to GDB. Changing the option to the wrong value will stop the debugger from working. | |
| 65 | + | ||
| 66 | + | InternalStartBreak | |
| 67 | + | Changes the way the debugger detects your applications, main entry point. It is advised to leave this at default. Other values may be tried, if the debugger report an error "The debugger could not set a breakpoint on the application''s entry point". | |
| 68 | + | ||
| 69 | + | MaxDisplayLengthForString | |
| 70 | + | For any string (pchar) gdb reads a maximum as specified by this setting. GDB always terminates at the 1st zero. GDB does not really handle pascal strings well. | |
| 71 | + | ||
| 72 | + | UseAsyncCommandMode | |
| 73 | + | Mainly supported by gdbserver. Setting should be used for any remote debugging (gdbserver/gdb over ssh). See gdb documentation for "set target async". IF supported by gdb, can also be used for local debugging. | |
| 74 | + | ||
| 75 | + | WarnOnInternalError | |
| 76 | + | Default true. If set to False, internal errors by gdb will be ignored by the IDE. Yet that does not change, that gdb did have an internal error, and that debugging may report incorrect data, or dis-behave in anyway. Neither will it prevent follow up error. It simple skips informing the user, yet fixes nothing. Leave on true, unless you get repeatedly the same internal error, and have tested well, that it does not affect you. (Then the warning dialog would be annoying, and you may want to skip it) | |
| 77 | + | ||
| 78 | + | TimeOutForEval/WarnOnTimeOut | |
| 79 | + | Read [[GDB Debugger Tips|GDB_Debugger_Tips#TimeOuts]] | |
| 80 | + | ||
| 81 | + | ## Event Log | |
| 82 | + | ||
| 83 | + | 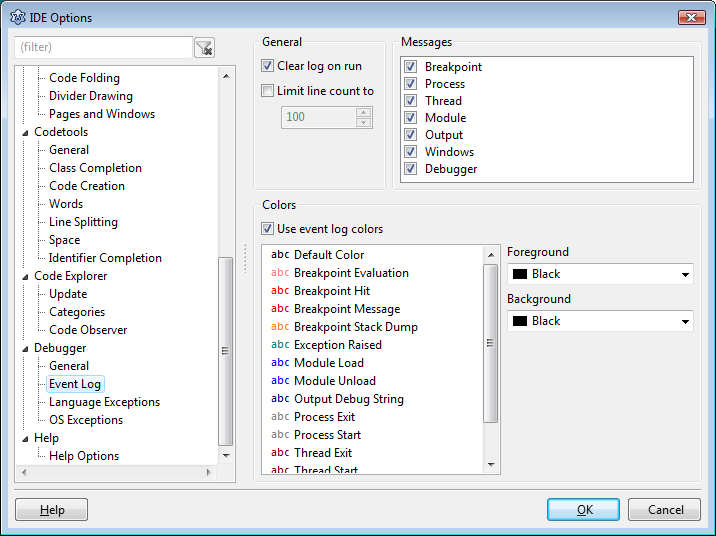 | |
| 84 | + | ||
| 85 | + | ### General | |
| 86 | + | ||
| 87 | + | Eventually logging info should go the the [[IDE Window: Event Log|event log]], for now it is show in the [[IDE Window: Debug Output|debug output]] window. | |
| 88 | + | ||
| 89 | + | - **Clear log on run**: clear the event log, on each start of the program. | |
| 90 | + | - **Limit line count to**: keep only the last lines of output. | |
| 91 | + | ||
| 92 | + | ### Messages | |
| 93 | + | ||
| 94 | + | The Messages window is usually positioned below the source editor and shown, when building the project. It shows the compiler output and can show the output of external tools. | |
| 95 | + | ||
| 96 | + | 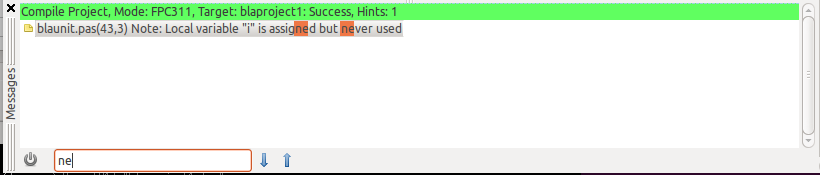 | |
| 97 | + | ||
| 98 | + | See [[IDE Window: Messages]]. | |
| 99 | + | ||
| 100 | + | ## Language Exceptions | |
| 101 | + | ||
| 102 | + | Moved to: [[IDE Window: Project Options - Debugger Language Exceptions]] | |
| 103 | + | ||
| 104 | + | ## See also | |
| 105 | + | ||
| 106 | + | - [[Debugger Setup]] | |
| 107 | + | ||
| 108 | + | --- | |
| 109 | + | *From the Free Pascal wiki, page "IDE Window: Debugger Options", as it stood on 2022-09-04 after a change by Martin, out of the wiki's dump of 2024-05-26. Copyright stays with the author who wrote it, according to the old wiki's [[Licensing]] page. If you have concerns about this material, [message the admin](/wiki-contact).* |