

IDE Window: Debug History: what changed
Revision 0 to 1. Removed lines have a minus sign; added lines have a plus sign.
Title: IDE Window: Debug History
| Old | New | Line | |
|---|---|---|---|
| 1 | + | ## Navigation | |
| 2 | + | ||
| 3 | + | [[Main menu|Main Menu]] \> [[Main menu|View]] \> Debug Windows \> History | |
| 4 | + | ||
| 5 | + | ## Important | |
| 6 | + | ||
| 7 | + | You must [[Debugger Setup|setup the debugger]] and start the project to debug it. Only then this window will be useful. | |
| 8 | + | ||
| 9 | + | ## Debug History | |
| 10 | + | ||
| 11 | + | 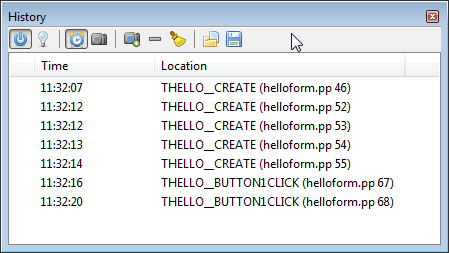 | |
| 12 | + | ||
| 13 | + | The History window shows a list of locations where the application was previously stopped or paused. (e.g. Hit Breakpoint, stopped after stepping). Entries can also be added by none-breaking [[IDE Window:Breakpoints|Breakpoints]]. | |
| 14 | + | ||
| 15 | + | Each time an entry is added locals, watches, stack and threads that are shown/evaluated at the time are stored. The history window allows to select each entry and view the stored values. Stored values can be viewed in there normal viewer windows (e.g. Watch window) which will follow the selection of the history window. | |
| 16 | + | ||
| 17 | + | ## Limitations | |
| 18 | + | ||
| 19 | + | - The history only affects Watches, Locals, Threads, and Stack Window. | |
| 20 | + | ||
| 21 | + | ||
| 22 | + | Other Windows are not affected. Not affected windows keep showing the current data while a history entry is selected | |
| 23 | + | ||
| 24 | + | - Only Watches and Locals in the top stackframe of the current thread are automatically evaluated (available, even if the related viewer windows were closed). Other data is only kept, if it was displayed at the time. (e.g. if the user manually selected another frame, and viewed the watches in the watch window. | |
| 25 | + | - Data evaluation can be aborted, if the user runs or steps the application before the data is ready. In this case it is not available in the history | |
| 26 | + | ||
| 27 | + | ## Data Displayed | |
| 28 | + | ||
| 29 | + | - The time when the entri was taken. This does not indicate how much time the app was running, as it includes paused time. | |
| 30 | + | - The location: if available method name (format depends on type of debug info), and source line. This refers to the thread that was active at the time. | |
| 31 | + | ||
| 32 | + | ## Automatic entries vs (User-taken-) Snapshots | |
| 33 | + | ||
| 34 | + | The main list automatically has an entry added for every time the debugger pauses the app. This list will also remove older entries and keep only the last n entries. | |
| 35 | + | ||
| 36 | + | The 2nd list contains only entries the user selected. Those entries are kept until after the end of the debug session. Entries can be added to this list by either the snapshot button, or the breakpoint-property "take snapshot". | |
| 37 | + | ||
| 38 | + | ## Interface | |
| 39 | + | ||
| 40 | + | Double click | |
| 41 | + | Selects or deselects an entry. If an entry is selected, then [[IDE Window: Watch list|Watch list]], [[IDE Window: Local Variables|Local variables]], [[IDE Window: Call Stack|Stack]] and [[IDE Window: Threads|Thread]] show the history content. | |
| 42 | + | ||
| 43 | + |  Power | |
| 44 | + | If powered off, now history entries will be created. | |
| 45 | + | ||
| 46 | + |  Enable | |
| 47 | + | Indicates/Toggles, if history is shown in other windows. Uses the history entry last set by double click | |
| 48 | + | ||
| 49 | + | / Choose list | |
| 50 | + | Selects list of snapshot.  Automatically created entries, created at each step/pause (if power=on). Contains up to the last 25 entries.  User selected snapshots or snapshots by watches with "take snapshot" option. The list is not limited. | |
| 51 | + | ||
| 52 | + |  Add to selected snapshot list | |
| 53 | + | Adds the current entry to the user selected list. The entry remains in the automatic list, until it is replaced by newer entries. | |
| 54 | + | ||
| 55 | + |  Remove | |
| 56 | + | Deletes one entry from the current list. | |
| 57 | + | ||
| 58 | + |  Delete all | |
| 59 | + | Deletes all entries from the current list. | |
| 60 | + | ||
| 61 | + | / Export/Import | |
| 62 | + | Exports/Imports all entries, including the values for the watches, locals, stack and threads | |
| 63 | + | ||
| 64 | + | ## See also | |
| 65 | + | ||
| 66 | + | - [[IDE Window: Watch list|Watch list]] | |
| 67 | + | - [[IDE Window: Local Variables|Local variables]] | |
| 68 | + | - [[IDE Window: Call Stack|Call Stack]] | |
| 69 | + | - [[IDE Window: Threads|Thread]] | |
| 70 | + | ||
| 71 | + | - [Announcement on the developer Blog](http://lazarus-dev.blogspot.co.uk/2011/05/remember-remember-history-of-debugging.html) | |
| 72 | + | ||
| 73 | + | --- | |
| 74 | + | *From the Free Pascal wiki, page "IDE Window: Debug History", as it stood on 2021-02-01 after a change by Trev, out of the wiki's dump of 2024-05-26. Copyright stays with the author who wrote it, according to the old wiki's [[Licensing]] page. If you have concerns about this material, [message the admin](/wiki-contact).* |