

FPReport Designer: what changed
Revision 1 to 2. Removed lines have a minus sign; added lines have a plus sign.
| Old | New | Line | |
|---|---|---|---|
| 1 | 1 | ## The FPReport Visual report designer | |
| 2 | 2 | ||
| 3 | 3 | The FPReport visual report designer has the following features: | |
| 4 | 4 | ||
| 5 | 5 | - Design a report from scratch using a visual editor. | |
| 6 | 6 | - Define variables | |
| 7 | 7 | - Load/Save report to/from a JSON file | |
| 8 | 8 | - Connect data to the report | |
| 9 | 9 | ||
| 10 | 10 | :* CSV data | |
| 11 | 11 | ||
| 12 | 12 | :* JSON data | |
| 13 | 13 | ||
| 14 | 14 | :* SQLDB data | |
| 15 | 15 | ||
| 16 | 16 | :* DBF Data | |
| 17 | 17 | ||
| 18 | 18 | - Preview data | |
| 19 | 19 | - Export data to known exporters (PDF, Image, HTML) | |
| 20 | 20 | ||
| 21 | 21 | The following is how it will look when working on a report: | |
| 22 | 22 | ||
| 23 | - | ||
| 24 | - | ||
| 25 | - | ||
| 26 | - | ||
| 23 | + | 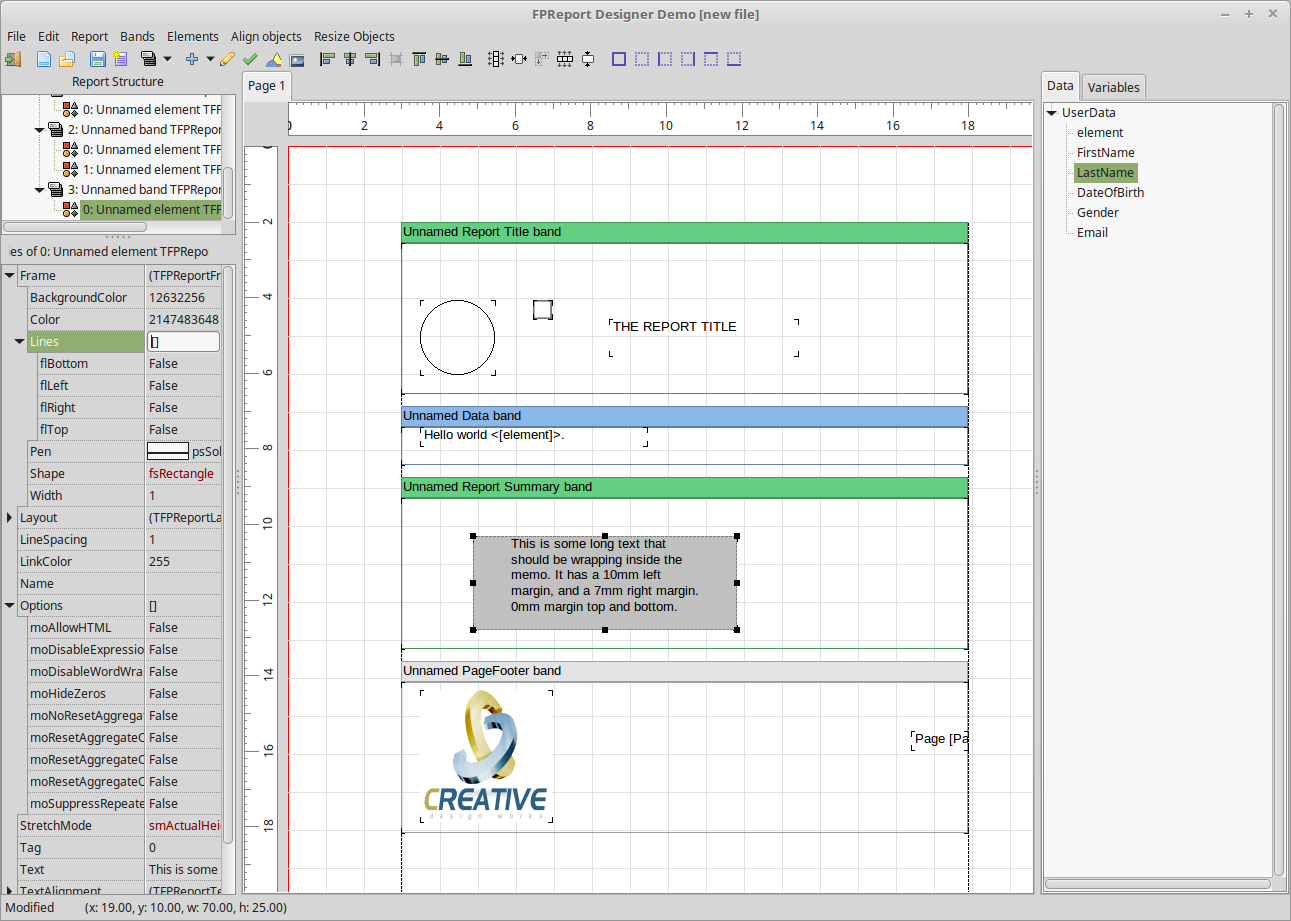 | |
| 27 | 24 | ||
| 28 | 25 | ## usage | |
| 29 | 26 | ||
| 30 | 27 | The Visual report designer is intended to be intuitive, and as such does not require a lot of explanation | |
| 31 | 28 | ||
| 32 | 29 | - To add a data field to a band: drag and drop ot from the data tree view no the right. | |
| 33 | 30 | - Same for functions | |
| 34 | 31 | - ctrl-drag will create a selection rectangle | |
| 35 | 32 | - shift-click can be used to select multiple elements | |
| 36 | 33 | - Move the selection using arrow keys (shift to use bigger step) | |
| 37 | 34 | - Resize the selection using ctrl-arrow keys (shift to use bigger step) | |
| 38 | 35 | ||
| 39 | 36 | Quick explanation of the menu | |
| 40 | 37 | ||
| 41 | 38 | ### File | |
| 42 | 39 | ||
| 43 | 40 | The file menu starts a new report or loads/saves a report from disk. | |
| 44 | 41 | ||
| 45 | 42 | - New - speaks for itself | |
| 46 | 43 | - Open report - load a JSON file with a report from disk. | |
| 47 | 44 | - Save Report - save report to a JSON file. | |
| 48 | 45 | - Quit - exit the report designer | |
| 49 | 46 | ||
| 50 | 47 | ### Edit | |
| 51 | 48 | ||
| 52 | 49 | - Delete - delete the selection | |
| 53 | 50 | ||
| 54 | 51 | Copy & Paste are in the works. | |
| 55 | 52 | ||
| 56 | 53 | ### Report | |
| 57 | 54 | ||
| 58 | 55 | - Add Page : Add a new page to the report. | |
| 59 | 56 | - Properties: set author, 2-pass, title. | |
| 60 | 57 | - Report data : To manage data sources. | |
| 61 | 58 | - Variables: define variables which can be used in expressions | |
| 62 | 59 | ||
| 63 | 60 | ### Bands | |
| 64 | 61 | ||
| 65 | 62 | This can be used to add various types of bands to the report. | |
| 66 | 63 | ||
| 67 | 64 | ### Elements | |
| 68 | 65 | ||
| 69 | 66 | The elements menu can be used to add various types of elements to the report. Currently the following types are supported: | |
| 70 | 67 | ||
| 71 | 68 | - Memo | |
| 72 | 69 | - Shape | |
| 73 | 70 | - Image | |
| 74 | 71 | - Checkbox | |
| 75 | 72 | ||
| 76 | 73 | ### Align objects | |
| 77 | 74 | ||
| 78 | 75 | When multiple objects are selected, this menu can be used to align them: | |
| 79 | 76 | ||
| 80 | 77 | - Align will show the align dialog | |
| 81 | 78 | - All other elements just perform the requested alignment on the selection | |
| 82 | 79 | ||
| 83 | 80 | ### Resize objects | |
| 84 | 81 | ||
| 85 | 82 | When multiple objects are selected, this menu can be used to resize them: | |
| 86 | 83 | ||
| 87 | 84 | - Resize dialog will show the resize dialog | |
| 88 | 85 | - All other elements just perform the requested resize operation on the selection. | |
| 89 | 86 | ||
| 90 | 87 | ## Data | |
| 91 | 88 | ||
| 92 | 89 | The Report - report data menu can be used to define data sources for the report | |
| 93 | 90 | ||
| 94 | - | ||
| 95 | - | ||
| 96 | - | ||
| 97 | - | ||
| 91 | + | 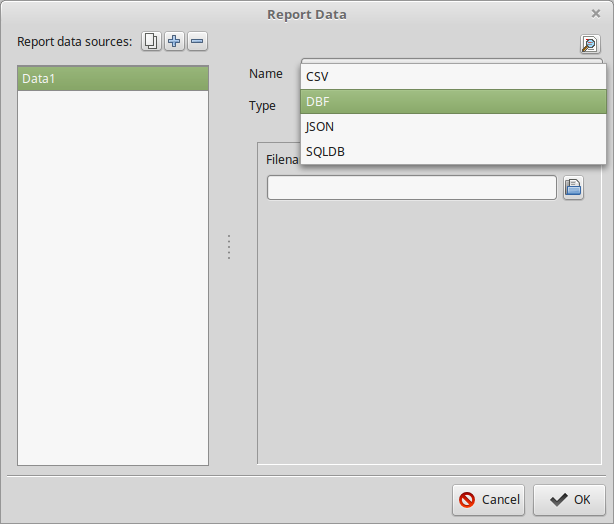 | |
| 98 | 92 | ||
| 99 | 93 | The left side shows a list of available data sources. | |
| 100 | 94 | ||
| 101 | 95 | The buttons above the list will (from left to right): | |
| 102 | 96 | ||
| 103 | 97 | - Clone the currently selected data source. | |
| 104 | 98 | - Add a new data source. | |
| 105 | 99 | - Delete the currently selected data source. | |
| 106 | 100 | ||
| 107 | 101 | At the right, the configuration details of the data source are shown. This means the name, and type of data. | |
| 108 | 102 | ||
| 109 | 103 | Depending on the type, more details can be configured. | |
| 110 | 104 | ||
| 111 | 105 | The "preview" button at the top right can be used to show the dataset in a grid: | |
| 112 | 106 | ||
| 113 | - | ||
| 114 | - | ||
| 115 | - | ||
| 116 | - | ||
| 107 | + | 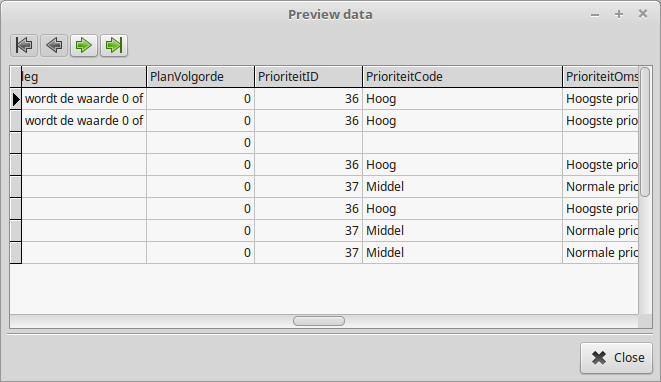 | |
| 117 | 108 | ||
| 118 | 109 | ### DBF | |
| 119 | 110 | ||
| 120 | 111 | Only the filename can be set for a DBF data source. | |
| 121 | 112 | ||
| 122 | - | ||
| 123 | - | ||
| 124 | - | ||
| 125 | - | ||
| 113 | + |  | |
| 126 | 114 | ||
| 127 | 115 | ### CSV | |
| 128 | 116 | ||
| 129 | 117 | For CSV data, some more details can be set: | |
| 130 | 118 | ||
| 131 | 119 | - FileName | |
| 132 | 120 | - Quote character for string fields | |
| 133 | 121 | - separator character between fields | |
| 134 | 122 | - First line contanins fieldsnames: | |
| 135 | 123 | ||
| 136 | 124 | ||
| 137 | 125 | if checked, the first line of the CSV file is expected to contain the field names. | |
| 138 | 126 | ||
| 139 | 127 | - Use the following field names: | |
| 140 | 128 | ||
| 141 | 129 | ||
| 142 | 130 | If checked, the first line is expected to contain data, and the names of the fields must be entered, one per line, in the memo below the radiobutton. | |
| 143 | 131 | ||
| 144 | - | ||
| 145 | - | ||
| 146 | - | ||
| 147 | - | ||
| 132 | + | 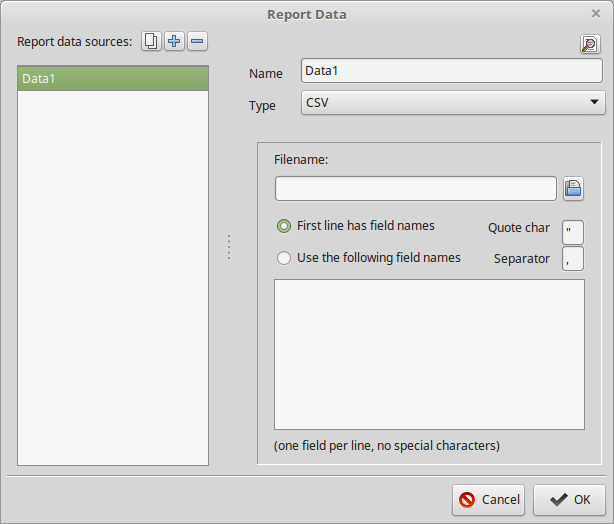 | |
| 148 | 133 | ||
| 149 | 134 | ### JSON | |
| 150 | 135 | ||
| 151 | 136 | For JSON data, there are 2 possibilities for the data source: | |
| 152 | 137 | ||
| 153 | 138 | - A file on disk | |
| 154 | 139 | - A URL | |
| 155 | 140 | ||
| 156 | 141 | Depending on what is chosen, the dialog will load the file from the indicated file or download it from the URL. | |
| 157 | 142 | ||
| 158 | 143 | The following options are still possible: | |
| 159 | 144 | ||
| 160 | 145 | - Path to data array. | |
| 161 | 146 | ||
| 162 | 147 | ||
| 163 | 148 | If the data is not an array, but the actuall data is in some sub-element of the data, then here a path can be entered. | |
| 164 | 149 | ||
| 165 | 150 | The designer will make an intelligent guess at where the data is, when the file/url is opened | |
| 166 | 151 | ||
| 167 | 152 | - Array based records | |
| 168 | 153 | ||
| 169 | 154 | ||
| 170 | 155 | By default, the JSON support expects an array of objects. An array of arrays is also supported. | |
| 171 | 156 | ||
| 172 | 157 | The grid below allows to enter the data type for each of the fields. | |
| 173 | 158 | ||
| 174 | 159 | ||
| 175 | 160 | The designer will make an intelligent guess based on the first row in the array, but e.g. null fields will not be detected correctly. | |
| 176 | 161 | ||
| 177 | 162 | valid types are string, integer, float and boolean | |
| 178 | 163 | ||
| 179 | - | ||
| 180 | - | ||
| 181 | - | ||
| 182 | - | ||
| 164 | + | 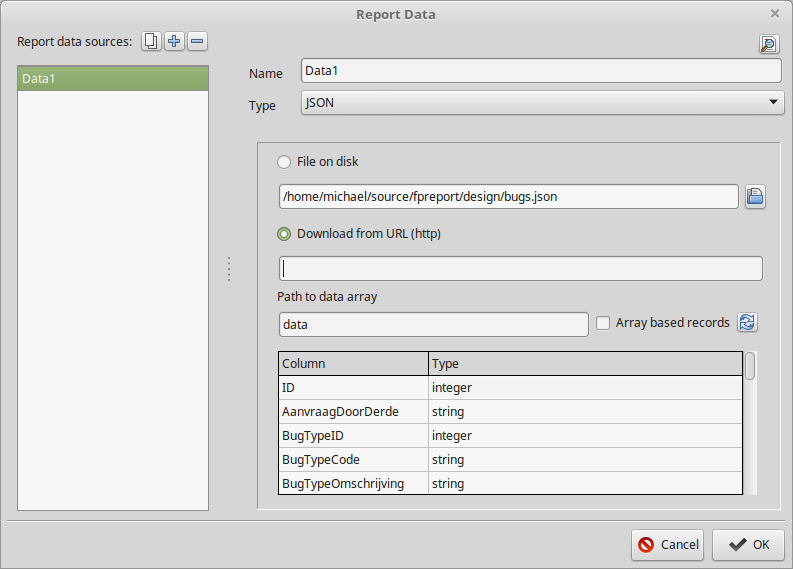 | |
| 183 | 165 | ||
| 184 | 166 | ### SQLDB | |
| 185 | 167 | ||
| 186 | 168 | Any database reachable by SQLDB can be used as a data source for a report. The configuration needs 2 things: | |
| 187 | 169 | ||
| 188 | 170 | - Connection details. These must be entered using the button, which opens the connection editor dialog | |
| 189 | 171 | - SQL Command. Here an SQL Select command can be entered. | |
| 190 | 172 | - The "Test connection" button can be used to verify that the connection is reachable. | |
| 191 | 173 | ||
| 192 | - | ||
| 193 | - | ||
| 194 | - | ||
| 195 | - | ||
| 174 | + | 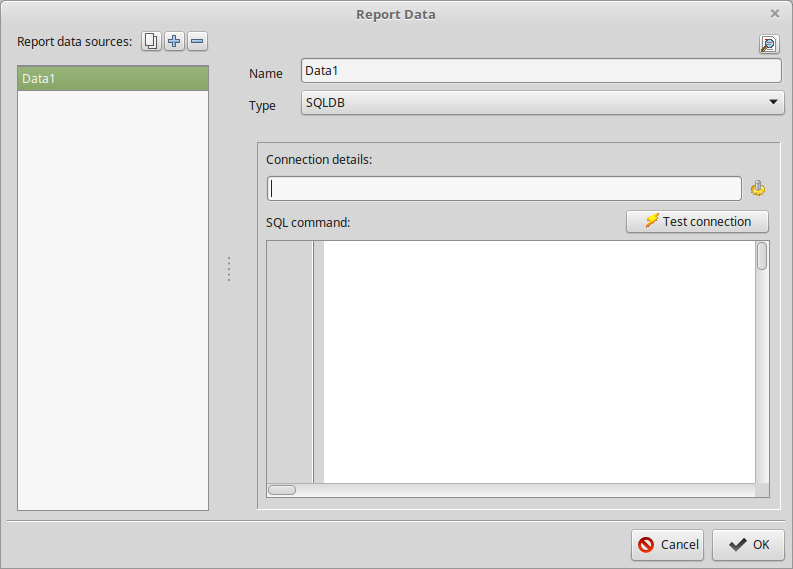 | |
| 196 | 175 | ||
| 197 | 176 | The connection editor allows to edit the connection settings as they exist in SQLDB: | |
| 198 | 177 | ||
| 199 | 178 | - Type: the list depends on the compiled-in SQLDB connections | |
| 200 | 179 | - Hostname: SQL server hostname | |
| 201 | 180 | - Database: DatabaseName | |
| 202 | 181 | - user: username for connection | |
| 203 | 182 | - Password: password of the user | |
| 204 | 183 | - Role: user role | |
| 205 | 184 | - chr.set: character set (UTF8 is recommended) | |
| 206 | 185 | - Additional parameters: | |
| 207 | 186 | ||
| 208 | 187 | ||
| 209 | 188 | here, additional connection-specific parameters can be entered (port no. etc) | |
| 210 | 189 | ||
| 211 | 190 | Again, there is a button to test the connection. | |
| 212 | 191 | ||
| 213 | - | ||
| 214 | - | ||
| 215 | - | ||
| 216 | - | ||
| 192 | + | 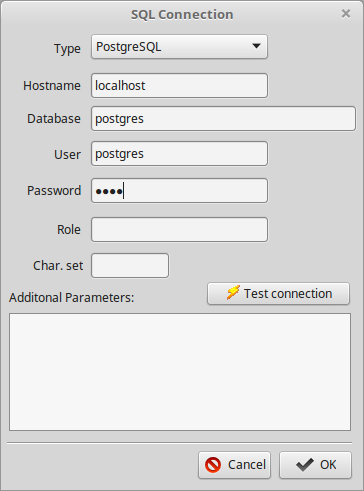 | |
| 217 | 193 | ||
| 218 | 194 | --- | |
| 219 | 195 | *From the Free Pascal wiki, page "FPReport Designer", as it stood on 2018-03-08 after a change by Djzepi, out of the wiki's dump of 2024-05-26. Copyright stays with the author who wrote it, according to the old wiki's [[Licensing]] page. If you have concerns about this material, [message the admin](/wiki-contact).* |