

BGRABitmap tutorial TAChart: what changed
Revision 1 to 2. Removed lines have a minus sign; added lines have a plus sign.
| Old | New | Line | |
|---|---|---|---|
| 1 | 1 | You can make beautiful charts using [[BGRABitmap]]. Add TAChartBGRA package with the project inspector. | |
| 2 | 2 | ||
| 3 | 3 | Maybe the package will not appear in the list or will not be installed. In this case, open it manually with the menu Package, Open package file (.lpk). It must be in *component\tachart*. Then click on the button to install the package. | |
| 4 | 4 | ||
| 5 | 5 | ## Add a TAChart | |
| 6 | 6 | ||
| 7 | 7 | [[TAChart]] in fact has the classname TChart. To add a chart, browse the components, choose Chart tab and click on TChart icon. Click and draw a rectangle on the window to drop it. | |
| 8 | 8 | ||
| 9 | 9 | In order to supply data, click on TRandomChartSource component icon and click once in the window to drop it. In the Object Inspector, define PointsNumber to 10, XMax to 10 and YMax to 10. | |
| 10 | 10 | ||
| 11 | 11 | Now let's create a series that uses this source. To do that, click on your chart and in the Object Inspector, go to Series property. Click on the three dots, and add a *Bar series*. In its properties, go to Source property and choose RandomChartSource1. The chart should be filled with red bars. | |
| 12 | 12 | ||
| 13 | - | ||
| 14 | - | ||
| 15 | - | ||
| 16 | - | ||
| 13 | + | 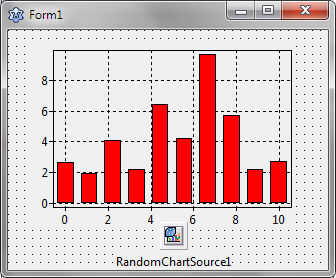 | |
| 17 | 14 | ||
| 18 | 15 | As we are going to do some 3D, we need some depth. So set the Depth property of the series to 10. | |
| 19 | 16 | ||
| 20 | - | ||
| 21 | - | ||
| 22 | - | ||
| 23 | - | ||
| 17 | + | 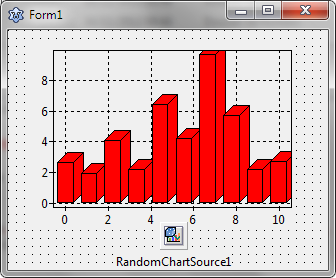 | |
| 24 | 18 | ||
| 25 | 19 | Finally, click on the chart and set the Align property to alClient in order to fill the window. | |
| 26 | 20 | ||
| 27 | 21 | ## Decorate in normal rendering mode | |
| 28 | 22 | ||
| 29 | 23 | Go to the `Series` property of your chart. Choose the bar series, and in the Object Inspector, go to the events and define a handler for the event `OnCustomDrawBar`. Add the following code: | |
| 30 | 24 | ||
| 31 | 25 | ``` pascal | |
| 32 | 26 | uses | |
| 33 | 27 | TADrawUtils, TADrawerCanvas, TABGRAUtils; | |
| 34 | 28 | ||
| 35 | 29 | procedure TForm1.Chart1BarSeries1CustomDrawBar(ASeries: TBarSeries; | |
| 36 | 30 | ADrawer: IChartDrawer; const ARect: TRect; APointIndex, AStackIndex: Integer); | |
| 37 | 31 | var | |
| 38 | 32 | ic: IChartTCanvasDrawer; | |
| 39 | 33 | begin | |
| 40 | 34 | if not Supports(ADrawer, IChartTCanvasDrawer, ic) then | |
| 41 | 35 | raise Exception.Create('This program requires a canvas drawer.'); | |
| 42 | 36 | ||
| 43 | 37 | DrawPhong3DBar(ASeries, ic.Canvas, ARect, APointIndex); | |
| 44 | 38 | end; | |
| 45 | 39 | ``` | |
| 46 | 40 | ||
| 47 | 41 | > **Note:** This code is valid for Lazarus v2.2+. In older versions, the event `TBarSeries.OnBeforeDrawBar` had to be used instead: | |
| 48 | 42 | > | |
| 49 | 43 | > ``` pascal | |
| 50 | 44 | > uses | |
| 51 | 45 | > TABGRAUtils; | |
| 52 | 46 | > | |
| 53 | 47 | > procedure TForm1.BeforeDrawBarHandler(ASender: TBarSeries; ACanvas: TCanvas; | |
| 54 | 48 | > const ARect: TRect; APointIndex, AStackIndex: Integer; var ADoDefaultDrawing: Boolean); | |
| 55 | 49 | > begin | |
| 56 | 50 | > ADoDefaultDrawing:= false; | |
| 57 | 51 | > DrawPhong3DBar(ASender, ACanvas, ARect, APointIndex); | |
| 58 | 52 | > end; | |
| 59 | 53 | > ``` | |
| 60 | 54 | ||
| 61 | 55 | Then run the program. Your chart should look like this: | |
| 62 | 56 | ||
| 63 | - | ||
| 64 | - | ||
| 65 | - | ||
| 66 | - | ||
| 57 | + | 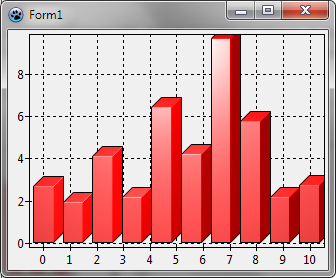 | |
| 67 | 58 | ||
| 68 | 59 | You can also use the `DrawChocolateBar` function. Set `PointsNumber` property of the `RandomChartSource1` to 5. Change the code of the `OnCustomDrawBar` (for Laz 2.2+, or `OnBeforeDrawBar` for older versions) to: | |
| 69 | 60 | ||
| 70 | 61 | ``` pascal | |
| 71 | 62 | uses | |
| 72 | 63 | TADrawUtils, TADrawerCanvas, TABGRAUtils; | |
| 73 | 64 | ||
| 74 | 65 | procedure TForm1.Chart1BarSeries1CustomDrawBar(ASeries: TBarSeries; | |
| 75 | 66 | ADrawer: IChartDrawer; const ARect: TRect; APointIndex, AStackIndex: Integer); | |
| 76 | 67 | var | |
| 77 | 68 | ic: IChartTCanvasDrawer; | |
| 78 | 69 | begin | |
| 79 | 70 | if not Supports(ADrawer, IChartTCanvasDrawer, ic) then | |
| 80 | 71 | raise Exception.Create('This program requires a canvas drawer.'); | |
| 81 | 72 | ||
| 82 | 73 | DrawChocolateBar(ASeries, icCanvas, ARect, APointIndex, True); | |
| 83 | 74 | end; | |
| 84 | 75 | ||
| 85 | 76 | { or for Lazarus before v2.2: | |
| 86 | 77 | ||
| 87 | 78 | procedure TForm1.BeforeDrawBarHandler(ASender: TBarSeries; ACanvas: TCanvas; | |
| 88 | 79 | const ARect: TRect; APointIndex, AStackIndex: Integer; | |
| 89 | 80 | var ADoDefaultDrawing: Boolean); | |
| 90 | 81 | begin | |
| 91 | 82 | ADoDefaultDrawing:= false; | |
| 92 | 83 | DrawChocolateBar(ASender, ACanvas, ARect, APointIndex, True); | |
| 93 | 84 | end;} | |
| 94 | 85 | ``` | |
| 95 | 86 | ||
| 96 | - | ||
| 97 | - | ||
| 98 | - | ||
| 99 | - | ||
| 87 | + | 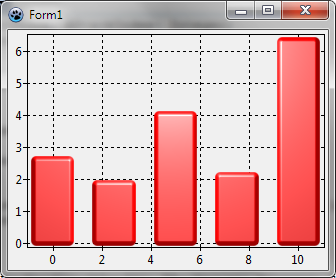 | |
| 100 | 88 | ||
| 101 | 89 | ## Using BGRABitmap to render the whole chart | |
| 102 | 90 | ||
| 103 | 91 | Bars are not very different with or without antialiasing. Go to the Series property and remove the bars, add a *Line series*, and set its Source to RandomChartSource1. Then, set its property Depth to 10 and its SeriesColor property to clRed. | |
| 104 | 92 | ||
| 105 | - | ||
| 106 | - | ||
| 107 | - | ||
| 108 | - | ||
| 93 | + | 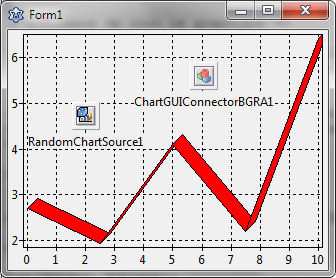 | |
| 109 | 94 | ||
| 110 | 95 | In order to change the rendering engine, look for the TChartGUIConnectorBGRA component in the Chart tab. Click to drop it on the chart. Then, click on the chart background and with the object inspector, set the GUIConnector property by choosing ChartGUIConnectorBGRA1. The rendering is now done with antialiasing, no need to start the program to see: | |
| 111 | 96 | ||
| 112 | - | ||
| 113 | - | ||
| 114 | - | ||
| 115 | - | ||
| 97 | + | 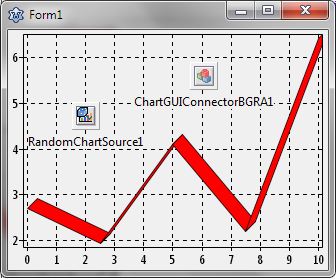 | |
| 116 | 98 | ||
| 117 | 99 | ## Drawing a chart on any Canvas | |
| 118 | 100 | ||
| 119 | 101 | ### Simple drawing | |
| 120 | 102 | ||
| 121 | 103 | First add the TAChartBGRA package. To render your chart, you can for example use a PaintBox. In the OnPaint event, write: | |
| 122 | 104 | ||
| 123 | 105 | ``` pascal | |
| 124 | 106 | uses BGRABitmap, TADrawerBGRA; | |
| 125 | 107 | ||
| 126 | 108 | procedure TForm1.PaintBox1Paint(Sender: TObject); | |
| 127 | 109 | var | |
| 128 | 110 | bmp: TBGRABitmap; | |
| 129 | 111 | id: IChartDrawer; | |
| 130 | 112 | rp: TChartRenderingParams; | |
| 131 | 113 | begin | |
| 132 | 114 | bmp := TBGRABitmap.Create(PaintBox1.Width, PaintBox1.Height); | |
| 133 | 115 | Chart1.DisableRedrawing; | |
| 134 | 116 | try | |
| 135 | 117 | id := TBGRABitmapDrawer.Create(bmp); | |
| 136 | 118 | id.DoGetFontOrientation := @CanvasGetFontOrientationFunc; | |
| 137 | 119 | rp := Chart1.RenderingParams; | |
| 138 | 120 | Chart1.Draw(id, Rect(0, 0, PaintBox1.Width, PaintBox1.Height)); | |
| 139 | 121 | Chart1.RenderingParams := rp; | |
| 140 | 122 | bmp.Draw(PaintBox1.Canvas, 0, 0); | |
| 141 | 123 | finally | |
| 142 | 124 | Chart1.EnableRedrawing; | |
| 143 | 125 | bmp.Free; | |
| 144 | 126 | end; | |
| 145 | 127 | end; | |
| 146 | 128 | ``` | |
| 147 | 129 | ||
| 148 | - | ||
| 149 | - | ||
| 150 | - | ||
| 151 | - | ||
| 130 | + | 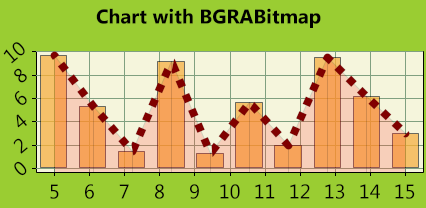 | |
| 152 | 131 | ||
| 153 | 132 | To avoid flickering, consider using TBGRAVirtualScreen from [[BGRAControls]]. | |
| 154 | 133 | ||
| 155 | 134 | ### Text effects | |
| 156 | 135 | ||
| 157 | 136 | To add text effects, you need the latest version of BGRABitmap, and the latest SVN of Lazarus. There is a FontRenderer property in each TBGRABitmap image, that you can define. You must not free the renderer, as it is automatically freed by the image. | |
| 158 | 137 | ||
| 159 | 138 | The text effects are provided by the BGRATextFX unit that contains the TBGRATextEffectFontRenderer class. To add a golden contour to the letters and a shadow, add the following lines: | |
| 160 | 139 | ||
| 161 | 140 | ``` pascal | |
| 162 | 141 | uses BGRATextFX, BGRAGradientScanner; | |
| 163 | 142 | ... | |
| 164 | 143 | var | |
| 165 | 144 | ... | |
| 166 | 145 | fontRenderer: TBGRATextEffectFontRenderer; | |
| 167 | 146 | gold: TBGRAGradientScanner; | |
| 168 | 147 | begin | |
| 169 | 148 | ... | |
| 170 | 149 | fontRenderer:= TBGRATextEffectFontRenderer.Create; | |
| 171 | 150 | fontRenderer.ShadowVisible := true; //adds a shadow | |
| 172 | 151 | fontRenderer.OutlineVisible := true; //show the outline | |
| 173 | 152 | gold := TBGRAGradientScanner.Create(CSSGold,CSSGoldenrod,gtLinear,PointF(0,0),PointF(20,20),true,true); | |
| 174 | 153 | fontRenderer.OutlineTexture := gold; //define the texture used for the outline | |
| 175 | 154 | fontRenderer.OuterOutlineOnly := true; //just the outer pixels of the text | |
| 176 | 155 | bmp.FontRenderer := fontRenderer; //gives the FontRenderer to the image (which becomes the owner of the renderer) | |
| 177 | 156 | ... | |
| 178 | 157 | gold.Free; | |
| 179 | 158 | end; | |
| 180 | 159 | ``` | |
| 181 | 160 | ||
| 182 | - | ||
| 183 | - | ||
| 184 | - | ||
| 185 | - | ||
| 161 | + | 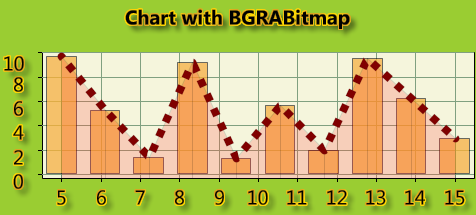 | |
| 186 | 162 | ||
| 187 | 163 | --- | |
| 188 | 164 | *From the Free Pascal wiki, page "BGRABitmap tutorial TAChart", as it stood on 2022-01-09 after a change by Wp, out of the wiki's dump of 2024-05-26. Copyright stays with the author who wrote it, according to the old wiki's [[Licensing]] page. If you have concerns about this material, [message the admin](/wiki-contact).* | |
| 189 | 165 | Category: BGRABitmap | |
| 190 | 166 | Category: Lazarus | |
| 191 | 167 | Category: TAChart | |
| 192 | 168 | Category: Tutorials |