

BGRABitmap tutorial 14/de: what changed
Revision 2 to 3. Removed lines have a minus sign; added lines have a plus sign.
| Old | New | Line | |
|---|---|---|---|
| 1 | - | ||
| 1 | + | Dieses Tutorial zeigt Ihnen, wie Sie die Eigenschaft Canvas2D von BGRABitmap einsetzen können. Canvas2D arbeitet als Javascript-2D-Kontext des HTML-Canvas-Objektes. | |
| 2 | 2 | ||
| 3 | - | ||
| 3 | + | ## Erstes Programm | |
| 4 | 4 | ||
| 5 | - | ||
| 5 | + | Hier ist ein sehr einfaches Beispiel: | |
| 6 | 6 | ||
| 7 | - | ||
| 8 | - | ||
| 9 | - | ||
| 10 | - | ||
| 11 | - | ||
| 7 | + | ``` pascal | |
| 8 | + | procedure TForm1.FormPaint(Sender: TObject); | |
| 9 | + | var bmp: TBGRABitmap; | |
| 10 | + | ctx: TBGRACanvas2D; | |
| 11 | + | begin | |
| 12 | + | bmp := TBGRABitmap.Create(ClientWidth,ClientHeight,BGRA(210,210,210)); | |
| 12 | 13 | ||
| 13 | - | ||
| 14 | + | ctx := bmp.Canvas2D; | |
| 15 | + | ctx.fillStyle('rgb(240,128,0)'); | |
| 16 | + | ctx.fillRect(30,30,80,60); | |
| 17 | + | ctx.strokeRect(50,50,80,60); | |
| 14 | 18 | ||
| 15 | - | ||
| 16 | - | ||
| 17 | - | ||
| 18 | - | ||
| 19 | - | ||
| 20 | - | ||
| 21 | - | ||
| 22 | - | ||
| 23 | - | ||
| 24 | - | ||
| 25 | - | ||
| 26 | - | ||
| 27 | - | ||
| 28 | - | ||
| 29 | - | ||
| 30 | - | ||
| 19 | + | bmp.Draw(Canvas,0,0); | |
| 20 | + | bmp.Free; | |
| 21 | + | end; | |
| 31 | 22 | ``` | |
| 32 | 23 | ||
| 33 | - | ||
| 24 | + | Die Bitmap hat eine Eigenschaft 'Canvas2D', die die Funktionen 'fillRect' und 'strokeRect' zur Verfügung stellt. Der Füllstil (fillStyle) ist festgelegt auf Orange durch die Angabe eines CSS-Farbstrings. Zum Füllen der Figur wird 'fillstyle' verwendet und zum Zeichnen des Randes 'strokestyle'. | |
| 34 | 25 | ||
| 35 | - | ||
| 36 | - | ||
| 37 | - | ||
| 38 | - | ||
| 39 | - | ||
| 40 | - | ||
| 41 | - | ||
| 42 | - | ||
| 43 | - | ||
| 44 | - | ||
| 45 | - | ||
| 26 | + | Der obige Code ist äquivalent zu diesem Javascript-Code : | |
| 27 | + | ||
| 28 | + | ``` javascript | |
| 29 | + | var canvas = document.getElementsByTagName("canvas")[0]; | |
| 30 | + | canvas.width = 200 | |
| 31 | + | canvas.height = 200 | |
| 32 | + | if (canvas.getContext){ | |
| 33 | + | var ctx = canvas.getContext("2d"); | |
| 34 | + | ctx.fillStyle = "rgb(240,128,0)"; | |
| 35 | + | ctx.fillRect(30,30,80,60); | |
| 36 | + | ctx.strokeRect(50,50,80,60); | |
| 37 | + | } | |
| 46 | 38 | ``` | |
| 47 | 39 | ||
| 48 | - | ||
| 40 | + | 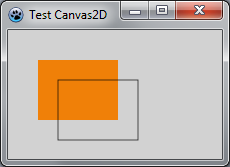 | |
| 49 | 41 | ||
| 50 | 42 | ## Komplexe Figuren | |
| 51 | 43 | ||
| 52 | - | ||
| 53 | - | ||
| 54 | - | ||
| 55 | - | ||
| 56 | - | ||
| 57 | - | ||
| 58 | - | ||
| 59 | - | ||
| 60 | - | ||
| 61 | - | ||
| 62 | - | ||
| 63 | - | ||
| 64 | - | ||
| 65 | - | ||
| 66 | - | ||
| 67 | - | ||
| 68 | - | ||
| 69 | - | ||
| 70 | - | ||
| 71 | - | ||
| 72 | - | ||
| 44 | + | Um komplexe Figuren zu zeichnen, ist es notwendig, einen Pfad zu definieren: | |
| 45 | + | ||
| 46 | + | ``` pascal | |
| 47 | + | procedure pave(); | |
| 48 | + | begin | |
| 49 | + | ctx.fillStyle ('rgb(130,100,255)'); | |
| 50 | + | ctx.strokeStyle ('rgb(0,0,255)'); | |
| 51 | + | ctx.beginPath(); | |
| 52 | + | ctx.lineWidth:=2; | |
| 53 | + | ctx.moveTo(5,5);ctx.lineTo(20,10);ctx.lineTo(55,5);ctx.lineTo(45,18);ctx.lineTo(30,50); | |
| 54 | + | ctx.closePath(); | |
| 55 | + | ctx.stroke(); | |
| 56 | + | ctx.fill(); | |
| 57 | + | end; | |
| 58 | + | ||
| 59 | + | begin | |
| 60 | + | bmp := TBGRABitmap.Create(ClientWidth,ClientHeight,BGRA(210,210,210)); | |
| 61 | + | ctx := bmp.Canvas2D; | |
| 62 | + | pave(); | |
| 63 | + | bmp.Draw(Canvas,0,0); | |
| 64 | + | bmp.Free; | |
| 65 | + | end; | |
| 73 | 66 | ``` | |
| 74 | 67 | ||
| 75 | - | ||
| 68 | + | Beachten Sie, dass die Linienbreite durch die Eigenschaft 'LineWidth' festgelegt ist und dass der Pfad mit dem Aufruf von 'BeginPath' anfängt. Falls Sie mehr Information über die Funktionsweise von 'Path' benötigen, siehe: [javascript documentation](https://developer.mozilla.org/en/Canvas_tutorial/Drawing_shapes). | |
| 76 | 69 | ||
| 77 | - | ||
| 70 | + | 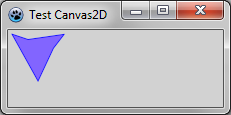 | |
| 78 | 71 | ||
| 79 | 72 | ## Verwendung von Transformationen | |
| 80 | 73 | ||
| 81 | - | ||
| 82 | - | ||
| 83 | - | ||
| 84 | - | ||
| 85 | - | ||
| 86 | - | ||
| 87 | - | ||
| 88 | - | ||
| 89 | - | ||
| 90 | - | ||
| 91 | - | ||
| 92 | - | ||
| 93 | - | ||
| 94 | - | ||
| 95 | - | ||
| 96 | - | ||
| 97 | - | ||
| 98 | - | ||
| 99 | - | ||
| 100 | - | ||
| 101 | - | ||
| 102 | - | ||
| 74 | + | Jetzt können wir das Dreieck sechs Mal mit einer Drehung zeichnen durch Aufruf der Transformationsfunktionen. | |
| 75 | + | ||
| 76 | + | ``` pascal | |
| 77 | + | procedure six(); | |
| 78 | + | var | |
| 79 | + | i: Integer; | |
| 80 | + | begin | |
| 81 | + | ctx.save(); | |
| 82 | + | for i := 0 to 5 do | |
| 83 | + | begin | |
| 84 | + | ctx.rotate(2*PI/6); | |
| 85 | + | pave(); | |
| 86 | + | end; | |
| 87 | + | ctx.restore(); | |
| 88 | + | end; | |
| 89 | + | begin | |
| 90 | + | bmp := TBGRABitmap.Create(ClientWidth,ClientHeight,BGRA(210,210,210)); | |
| 91 | + | ctx := bmp.Canvas2D; | |
| 92 | + | ctx.translate(80,80); | |
| 93 | + | six; | |
| 94 | + | bmp.Draw(Canvas,0,0); | |
| 95 | + | bmp.Free; | |
| 96 | + | end; | |
| 103 | 97 | ``` | |
| 104 | 98 | ||
| 105 | - | ||
| 99 | + | 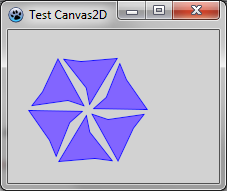 | |
| 106 | 100 | ||
| 107 | 101 | ## Gradienten und Speicherfreigabe | |
| 108 | 102 | ||
| 109 | - | ||
| 110 | - | ||
| 103 | + | Um Farbverläufe zu ermöglichen, besitzt Canvas2D die Funktionen **createLinearGradient** und **createPattern**. Diese Funktionen geben ein Objekt mit Referenzzählung zurück. Sie müssen dieses nicht explizit freigeben. Es wird freigegeben, wenn keine weitere Referenz auf dieses Objekt mehr vorhanden ist. Zum Beispiel: | |
| 104 | + | ||
| 105 | + | ``` pascal | |
| 111 | 106 | var | |
| 112 | - | ||
| 113 | - | ||
| 114 | - | ||
| 115 | - | ||
| 116 | - | ||
| 117 | - | ||
| 118 | - | ||
| 119 | - | ||
| 120 | - | ||
| 121 | - | ||
| 122 | - | ||
| 123 | - | ||
| 124 | - | ||
| 125 | - | ||
| 126 | - | ||
| 127 | - | ||
| 128 | - | ||
| 129 | - | ||
| 107 | + | grad: IBGRACanvasGradient2D; | |
| 108 | + | begin | |
| 109 | + | grad := ctx.createLinearGradient(0,0,320,240); | |
| 110 | + | grad.addColorStop(0.3, '#ff0000'); | |
| 111 | + | grad.addColorStop(0.6, '#0000ff'); | |
| 112 | + | ctx.fillStyle(grad); | |
| 113 | + | ||
| 114 | + | grad := ctx.createLinearGradient(0,0,320,240); | |
| 115 | + | grad.addColorStop(0.3, '#ffffff'); | |
| 116 | + | grad.addColorStop(0.6, '#000000'); | |
| 117 | + | ctx.strokeStyle(grad); | |
| 118 | + | ctx.lineWidth := 5; | |
| 119 | + | ||
| 120 | + | ctx.moveto(160,120); | |
| 121 | + | ctx.arc(160,120,100,Pi/6,-Pi/6,false); | |
| 122 | + | ctx.fill(); | |
| 123 | + | ctx.stroke(); | |
| 124 | + | end; | |
| 130 | 125 | ``` | |
| 131 | 126 | ||
| 132 | - | ||
| 127 | + | Der Variablen 'grad' sind die Gradientenobjekte zugeordnet, aber es erfolgt kein Aufruf von Free. | |
| 133 | 128 | ||
| 134 | - | ||
| 129 | + | 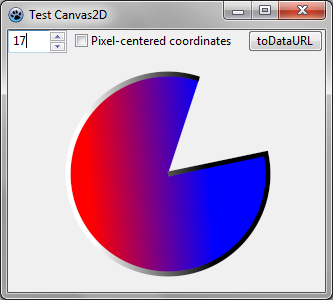 | |
| 135 | 130 | ||
| 136 | 131 | ## Weitere Beispiele | |
| 137 | 132 | ||
| 138 | - | ||
| 133 | + | Andere Beispiele finden Sie im Verzeichnis 'testcanvas2d' des BGRABitmap-Archivs. Die Skripte wurden entnommen von [Jean-Paul Davalan Webseite](https://web.archive.org/web/20190207062328/http://jean-paul.davalan.pagesperso-orange.fr/lang/jsc/js09.html) (Internet Archive link), die auch Beispiele zur HTML-Canvas enthält. | |
| 139 | 134 | ||
| 140 | - | ||
| 135 | + | [[BGRABitmap tutorial 13/de|Voriges Tutorial (Pixelkoordinaten)]] \| [[BGRABitmap tutorial 15/de|Nächstes Tutorial (3D)]] | |
| 141 | 136 | ||
| 142 | 137 | --- | |
| 143 | - | ||
| 138 | + | *From the Free Pascal wiki, page "BGRABitmap tutorial 14/de", as it stood on 2021-05-08 after a change by Trev, out of the wiki's dump of 2024-05-26. Copyright stays with the author who wrote it, according to the old wiki's [[Licensing]] page. If you have concerns about this material, [message the admin](/wiki-contact).* |